 🌊 Lakefront
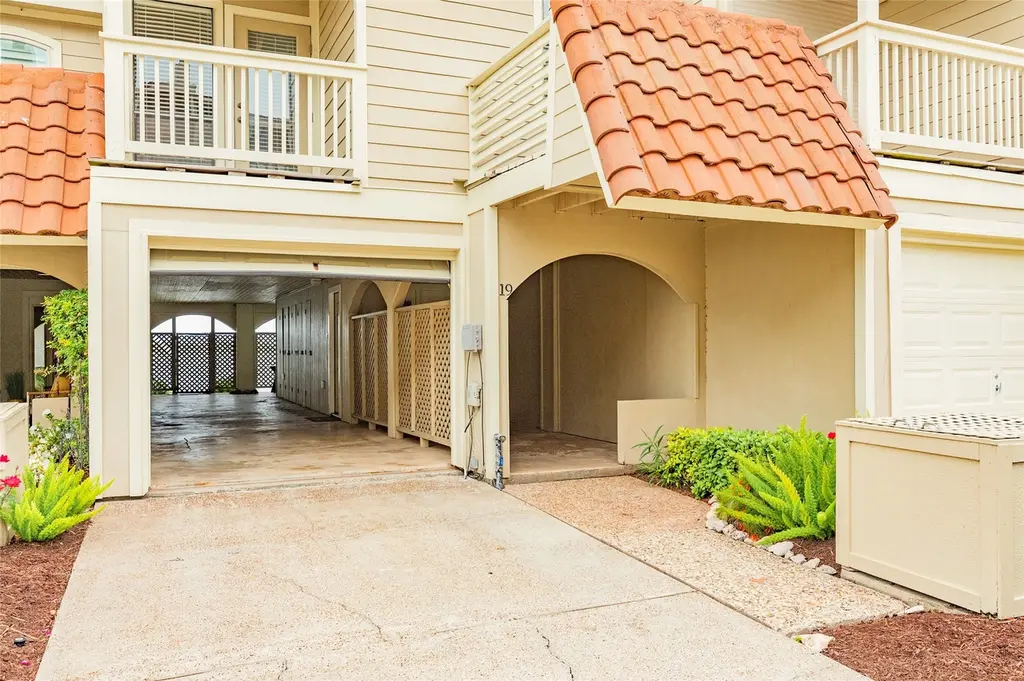
19 Dana Dr Unit C · Galveston, TX
Flood risk 10/10 · Severe
- FEMA flood zone
- AE
- Chance of flooding over 30 yrs
- 0.99%
- Est. flood insurance / yr
- $1,737 – $8,500
Fire risk 1/10 · Minimal
- Est. fire insurance / yr
- $1,222 – $2,270
Heat risk 10/10 · Severe
- Hot days now (above 106°F)
- 7 days/yr
- Hot days in 30 yrs
- 28 days/yr
Wind risk 10/10 · Severe
- Chance of severe wind over 30 yrs
- 99.0%
Air-quality risk 2/10 · Minimal
- Unhealthy air days now
- 2 days/yr
- Unhealthy air days in 30 yrs
- 2 days/yr
Risk factors via First Street. Map © Google.
Why this score? — see what drove the D+ grade
The composite is a weighted blend of 9 inputs, each scored 0–100. Each bar is that input's sub-score; the figure is the points it added to the 100-point composite (weight × sub-score).
- Cash flow +15.0/30.0
- ARV discount +9.5/15.0
- 1% rule +5.0/10.0
- DSCR +5.0/10.0
- Rent growth +4.2/5.0
- Condition / age +4.0/5.0
- Livability +3.8/5.0
- Schools +3.0/10.0
- Appreciation +0.0/10.0
$32,500
🖨 Deal sheet 📄 Offer letter ✓ Due diligence
Listing remarks MLS
Gorgeous waterfront townhome in Pirates Cove at Lake Como, a premier master-planned community. This 2-bedroom, 1-bath property with a 2-car garage offers 1/8 fractional ownership (deeded timeshare), providing six weeks of use each year—your own piece of paradise every eight weeks. Enjoy breathtaking sunrises and sunsets, along with access to a private fishing pier and endless summer activities including boating, kayaking, and paddleboarding. The monthly maintenance fee covers Wi-Fi, water, electricity, insurance, and housekeeping for truly effortless ownership. Conveniently located within walking distance to the popular Waterman’s Restaurant, just minutes from west-end beaches, shopping, and a short drive to the Seawall. Ideal as a relaxing coastal retreat or easy getaway from the city.
Key facts
- Private fishing pier
- Waterfront townhome
- $299 HOA
Tags
Neighborhood map
What this means for you Summary
Snapshot
- This is a 2-bed/1.0-bath townhouse listed at $32k. Condition is rated good.
Deal economics
- At list price, monthly cash flow is $285 ($3k/yr) — positive.
- The deal already cash-flows at list — no discount required.
- Meets the 1% rule at list price ($2k rent vs $32k).
- Recommended offer: $31k (6.0% below list) — sets the bar for market timing.
- Cap rate 32.6% vs local median 0.1% in Galveston — top-decile yield for the area; either an underpriced asset or a hidden risk that comps aren't pricing in. Stress-test before assuming the spread holds.
Location & tenants
- Location reads 76/100 on livability (#108 in TX, #3,559 nationally) — a middle-class / working-renter tenant base. Strengths: commute A+, cost of living A+, housing A+; Watch: amenities D+, employment D, crime F.
- Galveston ISD (town): math 33% / reading 39% proficiency, ranked #514 of 826 in TX (top 62%) — families likely to look elsewhere, expect single-tenant / working-renter base with shorter leases; 68% free/reduced lunch — lower-income household profile, screen leases tightly.
- Market conditions: Rents rising fast (+6.7%/yr); 1239 active listings in the ZIP; solid renter incomes; 3,258 units permitted in Galveston County in 2024 (0 in 5+ unit buildings).
Forward outlook
- Local home prices are declining (-3.0%/yr); year-one equity from $225 of loan paydown is wiped out by about $975 of value loss. Plan a longer hold.
- Galveston County population projected at +43% by 2050 — long-run rental-demand tailwind backs the buy-and-hold thesis.
- At projected returns (-3.0% appreciation + 6.7% rent growth), your $9k cash investment doubles in ~3 years — after that, you're playing with house money.
Negotiation context
- It's been on market 66 days — a 6% lower offer ($31k) is reasonable based on typical stale-listing flexibility.
Risks & watch-outs
- Watch-outs: flood insurance adds $427/mo.
- Climate carrying-cost: in FEMA flood zone AE (mandatory federal flood insurance); severe wind risk, 99% chance of damaging wind over 30y; extreme-heat days projected 7→28/yr by 2055 (HVAC capex compounding) — expect insurance premiums to compound above CPI over the hold.
Questions for the listing agent
- It's been on market 66 days. Have you received any prior offers? Is the seller open to a 6% concession, seller financing, or rate buy-down credit?
- What's the actual annual flood-insurance premium (NFIP or private), and is the property in a SFHA with mandatory coverage?
- What does the HOA fee cover, when was the last increase, and are there any pending special assessments or reserve-fund shortfalls?
- Why hasn't it sold? Are there any deal-killer items the seller is aware of (foundation, flood, title, zoning, code violations)?
- Is there a deadline driving the sale (1031 exchange, divorce, estate, relocation)? That informs how much negotiation room exists.
- Crime grade is F in this area — have there been break-ins, vandalism, or insurance claims at this property in the last 3 years? What carrier currently insures it and at what premium?
- The area grade is low — what's the realistic commute time and amenity access for the typical tenant pool here? Any planned neighborhood developments (good or bad) we should know about?
- This sits on a lake — are riparian / water-frontage rights deeded with the parcel? Any dock permits, shoreline easements, or HOA water-use restrictions?
- What's the documented flood / surge / shoreline-erosion history here (FEMA AND non-FEMA — e.g., storm surge, creek backup, septic-field saturation)?
- Any water-quality or seasonal algae-bloom issues that affect tenant satisfaction or short-term-rental demand?
- What's the average days-on-market for RENTAL listings here right now (not sales)? A rising rental-DOM trend means longer vacancies and softer asking-rent achievability than the comps imply.
- What's the recent tenant-quality profile in this submarket — average credit score on applications, eviction rate, late-payment / NSF rate, and stable-employment percentage? A property-management company in the area should have these aggregated.
- How much new for-sale + rental construction is in the pipeline within 1–3 miles? Heavy new supply typically softens prices + rents 12–24 months out; constrained supply supports both.
Investment metrics
- 1% rule
- 4.81% ✓
- Cap rate
- 32.58%
- Cash-on-cash
- 93.89%
- DSCR
- 5.18
- GRM
- 1.7
CMA / ARV
- ARV (median comp)
- $34,020
- List price
- $32,500
- Delta
- -4.47%
- Verdict
- FAIR
- Comps
- 20 within 1.0 mi
Show comp detail 1 sale within ~0.75 mi
| Address | Dist | Beds/Ba | Sqft | Sold | Price | $/sf | Match |
|---|---|---|---|---|---|---|---|
| 11H Dana Dr | 0.03mi | 2/1.0 | 971 (0%) | 23mo | $30,000 | $31 | 80 |
Match score weights: distance 35% · size 25% · config 20% · recency 20%. Top-matched comps best support the ARV.
Projected returns pro-forma
-3.0% appreciation · 6.73% rent growth · sell at horizon
- IRR
- 43.8%
- Equity multiple
- 3.14×
- Total profit
- $19,473
- Equity at exit
- $4,846
- IRR
- 53.5%
- Equity multiple
- 8.61×
- Total profit
- $69,258
- Equity at exit
- $2,810
Cash invested: $9,100 (down + closing). Projections, not guarantees.
Landlord ↔ Tenant lean methodology
- Overall (STATE)
- 87 Strongly Landlord-Friendly
- State Texas
- 87 Strongly Landlord-Friendly · R+5
- County
- — inherits STATE
- City
- — inherits STATE
ZIP-level market 77554
- Rents YoY
- 6.7%
- Active inventory
- 1239
- Price-to-rent
- 1.7×
Monthly cashflow live
- Estimated rent
- $1,564 medium interval (Pro) →
- Mortgage (P&I)
- −$170
- Tax est. 1.5%
- −$41 /mo · $488/yr
- Insurance
- −$14
- Flood insurance flood zone
- −$427 /mo · $5,118/yr
- HOA
- −$299
- Vacancy / Maint / Mgmt
- −$328
- Net cashflow
- $285
Break-even live
UW: 25.0% down · 7.5% · 30yr · 1.5% tax · 5.0% vac · 8.0% maint · 8.0% mgmt
Financing live
Cash to close
- Down payment
- $8,125
- Closing costs
- $975
- Reserves months
- —
- Total cash needed
- —
Loan-product check · same deal, 3 products live
Conventional
25% down · 7.5% · 30yr
- Down + closing
- —
- Monthly P&I
- —
- Monthly cashflow
- —
- DSCR
- —
- Eligible?
- —
Personal DTI + credit; lowest rate.
DSCR
20% down · 8.5% · 30yr
- Down + closing
- —
- Monthly P&I
- —
- Monthly cashflow
- —
- DSCR
- —
- Eligible?
- —
No personal income docs; deal must DSCR.
Hard money
10% down · 12.0% · 12mo
- Down + closing
- —
- Monthly P&I
- —
- Monthly cashflow
- —
- DSCR
- —
- Eligible?
- —
Short-term bridge; refi at stabilization.
HOA detail
- Monthly dues
- $299 · $3,588/yr
- Likely covers
- waterelectricinternet
Listing history 15 events
-
2026-06-18days on market $32,500 Active 66 DOM
-
2026-06-17days on market $32,500 Active 65 DOM
-
2026-06-16days on market $32,500 Active 64 DOM
-
2026-06-15days on market $32,500 Active 63 DOM
-
2026-06-13days on market $32,500 Active 61 DOM
-
2026-06-09days on market $32,500 Active 57 DOM
-
2026-06-08days on market $32,500 Active 56 DOM
-
2026-06-07days on market $32,500 Active 55 DOM
-
2026-06-04days on market $32,500 Active 52 DOM
-
2026-06-03days on market $32,500 Active 51 DOM
-
2026-06-02days on market $32,500 Active 50 DOM
-
2026-06-02price $32,500 Active 49 DOM
-
2026-06-01days on market $35,000 Active 49 DOM
-
2026-05-31days on market $35,000 Active 48 DOM
-
2026-04-13$35,000 Active 812-char remark
Show marketing remark (812 chars)
Gorgeous waterfront townhome in Pirates Cove at Lake Como, a premier master-planned community. This 2-bedroom, 1-bath property with a 2-car garage offers 1/8 fractional ownership (deeded timeshare), providing six weeks of use each year—your own piece of paradise every eight weeks. Enjoy breathtaking sunrises and sunsets, along with access to a private fishing pier and endless summer activities including boating, kayaking, and paddleboarding. The monthly maintenance fee covers Wi-Fi, water, electricity, insurance, and housekeeping for truly effortless ownership. Conveniently located within walking distance to the popular Waterman’s Restaurant, just minutes from west-end beaches, shopping, and a short drive to the Seawall. Ideal as a relaxing coastal retreat or easy getaway from the city.
ⓘ Source: listings_history table (triggers on properties + properties_extension) + one-shot
backfill from property_details.listing_events for pre-trigger history.
Climate risk First Street
- Flood 10/10 Extreme FEMA zone AE · 99% chance over 30 yrs
- Wildfire 1/10 Low
- Heat 10/10 Extreme 7 d/yr ≥106°F today · 28 d/yr by 30 yrs out
- Wind 10/10 Extreme 99% chance of damaging wind over 30 yrs
- Air quality 2/10 Low 2 unhealthy d/yr today · 2 by 30 yrs out
Nearby sold comps map
Loading sold comps map…
Walkable amenities ~0.75 mi
Loading nearby amenities…
Taxation est. · year 1
- Rental income
- $18,768
- − Mortgage interest
- −$1,821
- − Property taxes
- −$488
- − Insurance
- −$5,281
- − Repairs & maintenance
- −$1,501
- − Management
- −$1,501
- − HOA
- −$3,588
- − Depreciation
- −$945
- Taxable income
- $3,643
- Est. tax owed @ 24.0%
- −$874
- After-tax cash flow
- $2,551/yr
For passive investors: Depreciation is non-cash, so a rental often shows a tax loss while cash-flowing — sheltering income. Rental losses are passive: they offset passive income freely, and up to $25,000/yr can offset ordinary (W-2) income if you actively participate and your MAGI is under $100k (phasing out to $0 by $150k); unused losses carry forward. On sale, claimed depreciation is recaptured at up to 25%, and gains may owe capital-gains tax (a 1031 exchange can defer both). Figures are a year-1 estimate at your 24.0% rate — not tax advice; consult a CPA.
Condition & rehab AI · 12 photos
This waterfront townhome in Pirates Cove at Lake Como is in good condition with minimal repairs needed. It offers a great location and access to water activities, making it an attractive investment.
Value-add opportunities
- Both Paint exterior siding — Enhances curb appeal and value
- Both Replace blinds with energy-efficient windows — Improves energy efficiency and aesthetics
- Both Update flooring in living areas — Modernizes the space and increases value
Renovation cost estimate screening
Value-add ROI direction
- Both Paint exterior siding — Enhances curb appeal and value ↑
- Both Replace blinds with energy-efficient windows — Improves energy efficiency and aesthetics ↑
- Both Update flooring in living areas — Modernizes the space and increases value ↑
ⓘ Cost ranges are severity-bucket heuristics (US national rule-of-thumb). Get contractor quotes + a written scope before underwriting a rehab budget.
Schools (NCES district)
- District
- Galveston ISD
- NCES district ID
- 4820280
- Math proficiency
- 33% ▼ -14.00%
- Reading proficiency
- 39% ▼ -4.00%
- Median HH income
- $40,162
- Composite
- 30.22/100
- National rank
- #6299
- State rank
- #514 of 826 in TX
Livability — Galveston
- Score
- 76/100
- State rank
- #108
- US rank
- #3559
Category grades
Schools grade is shown separately in the Schools card above.
Census & demographics
- Census place
- Galveston, TX
- County
- Galveston County · 357,330 people
- City population
- 55,599
- Metro
- Houston-The Woodlands-Sugar Land, TX
- Population (ZIP)
- 10,414
- Household income
- $86,490
- Rent vs Own
- Severe rent burden
- 423.0
Population outlook (Galveston County) Hauer SSP2
- Today (2025)
- 390,640 people
- By 2030
- 425,226 · +8.9%
- By 2040
- 493,765 · +26.4%
- By 2050
- 559,698 · +43.3%
- By 2075
- 719,260 · +84.1%
- By 2100
- 819,628 · +109.8%
Race, ethnicity, and origin ACS 2023
- Neighborhood character
- Predominantly White (75%)
- Race & ethnicity
- White 75% Hispanic / Latino 14% Two or more races 9% Asian 3% Black 3%
- Hispanic origin (detail)
- Mexican 10%
- Common ancestry
- Italian 4% Lithuanian 4% Slovak 3%
- Foreign-born
- 8% · Canada
- Languages at home
- 85% English-only · Spanish 8% Other Indo-European 2% French/Haitian/Cajun 1%
Political lean MEDSL · Galveston
- 2024 margin
- Strong R (+27.4) · D 35.7% · R 63.1% · Other 1.2%
- 2008→2024 swing
- -7.9pp toward R · 2008: -19.5pp · 2024: -27.4pp
- All cycles
- 2024: R+27.4 2020: R+22.6 2016: R+22.6 2012: R+26.9 2008: R+19.5
Not yet ingested
- Civics
- —
Market trends
- HPI YoY
- ▼ -145.04%
- Current HPI
- 241.704
- Rent YoY
- ▲ 6.73%
- Metro
- Houston-The Woodlands-Sugar Land, TX
- State GDP YoY
- ▲ 3.95%
- F500 in state
- 110
Industry mix (Fortune 500 HQ in TX)
| Industry | F500 HQs | Revenue |
|---|---|---|
| Energy | 16 | $1,198B |
|
||
| Technology | 5 | $198B |
|
||
| Engineering / Construction | 4 | $72B |
|
||
| Energy Services | 3 | $60B |
|
||
| Utilities | 3 | $41B |
|
||
| Healthcare | 2 | $330B |
|
||
Price history
1 event — show timeline
- 2026-04-13 Listed $35,000 HARMLS
Cash-flow waterfall
monthlySold comps — $/sqft
last 12 mo · ≤1 miLoading sold comps…