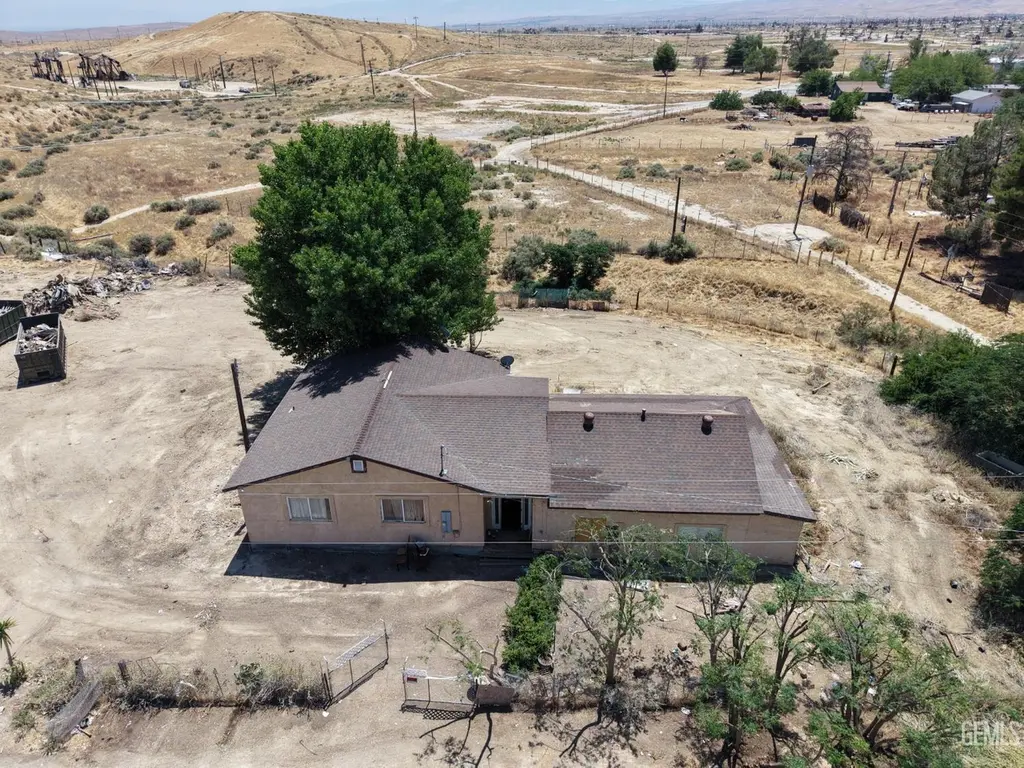
24892 4th St · Derby Acres, CA
Flood risk 1/10 · Minimal
- FEMA flood zone
- A
- Chance of flooding over 30 yrs
- 0.0%
- Est. flood insurance / yr
- $1,009 – $1,996
Fire risk 6/10 · Moderate
- Est. fire insurance / yr
- $659 – $1,223
Heat risk 8/10 · Major
- Hot days now (above 102°F)
- 6 days/yr
- Hot days in 30 yrs
- 16 days/yr
Wind risk 1/10 · Minimal
- Chance of severe wind over 30 yrs
- —
Air-quality risk 8/10 · Major
- Unhealthy air days now
- 17 days/yr
- Unhealthy air days in 30 yrs
- 21 days/yr
Risk factors via First Street. Map © Google.
Why this score? — see what drove the B- grade
The composite is a weighted blend of 9 inputs, each scored 0–100. Each bar is that input's sub-score; the figure is the points it added to the 100-point composite (weight × sub-score).
- Cash flow +26.7/30.0
- DSCR +9.1/10.0
- ARV discount +7.5/15.0
- 1% rule +6.8/10.0
- Appreciation +5.0/10.0
- Schools +4.3/10.0
- Rent growth +2.5/5.0
- Condition / age +2.5/5.0
- Livability +2.2/5.0
$150,000
🖨 Deal sheet (PDF) 📄 Offer letter ✓ Due diligence
Listing remarks MLS
Opportunity awaits! This fixer-upper sits on a spacious corner lot with over an acre of land, offering endless potential. The home does need work, but with the right vision and improvements, this property could truly shine. Plenty of room for expansion, storage, animals, RV parking, or future possibilities. Rare chance to own a large lot with so much potential at an affordable price. Bring your ideas and imagination!
Key facts
- Rv parking
- Spacious lot
- Room for expansion
Tags
Neighborhood map
What this means for you Summary
Snapshot
- This is a 5-bed/1.0-bath single-family listed at $150k.
Deal economics
- At list price, monthly cash flow is $280 ($3k/yr) — positive.
- The deal already cash-flows at list — no discount required.
- Meets the 1% rule at list price ($2k rent vs $150k).
- Recommended offer: $148k (1.5% below list) — sets the bar for market timing.
Location & tenants
- Location reads 45/100 on livability (#1,296 in CA) — a working-class tenant base; expect higher turnover. Strengths: housing A+; Watch: cost of living C-, employment D+, crime F.
- Midway Elementary (rural): math 45% / reading 50% proficiency, ranked #501 of 1,400 in CA (top 36%) — families likely to look elsewhere, expect single-tenant / working-renter base with shorter leases.
- Zoned schools: Midway Elementary (math 24% / reading 44%, grade F, #719 of 1,571 statewide, top 48%, 85 students, 55% FRL); Taft Union High (math 8% / reading 47%, grade F, #785 of 1,170 statewide, top 67%, 1,102 students, 59% FRL) — zoned schools average 57% FRL vs 39% district-wide (18 pts higher); higher-poverty schools than district average — tighter screening recommended.
- Zoned-school proficiency averages 31% at this address vs 48% district-wide (-17 pts) — the specific schools serving this property underperform the Midway Elementary average; the district grade overstates school quality for this exact location.
- Market conditions: 5 active listings in the ZIP; 3,244 units permitted in Kern County in 2024 (73 in 5+ unit buildings).
Forward outlook
- In year one you build about $6k of equity ($1k loan paydown + $4k appreciation (3.0% local appreciation)).
- Kern County population projected at +17% by 2050 — long-run rental-demand tailwind backs the buy-and-hold thesis.
- At projected returns (3.0% appreciation + 3.0% rent growth), your $42k cash investment doubles in ~5 years — after that, you're playing with house money.
- By year 7, paydown + projected appreciation supports a ~$35k cash-out refi (75% LTV) — recoverable capital for the next deal without selling this one.
Negotiation context
- It's been on market 23 days — a 2% lower offer ($148k) is reasonable based on typical stale-listing flexibility.
- Current owner paid $28k; list at $150k implies a 436% gain — meaningful room to come down on a strong offer.
Risks & watch-outs
- Watch-outs: flood insurance adds $125/mo; built in 1925 — expect roof / HVAC / electrical / plumbing capex.
- Climate carrying-cost: in FEMA flood zone A (mandatory federal flood insurance); major wildfire risk; extreme-heat days projected 6→16/yr by 2055 (HVAC capex compounding) — expect insurance premiums to compound above CPI over the hold.
Questions for the listing agent
- Built in 1925 — when were the roof, HVAC, electrical panel, plumbing, and water heater last replaced?
- What's the actual annual flood-insurance premium (NFIP or private), and is the property in a SFHA with mandatory coverage?
- Is there a deadline driving the sale (1031 exchange, divorce, estate, relocation)? That informs how much negotiation room exists.
- Schools are F-rated, which usually means shorter tenancies and higher turnover. Who's the typical renter profile here, and what's been the actual vacancy rate?
- Crime grade is F in this area — have there been break-ins, vandalism, or insurance claims at this property in the last 3 years? What carrier currently insures it and at what premium?
- What's the average days-on-market for RENTAL listings here right now (not sales)? A rising rental-DOM trend means longer vacancies and softer asking-rent achievability than the comps imply.
- What's the recent tenant-quality profile in this submarket — average credit score on applications, eviction rate, late-payment / NSF rate, and stable-employment percentage? A property-management company in the area should have these aggregated.
- How much new for-sale + rental construction is in the pipeline within 1–3 miles? Heavy new supply typically softens prices + rents 12–24 months out; constrained supply supports both.
Investment metrics
- 1% rule
- 1.18% ✓
- Cap rate
- 9.53%
- Cash-on-cash
- 11.57%
- DSCR
- 1.51
- GRM
- 7.0
CMA / ARV
No comps found within radius.
Projected returns pro-forma
3.0% appreciation · 3.0% rent growth · sell at horizon
- IRR
- 15.0%
- Equity multiple
- 1.86×
- Total profit
- $35,955
- Equity at exit
- $67,446
- IRR
- 16.7%
- Equity multiple
- 3.46×
- Total profit
- $103,176
- Equity at exit
- $103,943
Cash invested: $42,000 (down + closing). Projections, not guarantees.
Landlord ↔ Tenant lean methodology
- Overall (STATE)
- 18 Strongly Tenant-Friendly
- State California
- 18 Strongly Tenant-Friendly · D+13
- County
- — inherits STATE
- City
- — inherits STATE
ZIP-level market 93224
- Active inventory
- 5
- Price-to-rent
- 7.0×
Monthly cashflow live
- Estimated rent
- $1,775 medium interval (Pro) →
- Mortgage (P&I)
- −$787
- Tax from tax record
- −$149 /mo · $1,783/yr
- Insurance
- −$62
- Flood insurance flood zone
- −$125 /mo · $1,502/yr
- HOA
- −$0
- Vacancy / Maint / Mgmt
- −$373
- Net cashflow
- $280
Break-even live
Sensitivity live
| Price | -10% $364 | -5% $322 | +0% $280 | +5% $237 | +10% $195 |
|---|---|---|---|---|---|
| Rent | -10% $139 | -5% $209 | +0% $280 | +5% $350 | +10% $420 |
| Rate | -1.0pp $355 | -0.5pp $318 | base $280 | +0.5pp $241 | +1.0pp $201 |
UW: 25.0% down · 7.5% · 30yr · 1.5% tax · 5.0% vac · 8.0% maint · 8.0% mgmt
Financing live
Cash to close
- Down payment
- $37,500
- Closing costs
- $4,500
- Reserves months
- —
- Total cash needed
- —
Loan-product check · same deal, 3 products live
Conventional
25% down · 7.5% · 30yr
- Down + closing
- —
- Monthly P&I
- —
- Monthly cashflow
- —
- DSCR
- —
- Eligible?
- —
Personal DTI + credit; lowest rate.
DSCR
20% down · 8.5% · 30yr
- Down + closing
- —
- Monthly P&I
- —
- Monthly cashflow
- —
- DSCR
- —
- Eligible?
- —
No personal income docs; deal must DSCR.
Hard money
10% down · 12.0% · 12mo
- Down + closing
- —
- Monthly P&I
- —
- Monthly cashflow
- —
- DSCR
- —
- Eligible?
- —
Short-term bridge; refi at stabilization.
Listing history 18 events
-
2026-06-21days on market $150,000 Active 23 DOM
-
2026-06-18days on market $150,000 Active 20 DOM
-
2026-06-17days on market $150,000 Active 19 DOM
-
2026-06-16days on market $150,000 Active 18 DOM
-
2026-06-15days on market $150,000 Active 17 DOM
-
2026-06-14days on market $150,000 Active 15 DOM
-
2026-06-13days on market $150,000 Active 14 DOM
-
2026-06-10days on market $150,000 Active 12 DOM
-
2026-06-09days on market $150,000 Active 11 DOM
-
2026-06-08days on market $150,000 Active 10 DOM
-
2026-06-07days on market $150,000 Active 9 DOM
-
2026-06-05days on market $150,000 Active 6 DOM
-
2026-06-03days on market $150,000 Active 5 DOM
-
2026-06-03days on market $150,000 Active 4 DOM
-
2026-06-01days on market $150,000 Active 3 DOM
-
2026-05-31days on market $150,000 Active 2 DOM
-
2026-05-29$150,000 Active 420-char remark
Show marketing remark (420 chars)
Opportunity awaits! This fixer-upper sits on a spacious corner lot with over an acre of land, offering endless potential. The home does need work, but with the right vision and improvements, this property could truly shine. Plenty of room for expansion, storage, animals, RV parking, or future possibilities. Rare chance to own a large lot with so much potential at an affordable price. Bring your ideas and imagination!
-
1991-03-04soldstatus $28,000
ⓘ Source: listings_history table (triggers on properties + properties_extension) + one-shot
backfill from property_details.listing_events for pre-trigger history.
Tax reassessment forecast CA · Resets to sale price
- Current annual tax
- $1,783 · $149/mo
- Projected year-2 tax
- $1,783 · $149/mo
- Expected delta
- $0/yr ($0/mo · 0.0%)
ⓘ Screening estimate from a state-policy table — verify with the county assessor before closing.
Climate risk First Street
- Flood 1/10 Low FEMA zone A · 0% chance over 30 yrs
- Wildfire 6/10 Major
- Heat 8/10 Severe 6 d/yr ≥102°F today · 16 d/yr by 30 yrs out
- Wind 1/10 Low
- Air quality 8/10 Severe 17 unhealthy d/yr today · 21 by 30 yrs out
Nearby sold comps map
Loading sold comps map…
Walkable amenities ~0.75 mi
Loading nearby amenities…
Taxation est. · year 1
- Rental income
- $21,303
- − Mortgage interest
- −$8,402
- − Property taxes
- −$1,783
- − Insurance
- −$2,252
- − Repairs & maintenance
- −$1,704
- − Management
- −$1,704
- − Depreciation
- −$4,364
- Taxable income
- $1,093
- Est. tax owed @ 24.0%
- −$262
- After-tax cash flow
- $3,092/yr
For passive investors: Depreciation is non-cash, so a rental often shows a tax loss while cash-flowing — sheltering income. Rental losses are passive: they offset passive income freely, and up to $25,000/yr can offset ordinary (W-2) income if you actively participate and your MAGI is under $100k (phasing out to $0 by $150k); unused losses carry forward. On sale, claimed depreciation is recaptured at up to 25%, and gains may owe capital-gains tax (a 1031 exchange can defer both). Figures are a year-1 estimate at your 24.0% rate — not tax advice; consult a CPA.
Schools (NCES district)
- District
- Midway Elementary
- NCES district ID
- 0624780
- Math proficiency
- 45% ▼ -5.00%
- Reading proficiency
- 50% ▬ 0.00%
- Median HH income
- $51,112
- Composite
- 42.93/100
- National rank
- #6695
- State rank
- #501 of 1400 in CA
Livability — Derby Acres
- Score
- 45/100
- State rank
- #1296
- US rank
- #26581
Category grades
Schools grade is shown separately in the Schools card above.
Census & demographics
- Census place
- Derby Acres, CA
- Population (ZIP)
- 430
Population outlook (Kern County) Hauer SSP2
- Today (2025)
- 947,286 people
- By 2030
- 978,984 · +3.3%
- By 2040
- 1,045,018 · +10.3%
- By 2050
- 1,105,232 · +16.7%
- By 2075
- 1,229,538 · +29.8%
- By 2100
- 1,238,059 · +30.7%
Race, ethnicity, and origin ACS 2023
- Neighborhood character
- Predominantly White (76%)
- Race & ethnicity
- White 76% Hispanic / Latino 18% Two or more races 9%
- Hispanic origin (detail)
- Mexican 8%
- Common ancestry
- Iranian 2% Slovak 1%
- Foreign-born
- 12% · Canada, Jamaica
- Languages at home
- 86% English-only · Spanish 14%
Political lean MEDSL · Kern
- 2024 margin
- Strong R (+21.1) · D 38.2% · R 59.3% · Other 2.5%
- 2008→2024 swing
- -3.3pp toward R · 2008: -17.8pp · 2024: -21.1pp
- All cycles
- 2024: R+21.1 2020: R+10.2 2016: R+15.0 2012: R+20.9 2008: R+17.8
Not yet ingested
- Civics
- —
Market trends
- HPI YoY
- —
- Current HPI
- —
- Rent YoY
- —
- Metro
- —
- State GDP YoY
- ▲ 3.21%
- F500 in state
- 116
Industry mix (Fortune 500 HQ in CA)
| Industry | F500 HQs | Revenue |
|---|---|---|
| Technology | 27 | $1,492B |
|
||
| Financial Services | 3 | $174B |
|
||
| Retail | 3 | $44B |
|
||
| Insurance | 3 | $26B |
|
||
| Media / Entertainment | 2 | $115B |
|
||
| Pharmaceuticals / Biotech | 2 | $62B |
|
||
Price history
+435.7% since first listed2 events — show timeline
- 2026-05-29 Listed $150,000 GEMLS
- 1991-03-04 Sold (Public Records) $28,000 Public Records
Property tax history
+7.4%/yrLatest (2025): $1,783 · +2.4% YoY. Source: county tax records.
Cash-flow waterfall
monthlySold comps — $/sqft
last 12 mo · ≤1 miLoading sold comps…