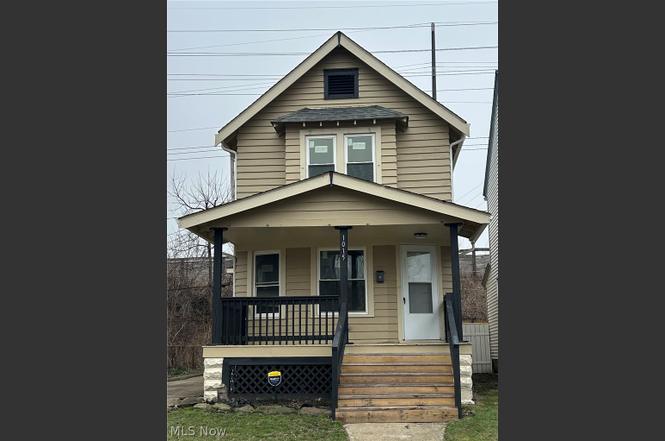
1015 E 131st St · East Cleveland, OH
Flood risk 3/10 · Minor
- FEMA flood zone
- X (unshaded)
- Chance of flooding over 30 yrs
- 0.2%
- Est. flood insurance / yr
- $473 – $860
Fire risk 1/10 · Minimal
- Est. fire insurance / yr
- $713 – $1,323
Heat risk 3/10 · Minor
- Hot days now (above 95°F)
- 7 days/yr
- Hot days in 30 yrs
- 17 days/yr
Wind risk 1/10 · Minimal
- Chance of severe wind over 30 yrs
- —
Air-quality risk 3/10 · Minor
- Unhealthy air days now
- 3 days/yr
- Unhealthy air days in 30 yrs
- 5 days/yr
Risk factors via First Street. Map © Google.
Why this score? — see what drove the B- grade
The composite is a weighted blend of 9 inputs, each scored 0–100. Each bar is that input's sub-score; the figure is the points it added to the 100-point composite (weight × sub-score).
- Cash flow +30.0/30.0
- DSCR +10.0/10.0
- 1% rule +8.4/10.0
- ARV discount +7.5/15.0
- Rent growth +3.7/5.0
- Livability +3.3/5.0
- Condition / age +2.5/5.0
- Schools +0.7/10.0
- Appreciation +0.0/10.0
$100,000
🖨 Deal sheet 📄 Offer letter ✓ Due diligence
Listing remarks
Welcome to this updated 3-bedroom, 1-bath single-family home offering a long list of recent improvements. Updates include NEW whole-house wiring and electrical service, newer windows (most replaced), fresh interior and exterior paint, NEW flooring throughout (carpet/vinyl), NEW furnace and hot water tank, updated ductwork, plumbing, lighting, updated bathroom, kitchen cabinets and sink, utility sink, interior and exterior doors, gutters, and new front and back staircases. The spacious layout features a large living room and formal dining room filled with natural light and an updated color scheme. Perfect for owner-occupancy or investors for low maintenance and quick cash flow. Conveniently
Key facts
- New furnace
- New wiring
- Newer windows
Tags
Neighborhood map
What this means for you Summary
Snapshot
- This is a 3-bed/1.0-bath single-family listed at $100k.
Deal economics
- At list price, monthly cash flow is $447 ($5k/yr) — positive.
- The deal already cash-flows at list — no discount required.
- Meets the 1% rule at list price ($1k rent vs $100k).
- Recommended offer: $94k (6.0% below list) — sets the bar for market timing.
- Cap rate 11.7% vs local median 17.4% in East Cleveland — below-typical yield; the buyer is paying a premium for something (appreciation thesis, condition, location) that the cap rate doesn't capture.
Location & tenants
- Location reads 66/100 on livability (#650 in OH) — a middle-class / working-renter tenant base. Strengths: commute A+, cost of living A+, health & safety A+; Watch: schools F, crime F, employment F.
- East Cleveland City School District (suburban): math 4% / reading 17% proficiency, ranked #652 of 656 in OH (top 99%) — low school quality limits family demand, transient renter base, plan for 1-2y turnover; 92% free/reduced lunch — lower-income household profile, screen leases tightly.
- Market conditions: Rents rising fast (+4.9%/yr); 1 active listings in the ZIP; 40 comparable units currently listed for rent nearby; rentals at typical pace (median 24d on market — plan ~3-4 weeks tenant-placement turnaround); lower-income renter base — watch delinquency; 1,441 units permitted in Cuyahoga County in 2024 (700 in 5+ unit buildings).
- At $1,338/mo this rent would consume 46% of the median local household income ($35k/yr) (locally 1428% of renters already pay >50% of income on rent) — very limited rent-growth headroom before tenants either downsize or default.
Forward outlook
- Local home prices are declining (-3.0%/yr); year-one equity from $691 of loan paydown is wiped out by about $3k of value loss. Plan a longer hold.
- Cuyahoga County population projected to shrink 8% by 2050 — rents likely to lag national; underwrite the cash flow, not the appreciation.
- At projected returns (-3.0% appreciation + 4.9% rent growth), your $28k cash investment doubles in ~6 years — after that, you're playing with house money.
Negotiation context
- It's been on market 80 days — a 6% lower offer ($94k) is reasonable based on typical stale-listing flexibility.
- 4 sale attempts since 22y ago with the ask held roughly flat each time — persistent listings suggest the price (not the market) is what's stuck; bring a comps-based counter.
- Current owner paid $86k; 16% above their basis — modest negotiation headroom, anchor on the comps not their cost.
Risks & watch-outs
- Watch-outs: built in 1920 — expect roof / HVAC / electrical / plumbing capex.
Questions for the listing agent
- It's been on market 80 days. Have you received any prior offers? Is the seller open to a 6% concession, seller financing, or rate buy-down credit?
- Built in 1920 — when were the roof, HVAC, electrical panel, plumbing, and water heater last replaced?
- Why hasn't it sold? Are there any deal-killer items the seller is aware of (foundation, flood, title, zoning, code violations)?
- Is there a deadline driving the sale (1031 exchange, divorce, estate, relocation)? That informs how much negotiation room exists.
- Schools are F-rated, which usually means shorter tenancies and higher turnover. Who's the typical renter profile here, and what's been the actual vacancy rate?
- Crime grade is F in this area — have there been break-ins, vandalism, or insurance claims at this property in the last 3 years? What carrier currently insures it and at what premium?
- What's the average days-on-market for RENTAL listings here right now (not sales)? A rising rental-DOM trend means longer vacancies and softer asking-rent achievability than the comps imply.
- What's the recent tenant-quality profile in this submarket — average credit score on applications, eviction rate, late-payment / NSF rate, and stable-employment percentage? A property-management company in the area should have these aggregated.
- How much new for-sale + rental construction is in the pipeline within 1–3 miles? Heavy new supply typically softens prices + rents 12–24 months out; constrained supply supports both.
Investment metrics
- 1% rule
- 1.34% ✓
- Cap rate
- 11.66%
- Cash-on-cash
- 19.17%
- DSCR
- 1.85
- GRM
- 6.2
CMA / ARV
- ARV (on-the-fly)
- $40,120
- Comps found
- 6
Show comp detail 6 sales within ~0.75 mi
| Address | Dist | Beds/Ba | Sqft | Sold | Price | $/sf | Match |
|---|---|---|---|---|---|---|---|
| 1524 E 133rd St | 0.48mi | 3/1.0 | 1,232 (+4%) | 6mo | $30,000 | $24 | 66 |
| 13412 5th Ave | 0.27mi | 3/1.0 | 1,251 (+6%) | 18mo | $86,000 | $69 | 62 |
| 13500 Claiborne Rd | 0.44mi | 3/1.0 | 1,297 (+10%) | 5mo | $44,500 | $34 | 59 |
| 14312 Scioto Ave | 0.58mi | 3/1.0 | 1,090 (-8%) | 2mo | $23,500 | $22 | 59 |
| 14205 Savannah Ave | 0.65mi | 3/1.5 | 1,160 (-2%) | 17mo | $40,000 | $34 | 51 |
| 14200 Scioto Ave | 0.53mi | 3/1.0 | 1,256 (+6%) | 17mo | $48,500 | $39 | 51 |
Match score weights: distance 35% · size 25% · config 20% · recency 20%. Top-matched comps best support the ARV.
Projected returns pro-forma
-3.0% appreciation · 4.92% rent growth · sell at horizon
- IRR
- 13.1%
- Equity multiple
- 1.53×
- Total profit
- $14,886
- Equity at exit
- $14,910
- IRR
- 23.3%
- Equity multiple
- 3.17×
- Total profit
- $60,763
- Equity at exit
- $8,646
Cash invested: $28,000 (down + closing). Projections, not guarantees.
Landlord ↔ Tenant lean methodology
- Overall (STATE)
- 73 Landlord-Friendly
- State Ohio
- 73 Landlord-Friendly · R+6
- County
- — inherits STATE
- City
- — inherits STATE
ZIP-level market 44108
- Home prices YoY
- -19.0%
- Rents YoY
- 4.9%
- Active inventory
- 1
- Price-to-rent
- 6.2×
Monthly cashflow live
- Estimated rent
- $1,338 high interval (Pro) →
- Mortgage (P&I)
- −$524
- Tax from tax record
- −$44 /mo · $525/yr
- Insurance
- −$42
- HOA
- −$0
- Vacancy / Maint / Mgmt
- −$281
- Net cashflow
- $447
Break-even live
UW: 25.0% down · 7.5% · 30yr · 1.5% tax · 5.0% vac · 8.0% maint · 8.0% mgmt
Financing live
Cash to close
- Down payment
- $25,000
- Closing costs
- $3,000
- Reserves months
- —
- Total cash needed
- —
Loan-product check · same deal, 3 products live
Conventional
25% down · 7.5% · 30yr
- Down + closing
- —
- Monthly P&I
- —
- Monthly cashflow
- —
- DSCR
- —
- Eligible?
- —
Personal DTI + credit; lowest rate.
DSCR
20% down · 8.5% · 30yr
- Down + closing
- —
- Monthly P&I
- —
- Monthly cashflow
- —
- DSCR
- —
- Eligible?
- —
No personal income docs; deal must DSCR.
Hard money
10% down · 12.0% · 12mo
- Down + closing
- —
- Monthly P&I
- —
- Monthly cashflow
- —
- DSCR
- —
- Eligible?
- —
Short-term bridge; refi at stabilization.
Rent comps 40 comps
| Address | Beds | Baths | Sqft | Rent | $/sqft | DOM | Units | Dist |
|---|---|---|---|---|---|---|---|---|
| 12819 Edmonton Ave Cleveland, OH | 4.0 | 1.0 | 1423 | $1,795 | $1.26 | 16d | 1 | 0.40mi |
| 14009 Mayfair Ave Unit 1 East Cleveland, OH | 2.0 | 1.0 | 764 | $1,200 | $1.57 | 43d | 1 | 0.50mi |
| 14009 Mayfair Ave Unit 2 East Cleveland, OH | 4.0 | 2.0 | 1144 | $1,390 | $1.22 | 43d | 1 | 0.50mi |
| 14005 Scioto Ave Cleveland, OH | 3.0 | 1.0 | 1056 | $1,570 | $1.49 | 16d | 1 | 0.53mi |
| 14120 Superior Ave Unit 1 East Cleveland, OH | 3.0 | 1.0 | 1400 | $1,350 | $0.96 | 10d | 1 | 0.53mi |
| 14120 Superior Ave Unit 4 East Cleveland, OH | 3.0 | 1.0 | 1408 | $1,350 | $0.96 | 43d | 1 | 0.53mi |
| 13420 Euclid Ave Unit 1817-307 East Cleveland, OH | 2.0 | 1.0 | 800 | $850 | $1.06 | 23d | 1 | 0.54mi |
| 13420 Euclid Ave Unit 13444-214 East Cleveland, OH | 2.0 | 1.0 | 800 | $850 | $1.06 | 43d | 1 | 0.54mi |
| 14200 Scioto Ave Cleveland, OH | 3.0 | 1.0 | 1256 | $1,350 | $1.07 | 16d | 1 | 0.55mi |
| 13900 Potomac Ave Cleveland, OH | 3.0 | 1.0 | 1172 | $1,355 | $1.16 | 23d | 1 | 0.55mi |
| 13540 Superior Rd Cleveland, OH | 1.0–2.0 | 1.0 | 655 | $850 | $1.30 | 16d | 2 | 0.56mi |
| 13605 Terrace Rd Unit RD-5 East Cleveland, OH | 2.0 | 1.0 | 700 | $850 | $1.21 | 43d | 1 | 0.60mi |
| 14312 Scioto Ave Cleveland, OH | 3.0 | 1.0 | 1090 | $1,300 | $1.19 | 4d | 1 | 0.60mi |
| 1459 E 134th St Unit up East Cleveland, OH | 2.0 | 1.0 | 1150 | $850 | $0.74 | 10d | 1 | 0.62mi |
| 14205 Savannah Ave Cleveland, OH | 3.0 | 1.0 | 1160 | $1,350 | $1.16 | 16d | 1 | 0.67mi |
| 1338 Lakeview Rd Unit Down Cleveland, OH | 3.0 | 1.0 | 1000 | $1,900 | $1.90 | 23d | 1 | 0.72mi |
| 14835 Euclid Ave Cleveland, OH | 1.0–2.0 | 1.0 | 712 | $850 | $1.19 | 43d | 12 | 0.78mi |
| 1464 E 123rd St Cleveland, OH | 3.0 | 1.0 | 1041 | $1,800 | $1.73 | 23d | 1 | 0.92mi |
| 12511 Euclid Ave Cleveland, OH | 2.0 | 2.5 | 1300 | $1,400 | $1.08 | 43d | 1 | 0.94mi |
| 1801 Stanwood Rd Unit 13 East Cleveland, OH | 2.0 | 1.0 | 800 | $900 | $1.12 | 43d | 1 | 0.94mi |
| 15421 Plymouth Pl East Cleveland, OH | 2.0 | 1.0 | 950 | $972 | $1.02 | 43d | 1 | 1.10mi |
| 1545 Glenmont Rd Unit 1 East Cleveland, OH | 2.0 | 1.0 | 1428 | $800 | $0.56 | 23d | 1 | 1.12mi |
| 1555 E 118th St Cleveland, OH | 2.0 | 1.0 | 712 | $1,900 | $2.67 | 23d | 2 | 1.13mi |
| 1726 Taylor Rd East Cleveland, OH | 2.0 | 1.0 | 900 | $972 | $1.08 | 43d | 1 | 1.14mi |
| 14813 Alder Ave Cleveland, OH | 3.0 | 1.0 | 1188 | $1,150 | $0.97 | 23d | 1 | 1.17mi |
| 14120 Superior Rd Cleveland, OH | 3.0 | 1.0 | 1390 | $1,400 | $1.01 | 43d | 1 | 1.20mi |
| 1867 N Taylor Rd Apt 309 Cleveland, OH | 2.0 | 1.0 | 850 | $700 | $0.82 | 43d | 1 | 1.25mi |
| 1635 Belmar Rd Unit 1 Cleveland Heights, OH | 2.0 | 1.0 | 900 | $1,200 | $1.33 | 23d | 1 | 1.28mi |
| 1862 E 123rd St Cleveland, OH | 2.0 | 1.0–2.0 | 1107 | $2,999 | $2.71 | 1d | 17 | 1.29mi |
| 1605 Hillcrest Rd Cleveland, OH | 2.0 | 1.0 | 1180 | $1,245 | $1.06 | 16d | 1 | 1.31mi |
| 14172 Superior Rd Unit 1 Cleveland Heights, OH | 3.0 | 1.0 | 1446 | $1,295 | $0.90 | 23d | 1 | 1.34mi |
| 14172 Superior Rd Unit 2 Cleveland Heights, OH | 2.0 | 1.0 | 1446 | $1,195 | $0.83 | 23d | 1 | 1.34mi |
| 1695 Glenmont Rd Unit Lower Cleveland Heights, OH | 3.0 | 1.0 | 1336 | $1,435 | $1.07 | 23d | 1 | 1.34mi |
| 1695 Glenmont Rd Unit 1695 Glenmont Lower Cleveland Heights, OH | 3.0 | 1.0 | 1336 | $1,435 | $1.07 | 7d | 1 | 1.34mi |
| 1643 Hillcrest Rd Unit 3 Cleveland Heights, OH | 2.0 | 1.0 | 756 | $775 | $1.03 | 16d | 1 | 1.36mi |
| 2845 Mayfield Rd Unit 2849-3 Cleveland Heights, OH | 2.0 | 1.0 | 1000 | $1,100 | $1.10 | 23d | 1 | 1.39mi |
| 1771 Coventry Rd Cleveland Heights, OH | 2.0 | 1.0 | 925 | $1,250 | $1.35 | 21d | 1 | 1.44mi |
| 2878 Mayfield Rd Cleveland Heights, OH | 1.0–2.0 | 1.0 | 1060 | $1,275 | $1.20 | 23d | 1 | 1.44mi |
| 2676 Mayfield Rd Cleveland, OH | 2.0 | 1.0 | 914 | $1,250 | $1.37 | 20d | 2 | 1.45mi |
| 2672 Mayfield Rd Cleveland, OH | 2.0 | 1.0 | 975 | $1,425 | $1.46 | 23d | 1 | 1.45mi |
Listing history 10 events
-
2026-04-28status Pending
-
2026-03-24status Active
-
2026-03-20price $100,000
-
2026-02-28price $98,500
-
2026-02-03$98,000 Active
-
2023-11-28historical
-
2023-11-10$49,900 Active
-
2005-01-02historical
-
2004-12-27soldstatus $86,000
-
2004-07-01$29,999
ⓘ Source: listings_history table (triggers on properties + properties_extension) + one-shot
backfill from property_details.listing_events for pre-trigger history.
Tax reassessment forecast OH · Partial reset (capped growth)
- Current annual tax
- $525 · $44/mo
- Projected year-2 tax
- $1,042 · $87/mo
- Expected delta
- +$518/yr (+$43/mo · 98.6%)
ⓘ Screening estimate from a state-policy table — verify with the county assessor before closing.
Climate risk First Street
- Flood 3/10 Moderate FEMA zone X (unshaded) · 20% chance over 30 yrs
- Wildfire 1/10 Low
- Heat 3/10 Moderate 7 d/yr ≥95°F today · 17 d/yr by 30 yrs out
- Wind 1/10 Low
- Air quality 3/10 Moderate 3 unhealthy d/yr today · 5 by 30 yrs out
Nearby sold comps map
Loading sold comps map…
Walkable amenities ~0.75 mi
Loading nearby amenities…
Taxation est. · year 1
- Rental income
- $16,057
- − Mortgage interest
- −$5,602
- − Property taxes
- −$525
- − Insurance
- −$500
- − Repairs & maintenance
- −$1,285
- − Management
- −$1,285
- − Depreciation
- −$2,909
- Taxable income
- $3,952
- Est. tax owed @ 24.0%
- −$948
- After-tax cash flow
- $4,418/yr
For passive investors: Depreciation is non-cash, so a rental often shows a tax loss while cash-flowing — sheltering income. Rental losses are passive: they offset passive income freely, and up to $25,000/yr can offset ordinary (W-2) income if you actively participate and your MAGI is under $100k (phasing out to $0 by $150k); unused losses carry forward. On sale, claimed depreciation is recaptured at up to 25%, and gains may owe capital-gains tax (a 1031 exchange can defer both). Figures are a year-1 estimate at your 24.0% rate — not tax advice; consult a CPA.
Schools (NCES district)
- District
- East Cleveland City School District
- NCES district ID
- 3904390
- Math proficiency
- 4% ▼ -16.00%
- Reading proficiency
- 17% ▼ -13.00%
- Median HH income
- $22,726
- Composite
- 7.38/100
- National rank
- #9954
- State rank
- #652 of 656 in OH
Livability — East Cleveland
- Score
- 66/100
- State rank
- #650
- US rank
- #11510
Category grades
Schools grade is shown separately in the Schools card above.
Census & demographics
- Census place
- East Cleveland, OH
- County
- Cuyahoga County · 1,090,369 people
- City population
- 17,848
- Metro
- Cleveland-Elyria, OH
- Population (ZIP)
- 19,381
- Household income
- $34,745
- Rent vs Own
- Severe rent burden
- 1428.0
Population outlook (Cuyahoga County) Hauer SSP2
- Today (2025)
- 1,244,621 people
- By 2030
- 1,230,093 · -1.2%
- By 2040
- 1,189,108 · -4.5%
- By 2050
- 1,145,706 · -7.9%
- By 2075
- 1,076,557 · -13.5%
- By 2100
- 978,987 · -21.3%
Race, ethnicity, and origin ACS 2023
- Neighborhood character
- Predominantly Black (88%)
- Race & ethnicity
- Black 88% White 6% Two or more races 4% Hispanic / Latino 1%
- Foreign-born
- 1% · Canada
- Languages at home
- 98% English-only · Spanish 1%
Political lean MEDSL · Cuyahoga
- 2024 margin
- Solid D (+31.5) · D 65.4% · R 33.9%
- 2008→2024 swing
- -7.4pp toward R · 2008: 38.9pp · 2024: 31.5pp
- All cycles
- 2024: D+31.5 2020: D+34.1 2016: D+35.0 2012: D+38.7 2008: D+38.9
Not yet ingested
- Civics
- —
Market trends
- HPI YoY
- ▼ -38.95%
- Current HPI
- 166.4869
- Rent YoY
- ▲ 4.92%
- Metro
- Cleveland-Elyria, OH
- State GDP YoY
- ▲ 1.98%
- F500 in state
- 48
Industry mix (Fortune 500 HQ in OH)
| Industry | F500 HQs | Revenue |
|---|---|---|
| Insurance | 3 | $145B |
|
||
| Industrial Machinery | 3 | $49B |
|
||
| Financial Services | 3 | $24B |
|
||
| Consumer Goods | 2 | $93B |
|
||
| Aerospace / Defense | 2 | $47B |
|
||
| Utilities | 2 | $33B |
|
||
Price history
+233.3% since first listed10 events — show timeline
- 2026-04-28 Pending — MLSNOW
- 2026-03-24 Relisted — MLSNOW
- 2026-03-20 Price Changed $100,000 MLSNOW
- 2026-02-28 Price Changed $98,500 MLSNOW
- 2026-02-03 Listed $98,000 MLSNOW
- 2023-11-28 Listing Removed — MLSNOW
- 2023-11-10 Listed $49,900 MLSNOW
- 2005-01-02 Listing Removed — MLSNOW
- 2004-12-27 Sold (Public Records) $86,000 Public Records
- 2004-07-01 Listed $29,999 MLSNOW
Property tax history
-6.0%/yrLatest (2025): $525 · +0.0% YoY. Source: county tax records.
Cash-flow waterfall
monthlySold comps — $/sqft
last 12 mo · ≤1 miLoading sold comps…