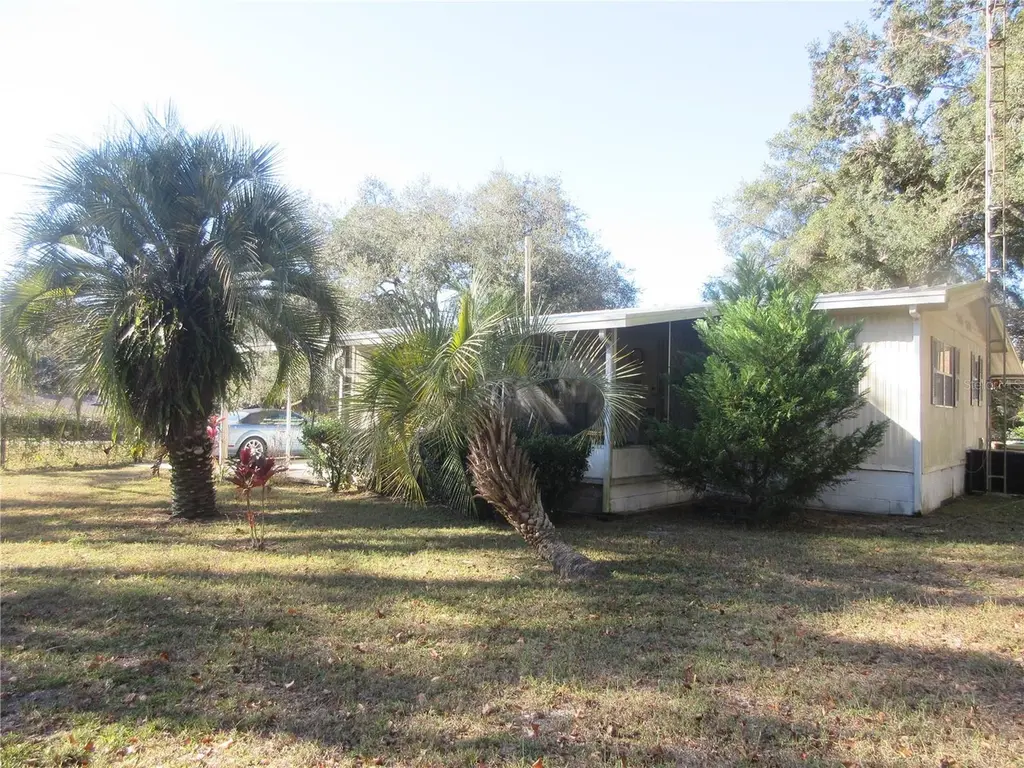
5888 SE 164th Ave · Silver Springs Shores East, FL
Flood risk 1/10 · Minimal
- FEMA flood zone
- X (unshaded)
- Chance of flooding over 30 yrs
- 0.0%
- Est. flood insurance / yr
- $507 – $1,088
Fire risk 7/10 · Major
- Est. fire insurance / yr
- $947 – $1,759
Heat risk 8/10 · Major
- Hot days now (above 109°F)
- 7 days/yr
- Hot days in 30 yrs
- 21 days/yr
Wind risk 9/10 · Severe
- Chance of severe wind over 30 yrs
- 99.0%
Air-quality risk 3/10 · Minor
- Unhealthy air days now
- 3 days/yr
- Unhealthy air days in 30 yrs
- 4 days/yr
Risk factors via First Street. Map © Google.
Why this score? — see what drove the B- grade
The composite is a weighted blend of 9 inputs, each scored 0–100. Each bar is that input's sub-score; the figure is the points it added to the 100-point composite (weight × sub-score).
- Cash flow +30.0/30.0
- DSCR +10.0/10.0
- ARV discount +7.5/15.0
- 1% rule +7.3/10.0
- Schools +3.6/10.0
- Rent growth +2.5/5.0
- Livability +2.5/5.0
- Condition / age +2.5/5.0
- Appreciation +0.0/10.0
$134,900
🖨 Deal sheet 📄 Offer letter ✓ Due diligence
Listing remarks MLS
Recently remodeled Lake Access Doublewide Mobile home with garage on a . 44 of an acre paved road property! Featuring a well kept 1973 3/1 958 sq ft Doublewide Mobile home. The entire home sits on a footer and concrete block foundation. The roof is a 2005 built up roof with 25 year siliconed roof screws. The central A/C Heat pump and trunk lines are approximately a 2021 model. The unattahced one car garage has both 120 & 240 volt electric with a separate built in removeable utility room partition. Attached is a 3x6 shed and a 6x9 shed. All trees were recently trimmed in 2024. Also included is an 8x10 2023 shed with a second washer and dryer hook up. On the front of the home is a breezy 10x18 sunrise screened room and on the back is a second 10x20 sunset screen room. The well pump and tank was replaced in 2023 and the drain field replaced in 2014 (pumped in 2023). The 3rd bedroom serves as a laundry room/bedroom combination. The following items were replaced in 2017: Bathroom with fiberglass tub, sheet rock interior walls through out, 25 solid wood kitchen cabinets with island work station, electrical , an attractive recessed ceiling in living room for the 2017 ceiling fan, interior paint, light fixtures, water heater, laminate, vinyl, tile & carpet flooring, high rise commode, gutter and bath storage cabinet. Also included is a 2023 Glass Top Range , 2023 over/under washer dryer. Also installed was new plumbing in 2025. The property fronts on two different quiet paved roads and has community lake access to a chain of lakes on 45 acre Lake Placid (see plat maps attached). The affordable average electric bill runs $120 to $133 per month. The local Moose Lodge is just 5 minutes away and is accepting new members. This is a developed property in a lovely neighborhood just 10 minutes from the Winn Dixie Shopping Center and more. An absolute great buy at just $134,900. Home is located in the Ocala National Forest which affords you almost a ½ million acres of Forest to roam, 600 lakes, 2 rivers, Juniper Springs, Silver Glen Springs, Salt Springs, Swimming, Skiing, Big BASS Fishing, Boating, Camping, Hiking, Horse back riding and some of the best ATV riding anywhere. Daytona Beach is just 1 hour away. Let the fun begin! You need it!
Key facts
- Paved road property
- Lake access
- Built up roof
Tags
Neighborhood map
What this means for you Summary
Snapshot
- This is a 3-bed/1.0-bath manufactured listed at $135k.
Deal economics
- At list price, monthly cash flow is $503 ($6k/yr) — positive.
- The deal already cash-flows at list — no discount required.
- Meets the 1% rule at list price ($2k rent vs $135k).
- Recommended offer: $119k (12.0% below list) — sets the bar for market timing.
- Cap rate 10.8% vs local median 5.2% in Silver Springs Shores East — top-decile yield for the area; either an underpriced asset or a hidden risk that comps aren't pricing in. Stress-test before assuming the spread holds.
Location & tenants
- Location reads: area grade B — affects rentability + tenant quality, not the cash-flow math above.
- Marion (rural): math 42% / reading 43% proficiency, ranked #61 of 73 in FL (top 84%) — families likely to look elsewhere, expect single-tenant / working-renter base with shorter leases; 61% free/reduced lunch — lower-income household profile, screen leases tightly.
- Market conditions: 426 active listings in the ZIP; 7,071 units permitted in Marion County in 2024 (534 in 5+ unit buildings).
- This rent runs 43% of the median local income ($47k/yr) — at the standard rent-burdened threshold; future hikes will face affordability resistance.
Forward outlook
- Local home prices are declining (-3.0%/yr); year-one equity from $933 of loan paydown is wiped out by about $4k of value loss. Plan a longer hold.
- Marion County population projected at +13% by 2050 — modest demand growth; plan on rents tracking national, not racing it.
- At projected returns (-3.0% appreciation + 3.0% rent growth), your $38k cash investment doubles in ~8 years — after that, you're playing with house money.
Negotiation context
- It's been on market 170 days — a 12% lower offer ($119k) is reasonable based on typical stale-listing flexibility.
- 7 sale attempts since 22y ago with the ask held roughly flat each time — persistent listings suggest the price (not the market) is what's stuck; bring a comps-based counter.
Risks & watch-outs
- Climate carrying-cost: severe wind risk, 99% chance of damaging wind over 30y; major wildfire risk; extreme-heat days projected 7→21/yr by 2055 (HVAC capex compounding) — expect insurance premiums to compound above CPI over the hold.
Questions for the listing agent
- It's been on market 170 days. Have you received any prior offers? Is the seller open to a 12% concession, seller financing, or rate buy-down credit?
- Built in 1973 — when were the roof, HVAC, electrical panel, plumbing, and water heater last replaced?
- Why hasn't it sold? Are there any deal-killer items the seller is aware of (foundation, flood, title, zoning, code violations)?
- Is there a deadline driving the sale (1031 exchange, divorce, estate, relocation)? That informs how much negotiation room exists.
- What's the average days-on-market for RENTAL listings here right now (not sales)? A rising rental-DOM trend means longer vacancies and softer asking-rent achievability than the comps imply.
- What's the recent tenant-quality profile in this submarket — average credit score on applications, eviction rate, late-payment / NSF rate, and stable-employment percentage? A property-management company in the area should have these aggregated.
- How much new for-sale + rental construction is in the pipeline within 1–3 miles? Heavy new supply typically softens prices + rents 12–24 months out; constrained supply supports both.
Investment metrics
- 1% rule
- 1.23% ✓
- Cap rate
- 10.76%
- Cash-on-cash
- 15.97%
- DSCR
- 1.71
- GRM
- 6.8
CMA / ARV
- ARV (median comp)
- $53,450
- List price
- $134,900
- Delta
- 152.39%
- Verdict
- OVERPRICED
- Comps
- 4 within 2.0 mi
Show comp detail 1 sale within ~0.75 mi
| Address | Dist | Beds/Ba | Sqft | Sold | Price | $/sf | Match |
|---|---|---|---|---|---|---|---|
| 6335 SE 159th Ct | 0.44mi | 2/2.0 (-1) | 840 (-9%) | 4mo | $50,000 | $60 | 52 |
Match score weights: distance 35% · size 25% · config 20% · recency 20%. Top-matched comps best support the ARV.
Projected returns pro-forma
-3.0% appreciation · 3.0% rent growth · sell at horizon
- IRR
- 6.9%
- Equity multiple
- 1.27×
- Total profit
- $10,106
- Equity at exit
- $20,114
- IRR
- 16.2%
- Equity multiple
- 2.32×
- Total profit
- $49,824
- Equity at exit
- $11,664
Cash invested: $37,772 (down + closing). Projections, not guarantees.
Landlord ↔ Tenant lean methodology
- Overall (STATE)
- 87 Strongly Landlord-Friendly
- State Florida
- 87 Strongly Landlord-Friendly · R+3
- County
- — inherits STATE
- City
- — inherits STATE
ZIP-level market 32179
- Home prices YoY
- -18.3%
- Active inventory
- 426
- Price-to-rent
- 6.8×
Monthly cashflow live
- Estimated rent
- $1,662 medium interval (Pro) →
- Mortgage (P&I)
- −$707
- Tax from tax record
- −$47 /mo · $561/yr
- Insurance
- −$56
- HOA
- −$0
- Vacancy / Maint / Mgmt
- −$349
- Net cashflow
- $503
Break-even live
UW: 25.0% down · 7.5% · 30yr · 1.5% tax · 5.0% vac · 8.0% maint · 8.0% mgmt
Financing live
Cash to close
- Down payment
- $33,725
- Closing costs
- $4,047
- Reserves months
- —
- Total cash needed
- —
Loan-product check · same deal, 3 products live
Conventional
25% down · 7.5% · 30yr
- Down + closing
- —
- Monthly P&I
- —
- Monthly cashflow
- —
- DSCR
- —
- Eligible?
- —
Personal DTI + credit; lowest rate.
DSCR
20% down · 8.5% · 30yr
- Down + closing
- —
- Monthly P&I
- —
- Monthly cashflow
- —
- DSCR
- —
- Eligible?
- —
No personal income docs; deal must DSCR.
Hard money
10% down · 12.0% · 12mo
- Down + closing
- —
- Monthly P&I
- —
- Monthly cashflow
- —
- DSCR
- —
- Eligible?
- —
Short-term bridge; refi at stabilization.
Listing history 34 events
-
2026-06-18days on market $134,900 Active 170 DOM
-
2026-06-17days on market $134,900 Active 169 DOM
-
2026-06-16days on market $134,900 Active 168 DOM
-
2026-06-15days on market $134,900 Active 167 DOM
-
2026-06-14days on market $134,900 Active 165 DOM
-
2026-06-13days on market $134,900 Active 164 DOM
-
2026-06-10days on market $134,900 Active 162 DOM
-
2026-06-09days on market $134,900 Active 161 DOM
-
2026-06-08days on market $134,900 Active 160 DOM
-
2026-06-07days on market $134,900 Active 159 DOM
-
2026-06-03days on market $134,900 Active 155 DOM
-
2026-06-02days on market $134,900 Active 154 DOM
-
2026-05-31days on market $134,900 Active 152 DOM
-
2026-05-30days on market $134,900 Active 151 DOM
-
2025-12-30$134,900 Active 2283-char remark
Show marketing remark (2283 chars)
Recently remodeled Lake Access Doublewide Mobile home with garage on a . 44 of an acre paved road property! Featuring a well kept 1973 3/1 958 sq ft Doublewide Mobile home. The entire home sits on a footer and concrete block foundation. The roof is a 2005 built up roof with 25 year siliconed roof screws. The central A/C Heat pump and trunk lines are approximately a 2021 model. The unattahced one car garage has both 120 & 240 volt electric with a separate built in removeable utility room partition. Attached is a 3x6 shed and a 6x9 shed. All trees were recently trimmed in 2024. Also included is an 8x10 2023 shed with a second washer and dryer hook up. On the front of the home is a breezy 10x18 sunrise screened room and on the back is a second 10x20 sunset screen room. The well pump and tank was replaced in 2023 and the drain field replaced in 2014 (pumped in 2023). The 3rd bedroom serves as a laundry room/bedroom combination. The following items were replaced in 2017: Bathroom with fiberglass tub, sheet rock interior walls through out, 25 solid wood kitchen cabinets with island work station, electrical , an attractive recessed ceiling in living room for the 2017 ceiling fan, interior paint, light fixtures, water heater, laminate, vinyl, tile & carpet flooring, high rise commode, gutter and bath storage cabinet. Also included is a 2023 Glass Top Range , 2023 over/under washer dryer. Also installed was new plumbing in 2025. The property fronts on two different quiet paved roads and has community lake access to a chain of lakes on 45 acre Lake Placid (see plat maps attached). The affordable average electric bill runs $120 to $133 per month. The local Moose Lodge is just 5 minutes away and is accepting new members. This is a developed property in a lovely neighborhood just 10 minutes from the Winn Dixie Shopping Center and more. An absolute great buy at just $134,900. Home is located in the Ocala National Forest which affords you almost a ½ million acres of Forest to roam, 600 lakes, 2 rivers, Juniper Springs, Silver Glen Springs, Salt Springs, Swimming, Skiing, Big BASS Fishing, Boating, Camping, Hiking, Horse back riding and some of the best ATV riding anywhere. Daytona Beach is just 1 hour away. Let the fun begin! You need it!
-
2025-08-13status Pending
-
2025-08-07$119,000 Active
-
2023-06-14soldstatus $118,000 Closed
-
2023-06-13soldstatus $118,000
-
2023-05-15status Pending
-
2023-05-01price $124,900
-
2023-03-21price $129,900
-
2023-01-24$139,900 Active
-
2017-04-03soldstatus $43,000
-
2017-02-28$44,900
-
2010-06-28soldstatus $62,000
-
2010-06-24soldstatus $62,000
-
2007-12-24$64,900
-
2007-04-18soldstatus $50,000
-
2007-04-06soldstatus $50,000
-
2007-01-16$65,900
-
2004-03-25soldstatus $35,000
-
2004-03-18soldstatus $35,000
-
2004-02-06$37,900
ⓘ Source: listings_history table (triggers on properties + properties_extension) + one-shot
backfill from property_details.listing_events for pre-trigger history.
Tax reassessment forecast FL · Resets to sale price
- Current annual tax
- $561 · $47/mo
- Projected year-2 tax
- $1,120 · $93/mo
- Expected delta
- +$558/yr (+$47/mo · 99.5%)
ⓘ Screening estimate from a state-policy table — verify with the county assessor before closing.
Climate risk First Street
- Flood 1/10 Low FEMA zone X (unshaded) · 0% chance over 30 yrs
- Wildfire 7/10 Severe
- Heat 8/10 Severe 7 d/yr ≥109°F today · 21 d/yr by 30 yrs out
- Wind 9/10 Extreme 99% chance of damaging wind over 30 yrs
- Air quality 3/10 Moderate 3 unhealthy d/yr today · 4 by 30 yrs out
Nearby sold comps map
Loading sold comps map…
Walkable amenities ~0.75 mi
Loading nearby amenities…
Taxation est. · year 1
- Rental income
- $19,946
- − Mortgage interest
- −$7,556
- − Property taxes
- −$561
- − Insurance
- −$674
- − Repairs & maintenance
- −$1,596
- − Management
- −$1,596
- − Depreciation
- −$3,924
- Taxable income
- $4,038
- Est. tax owed @ 24.0%
- −$969
- After-tax cash flow
- $5,063/yr
For passive investors: Depreciation is non-cash, so a rental often shows a tax loss while cash-flowing — sheltering income. Rental losses are passive: they offset passive income freely, and up to $25,000/yr can offset ordinary (W-2) income if you actively participate and your MAGI is under $100k (phasing out to $0 by $150k); unused losses carry forward. On sale, claimed depreciation is recaptured at up to 25%, and gains may owe capital-gains tax (a 1031 exchange can defer both). Figures are a year-1 estimate at your 24.0% rate — not tax advice; consult a CPA.
Schools (NCES district)
- District
- Marion
- NCES district ID
- 1201260
- Math proficiency
- 42% ▼ -7.00%
- Reading proficiency
- 43% ▼ -4.00%
- Median HH income
- $40,015
- Composite
- 35.61/100
- National rank
- #4890
- State rank
- #61 of 73 in FL
Livability — Silver Springs Shores East
No livability data for this city. (Only ~50 U.S. cities are tracked.)
Census & demographics
- County
- Marion County · 315,796 people
- Metro
- Ocala, FL
- Population (ZIP)
- 9,318
- Household income
- $46,512
- Rent vs Own
- Severe rent burden
- 303.0
Population outlook (Marion County) Hauer SSP2
- Today (2025)
- 365,905 people
- By 2030
- 376,768 · +3.0%
- By 2040
- 396,555 · +8.4%
- By 2050
- 412,723 · +12.8%
- By 2075
- 446,090 · +21.9%
- By 2100
- 436,193 · +19.2%
Race, ethnicity, and origin ACS 2023
- Neighborhood character
- Predominantly White (81%)
- Race & ethnicity
- White 81% Two or more races 12% Hispanic / Latino 11%
- Hispanic origin (detail)
- Mexican 5% Puerto Rican 3% Cuban 3%
- Common ancestry
- Slovak 4% Romanian 2% Lithuanian 2%
- Foreign-born
- 5% · Canada
- Languages at home
- 93% English-only · Spanish 7%
Political lean MEDSL · Marion
- 2024 margin
- Solid R (+31.6) · D 33.8% · R 65.5%
- 2008→2024 swing
- -20.0pp toward R · 2008: -11.6pp · 2024: -31.6pp
- All cycles
- 2024: R+31.6 2020: R+25.9 2016: R+26.2 2012: R+16.2 2008: R+11.6
Not yet ingested
- Civics
- —
Market trends
- HPI YoY
- ▼ -54.21%
- Current HPI
- 242.0408
- Rent YoY
- —
- Metro
- Ocala, FL
- State GDP YoY
- ▲ 3.28%
- F500 in state
- 36
Industry mix (Fortune 500 HQ in FL)
| Industry | F500 HQs | Revenue |
|---|---|---|
| Industrial Technology | 2 | $29B |
|
||
| Insurance | 2 | $17B |
|
||
| Retail | 1 | $60B |
|
||
| Technology Distribution | 1 | $58B |
|
||
| Homebuilding | 1 | $35B |
|
||
| Technology Manufacturing | 1 | $35B |
|
||
Price history
+255.9% since first listed20 events — show timeline
- 2025-12-30 Listed $134,900 Stellar MLS as Distributed by MLS Grid
- 2025-08-13 Pending — Stellar MLS as Distributed by MLS Grid
- 2025-08-07 Listed $119,000 Stellar MLS as Distributed by MLS Grid
- 2023-06-14 Sold (MLS) $118,000 Stellar MLS as Distributed by MLS Grid
- 2023-06-13 Sold (Public Records) $118,000 Public Records
- 2023-05-15 Pending — Stellar MLS as Distributed by MLS Grid
- 2023-05-01 Price Changed $124,900 Stellar MLS as Distributed by MLS Grid
- 2023-03-21 Price Changed $129,900 Stellar MLS as Distributed by MLS Grid
- 2023-01-24 Listed $139,900 Stellar MLS as Distributed by MLS Grid
- 2017-04-03 Sold (MLS) $43,000 Stellar MLS as Distributed by MLS Grid
- 2017-02-28 Listed $44,900 Stellar MLS as Distributed by MLS Grid
- 2010-06-28 Sold (Public Records) $62,000 Public Records
- 2010-06-24 Sold (MLS) $62,000 Stellar MLS as Distributed by MLS Grid
- 2007-12-24 Listed $64,900 Stellar MLS as Distributed by MLS Grid
- 2007-04-18 Sold (Public Records) $50,000 Public Records
- 2007-04-06 Sold (MLS) $50,000 Stellar MLS as Distributed by MLS Grid
- 2007-01-16 Listed $65,900 Stellar MLS as Distributed by MLS Grid
- 2004-03-25 Sold (Public Records) $35,000 Public Records
- 2004-03-18 Sold (MLS) $35,000 Stellar MLS as Distributed by MLS Grid
- 2004-02-06 Listed $37,900 Stellar MLS as Distributed by MLS Grid
Property tax history
+5.4%/yrLatest (2025): $561 · +60.7% YoY. Source: county tax records.
Cash-flow waterfall
monthlySold comps — $/sqft
last 12 mo · ≤1 miLoading sold comps…