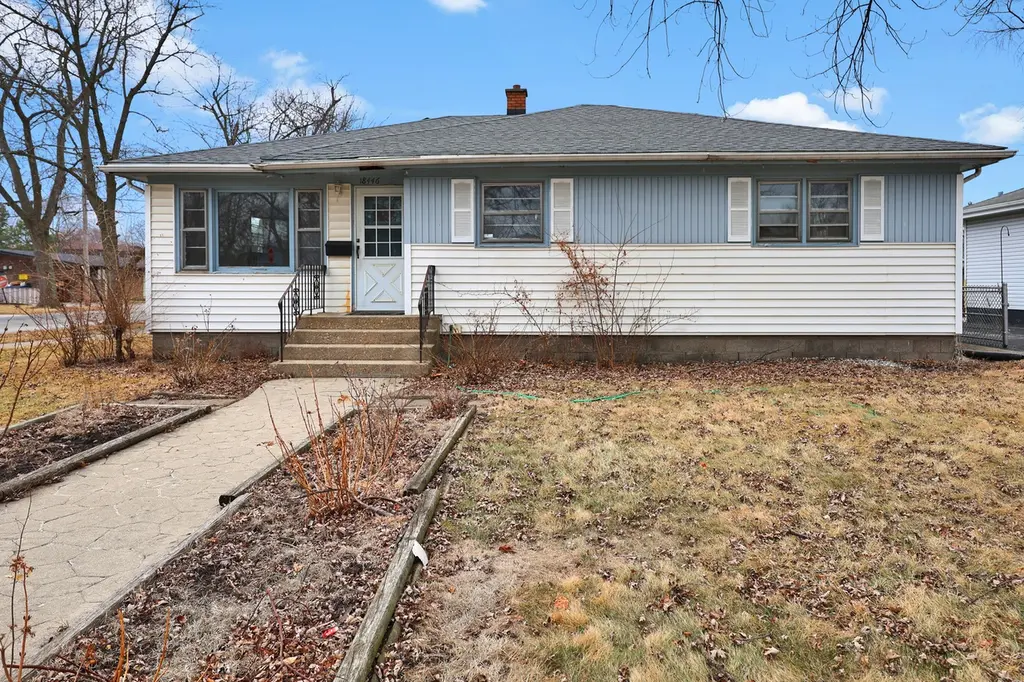
18446 Glen Oak Ave · Lansing, IL
Flood risk 1/10 · Minimal
- FEMA flood zone
- X (unshaded)
- Chance of flooding over 30 yrs
- 0.0%
- Est. flood insurance / yr
- $473 – $860
Fire risk 3/10 · Minor
- Est. fire insurance / yr
- $804 – $1,492
Heat risk 3/10 · Minor
- Hot days now (above 102°F)
- 7 days/yr
- Hot days in 30 yrs
- 15 days/yr
Wind risk 2/10 · Minimal
- Chance of severe wind over 30 yrs
- 0.0%
Air-quality risk 4/10 · Minor
- Unhealthy air days now
- 4 days/yr
- Unhealthy air days in 30 yrs
- 5 days/yr
Risk factors via First Street. Map © Google.
Why this score? — see what drove the C+ grade
The composite is a weighted blend of 9 inputs, each scored 0–100. Each bar is that input's sub-score; the figure is the points it added to the 100-point composite (weight × sub-score).
- Cash flow +24.7/30.0
- ARV discount +15.0/15.0
- DSCR +8.0/10.0
- 1% rule +6.4/10.0
- Livability +3.7/5.0
- Rent growth +2.5/5.0
- Condition / age +2.5/5.0
- Schools +1.0/10.0
- Appreciation +0.0/10.0
$145,000
🖨 Deal sheet 📄 Offer letter ✓ Due diligence
Listing remarks
Charming 3-Bedroom Ranch With Full Basement & 2-Car Garage! Welcome to this spacious 3-bedroom ranch offering comfortable one-level living plus a full basement for extra storage or future expansion. The home features a bright living room with plenty of natural light, an eat-in kitchen, and three well-sized bedrooms. The full basement provides additional flexibility-perfect for a recreation area, home gym, or workshop. Outside, you'll find a generous yard and a 2-car detached garage, ideal for parking and storage. Convenient location close to shopping, schools, and transportation. A great opportunity to make this home your own!
Key facts
- Generous yard
- Full basement
- Eat-in kitchen
Tags
Property features AI
Finance
- HOA & community: No master association fee required; Neighborhood has sidewalks and street lights
Exterior
- Parking: Detached garage on concrete (2 garage spaces, 2 total parking spaces)
- Utilities: Public water; Public sewer
- Home design: Detached single-family home; One-story
- Construction: Vinyl siding; Asphalt roof; Block foundation; Built 61–70 years ago; Built before 1978
- Exterior features: Corner lot; Chain-link fenced yard
Interior
- Kitchen: Kitchen on main level (8 x 11); Range; Refrigerator; Ceramic tile in kitchen
- Bedrooms: Master bedroom on main level (11 x 14) with half bath; Two additional main-level bedrooms (10 x 13 and 10 x 11)
- Flooring: Hardwood flooring throughout main living areas; Ceramic tile in kitchen
- Bathrooms: 1 full bathroom; 1 half bathroom
- Heating & cooling: Natural gas heating
- Interior features: First-floor bedroom; First-floor full bath; Unfinished full basement; 6 total rooms; Hardwood flooring in main living areas
- Laundry & utility: Dedicated laundry room
Neighborhood map
What this means for you Summary
Snapshot
- This is a 3-bed/1.5-bath single-family listed at $145k.
Deal economics
- At list price, monthly cash flow is $301 ($4k/yr) — positive.
- The deal already cash-flows at list — no discount required.
- Meets the 1% rule at list price ($2k rent vs $145k).
- Recommended offer: $132k (9.0% below list) — sets the bar for market timing.
- Cap rate 8.8% vs local median 5.8% in Lansing — top-decile yield for the area; either an underpriced asset or a hidden risk that comps aren't pricing in. Stress-test before assuming the spread holds.
Location & tenants
- Location reads 73/100 on livability (#296 in IL) — a middle-class / working-renter tenant base. Strengths: commute A+, cost of living A+, housing A+; Watch: schools D+, crime D+, health & safety D+.
- Thornton Fractional Twp Hsd 215 (suburban): math 9% / reading 13% proficiency, ranked #563 of 620 in IL (top 91%) — low school quality limits family demand, transient renter base, plan for 1-2y turnover.
- Market conditions: 132 active listings in the ZIP; 11 comparable units currently listed for rent nearby; rentals leasing fast (median 10d on market — plan ~1-2 weeks tenant-placement turnaround); solid renter incomes; 6,272 units permitted in Cook County in 2024 (4,658 in 5+ unit buildings).
Forward outlook
- Local home prices are declining (-3.0%/yr); year-one equity from $1k of loan paydown is wiped out by about $4k of value loss. Plan a longer hold.
Negotiation context
- It's been on market 112 days — a 9% lower offer ($132k) is reasonable based on typical stale-listing flexibility.
- 2 sale attempts; this cycle's ask has dropped $20k (12%) from the opening price — seller is motivated, your offer sets the floor, not the list.
- Current owner paid $100k; 45% above their basis — modest negotiation headroom, anchor on the comps not their cost.
Risks & watch-outs
- Watch-outs: built in 1958 — expect roof / HVAC / electrical / plumbing capex.
Questions for the listing agent
- It's been on market 112 days. Have you received any prior offers? Is the seller open to a 9% concession, seller financing, or rate buy-down credit?
- Built in 1958 — when were the roof, HVAC, electrical panel, plumbing, and water heater last replaced?
- Why hasn't it sold? Are there any deal-killer items the seller is aware of (foundation, flood, title, zoning, code violations)?
- Is there a deadline driving the sale (1031 exchange, divorce, estate, relocation)? That informs how much negotiation room exists.
- Schools are D-rated, which usually means shorter tenancies and higher turnover. Who's the typical renter profile here, and what's been the actual vacancy rate?
- Crime grade is D in this area — have there been break-ins, vandalism, or insurance claims at this property in the last 3 years? What carrier currently insures it and at what premium?
- What's the average days-on-market for RENTAL listings here right now (not sales)? A rising rental-DOM trend means longer vacancies and softer asking-rent achievability than the comps imply.
- What's the recent tenant-quality profile in this submarket — average credit score on applications, eviction rate, late-payment / NSF rate, and stable-employment percentage? A property-management company in the area should have these aggregated.
- How much new for-sale + rental construction is in the pipeline within 1–3 miles? Heavy new supply typically softens prices + rents 12–24 months out; constrained supply supports both.
Investment metrics
- 1% rule
- 1.14% ✓
- Cap rate
- 8.79%
- Cash-on-cash
- 8.91%
- DSCR
- 1.40
- GRM
- 7.3
CMA / ARV
- ARV (on-the-fly)
- $214,872
- Comps found
- 12
Show comp detail 12 sales within ~0.75 mi
| Address | Dist | Beds/Ba | Sqft | Sold | Price | $/sf | Match |
|---|---|---|---|---|---|---|---|
| 18518 Glen Oak Ave | 0.06mi | 4/2.0 (+1) | 1,338 (+5%) | 6mo | $257,000 | $192 | 78 |
| 2454 184th St | 0.14mi | 4/2.0 (+1) | 1,286 (+0%) | 10mo | $206,000 | $160 | 77 |
| 18429 Arcadia Ave | 0.10mi | 4/2.0 (+1) | 1,350 (+6%) | 6mo | $265,000 | $196 | 74 |
| 2621 Ridge Rd | 0.42mi | 4/2.0 (+1) | 1,323 (+3%) | 2mo | $216,000 | $163 | 66 |
| 18202 Locust St | 0.46mi | 3/1.5 | 1,366 (+7%) | 7mo | $185,000 | $135 | 62 |
| 18032 Wildwood Ave | 0.75mi | 3/1.5 | 1,224 (-4%) | 1mo | $170,000 | $139 | 57 |
| 17958 Escanaba Ave | 0.67mi | 3/1.5 | 1,236 (-3%) | 9mo | $207,500 | $168 | 56 |
| 17949 Escanaba Ave | 0.69mi | 3/1.0 | 1,188 (-7%) | 1mo | $149,000 | $125 | 53 |
| 18240 Wildwood Ave | 0.58mi | 3/2.0 | 1,400 (+10%) | 6mo | $264,000 | $189 | 51 |
| 17909 Rose St | 0.75mi | 3/2.0 | 1,147 (-10%) | 0mo | $230,000 | $201 | 46 |
| 18036 Oakley Ave | 0.57mi | 4/2.5 (+1) | 1,176 (-8%) | 6mo | $273,000 | $232 | 46 |
| 2316 Thornton Lansing Rd | 0.62mi | 3/1.0 | 1,104 (-14%) | 10mo | $144,900 | $131 | 38 |
Match score weights: distance 35% · size 25% · config 20% · recency 20%. Top-matched comps best support the ARV.
Projected returns pro-forma
-3.0% appreciation · 3.0% rent growth · sell at horizon
- IRR
- -2.8%
- Equity multiple
- 0.89×
- Total profit
- $-4,281
- Equity at exit
- $21,620
- IRR
- 6.9%
- Equity multiple
- 1.52×
- Total profit
- $21,085
- Equity at exit
- $12,537
Cash invested: $40,600 (down + closing). Projections, not guarantees.
Landlord ↔ Tenant lean methodology
- Overall (STATE)
- 43 Moderately Tenant-Leaning
- State Illinois
- 43 Moderately Tenant-Leaning · D+7
- County
- — inherits STATE
- City
- — inherits STATE
ZIP-level market 60438
- Active inventory
- 132
- Price-to-rent
- 7.3×
Monthly cashflow live
- Estimated rent
- $1,650 high interval (Pro) →
- Mortgage (P&I)
- −$760
- Tax est. 1.5%
- −$181 /mo · $2,175/yr
- Insurance
- −$60
- HOA
- −$0
- Vacancy / Maint / Mgmt
- −$346
- Net cashflow
- $301
Break-even live
UW: 25.0% down · 7.5% · 30yr · 1.5% tax · 5.0% vac · 8.0% maint · 8.0% mgmt
Financing live
Cash to close
- Down payment
- $36,250
- Closing costs
- $4,350
- Reserves months
- —
- Total cash needed
- —
Loan-product check · same deal, 3 products live
Conventional
25% down · 7.5% · 30yr
- Down + closing
- —
- Monthly P&I
- —
- Monthly cashflow
- —
- DSCR
- —
- Eligible?
- —
Personal DTI + credit; lowest rate.
DSCR
20% down · 8.5% · 30yr
- Down + closing
- —
- Monthly P&I
- —
- Monthly cashflow
- —
- DSCR
- —
- Eligible?
- —
No personal income docs; deal must DSCR.
Hard money
10% down · 12.0% · 12mo
- Down + closing
- —
- Monthly P&I
- —
- Monthly cashflow
- —
- DSCR
- —
- Eligible?
- —
Short-term bridge; refi at stabilization.
Rent comps 11 comps
| Address | Beds | Baths | Sqft | Rent | $/sqft | DOM | Units | Dist |
|---|---|---|---|---|---|---|---|---|
| 18550 Torrence Ave #25 Lansing, IL | 2.0 | 1.0 | 1000 | $1,300 | $1.30 | 11d | 1 | 0.08mi |
| 18381 Torrence Ave Lansing, IL | 2.0 | 1.0 | 900 | $1,300 | $1.44 | 24d | 1 | 0.16mi |
| 18361 Glen Oak Ave Unit 1E Lansing, IL | 2.0 | 1.0 | 900 | $1,400 | $1.56 | 24d | 1 | 0.19mi |
| 2824 186th St Lansing, IL | 3.0 | 2.0 | 1400 | $2,900 | $2.07 | 10d | 1 | 0.55mi |
| 18343 Oakwood Ave Lansing, IL | 4.0 | 2.0 | 1700 | $2,700 | $1.59 | 1d | 1 | 0.63mi |
| 17723 Exchange Ave Unit 17723-1N Lansing, IL | 3.0 | 2.0 | 1100 | $1,800 | $1.64 | 1d | 1 | 1.03mi |
| 17640 Rosewood Dr Unit 2A Lansing, IL | 2.0 | 1.0 | 950 | $1,475 | $1.55 | 17d | 1 | 1.12mi |
| 3020 178th St Apt C7 Lansing, IL | 2.0 | 1.0 | 900 | $1,550 | $1.72 | 24d | 1 | 1.18mi |
| 3020 178th St Unit C1 Lansing, IL | 2.0 | 1.0 | 900 | $1,550 | $1.72 | 1d | 1 | 1.18mi |
| 3341 S Schultz Dr Lansing, IL | 4.0 | 2.0 | 1452 | $2,250 | $1.55 | 10d | 1 | 1.19mi |
| 18335 Sherman St Unit 3 Lansing, IL | 3.0 | 1.0 | 1000 | $1,700 | $1.70 | 1d | 1 | 1.33mi |
Listing history 20 events
-
2026-06-18days on market $145,000 Active 112 DOM
-
2026-06-17days on market $145,000 Active 111 DOM
-
2026-06-16days on market $145,000 Active 110 DOM
-
2026-06-15days on market $145,000 Active 109 DOM
-
2026-06-13days on market $145,000 Active 107 DOM
-
2026-06-09pricedays on market $145,000 Active 103 DOM
-
2026-06-08days on market $150,000 Active 102 DOM
-
2026-06-07days on market $150,000 Active 101 DOM
-
2026-06-04days on market $150,000 Active 98 DOM
-
2026-06-03days on market $150,000 Active 97 DOM
-
2026-06-02days on market $150,000 Active 96 DOM
-
2026-06-01days on market $150,000 Active 95 DOM
-
2026-05-31days on market $150,000 Active 94 DOM
-
2026-05-08price $150,000
-
2026-04-11price $155,000
-
2026-02-26$165,000 Active
-
2025-11-07historical Contingent - Continue to Show
-
2025-10-29historical
-
2025-10-03Active
-
2004-01-21soldstatus $100,000
ⓘ Source: listings_history table (triggers on properties + properties_extension) + one-shot
backfill from property_details.listing_events for pre-trigger history.
Climate risk First Street
- Flood 1/10 Low FEMA zone X (unshaded) · 0% chance over 30 yrs
- Wildfire 3/10 Moderate
- Heat 3/10 Moderate 7 d/yr ≥102°F today · 15 d/yr by 30 yrs out
- Wind 2/10 Low 0% chance of damaging wind over 30 yrs
- Air quality 4/10 Moderate 4 unhealthy d/yr today · 5 by 30 yrs out
Nearby sold comps map
Loading sold comps map…
Walkable amenities ~0.75 mi
Loading nearby amenities…
Taxation est. · year 1
- Rental income
- $19,798
- − Mortgage interest
- −$8,122
- − Property taxes
- −$2,175
- − Insurance
- −$725
- − Repairs & maintenance
- −$1,584
- − Management
- −$1,584
- − Depreciation
- −$4,218
- Taxable income
- $1,390
- Est. tax owed @ 24.0%
- −$334
- After-tax cash flow
- $3,282/yr
For passive investors: Depreciation is non-cash, so a rental often shows a tax loss while cash-flowing — sheltering income. Rental losses are passive: they offset passive income freely, and up to $25,000/yr can offset ordinary (W-2) income if you actively participate and your MAGI is under $100k (phasing out to $0 by $150k); unused losses carry forward. On sale, claimed depreciation is recaptured at up to 25%, and gains may owe capital-gains tax (a 1031 exchange can defer both). Figures are a year-1 estimate at your 24.0% rate — not tax advice; consult a CPA.
Schools (NCES district)
- District
- Thornton Fractional Twp Hsd 215
- NCES district ID
- 1738940
- Math proficiency
- 9% ▼ -3.00%
- Reading proficiency
- 13% ▼ -3.00%
- Median HH income
- $48,207
- Composite
- 10.27/100
- National rank
- #9793
- State rank
- #563 of 620 in IL
Livability — Lansing
- Score
- 73/100
- State rank
- #296
- US rank
- #5698
Category grades
Schools grade is shown separately in the Schools card above.
Census & demographics
- Census place
- Lansing, IL
- County
- Cook County · 4,486,803 people
- City population
- 28,806
- Metro
- Chicago-Naperville-Elgin, IL-IN-WI
- Population (ZIP)
- 28,806
- Household income
- $75,681
- Rent vs Own
- Severe rent burden
- 830.0
Population outlook (Cook County) Hauer SSP2
- Today (2025)
- 5,347,519 people
- By 2030
- 5,357,703 · +0.2%
- By 2040
- 5,324,924 · -0.4%
- By 2050
- 5,230,762 · -2.2%
- By 2075
- 4,785,735 · -10.5%
- By 2100
- 4,188,836 · -21.7%
Race, ethnicity, and origin ACS 2023
- Neighborhood character
- Diverse neighborhood (Simpson 0.65)
- Race & ethnicity
- Black 51% White 25% Hispanic / Latino 18% Two or more races 7% Asian 2%
- Hispanic origin (detail)
- Mexican 15%
- Common ancestry
- Romanian 5% Iranian 3% Lithuanian 1%
- Foreign-born
- 10% · Canada
- Languages at home
- 83% English-only · Spanish 12% Vietnamese 1% French/Haitian/Cajun 1%
Political lean MEDSL · Cook
- 2024 margin
- Solid D (+42.0) · D 70.4% · R 28.4% · Other 1.2%
- 2008→2024 swing
- -11.4pp toward R · 2008: 53.4pp · 2024: 42.0pp
- All cycles
- 2024: D+42.0 2020: D+50.3 2016: D+53.0 2012: D+49.4 2008: D+53.4
Not yet ingested
- Civics
- —
Market trends
- HPI YoY
- ▼ -151.65%
- Current HPI
- 210.3398
- Rent YoY
- —
- Metro
- Chicago-Naperville-Elgin, IL-IN-WI
- State GDP YoY
- ▲ 1.59%
- F500 in state
- 60
Industry mix (Fortune 500 HQ in IL)
| Industry | F500 HQs | Revenue |
|---|---|---|
| Insurance | 4 | $201B |
|
||
| Consumer Goods | 4 | $87B |
|
||
| Industrial Machinery | 3 | $64B |
|
||
| Healthcare | 2 | $55B |
|
||
| Retail / Pharmacy | 1 | $148B |
|
||
| Agriculture / Food | 1 | $86B |
|
||
Price history
+50.0% since first listed7 events — show timeline
- 2026-05-08 Price Changed $150,000 MRED as Distributed by MLS Grid
- 2026-04-11 Price Changed $155,000 MRED as Distributed by MLS Grid
- 2026-02-26 Listed $165,000 MRED as Distributed by MLS Grid
- 2025-11-07 Contingent — MRED as Distributed by MLS Grid
- 2025-10-29 Listing Removed — MRED as Distributed by MLS Grid
- 2025-10-03 Listed — MRED as Distributed by MLS Grid
- 2004-01-21 Sold (Public Records) $100,000 Public Records
Property tax history
+4.9%/yrLatest (2023): $8,072 · +30.2% YoY. Source: county tax records.
Cash-flow waterfall
monthlySold comps — $/sqft
last 12 mo · ≤1 miLoading sold comps…