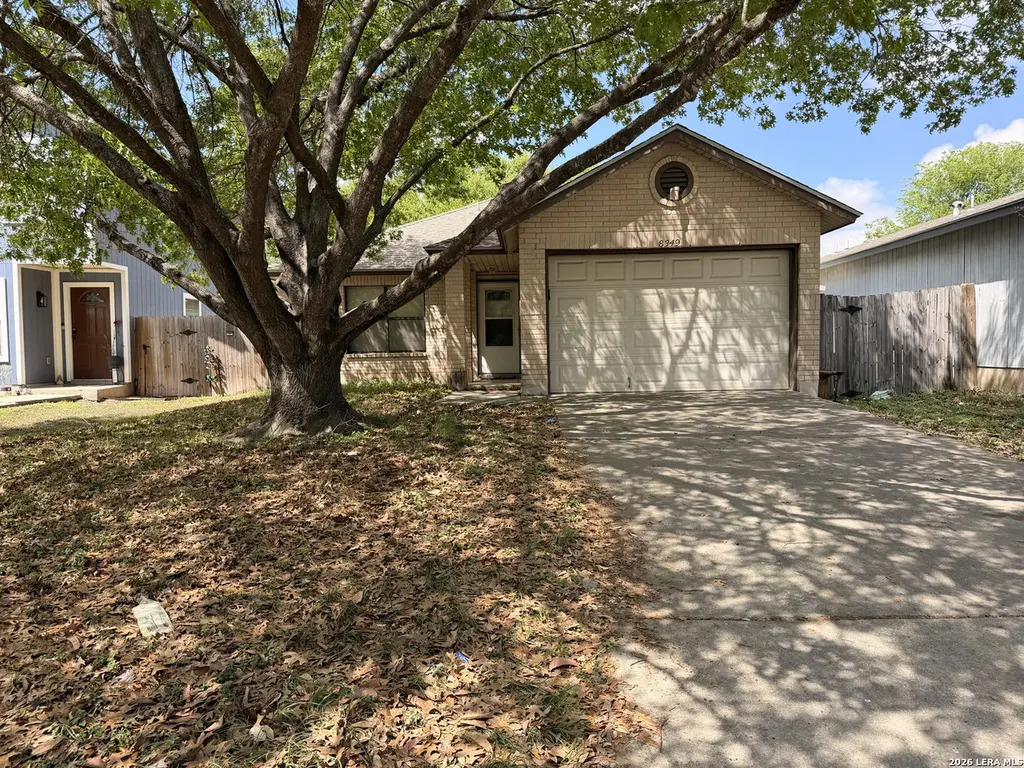
8349 Morning Grv · Converse, TX
Flood risk 1/10 · Minimal
- FEMA flood zone
- X (unshaded)
- Chance of flooding over 30 yrs
- 0.0%
- Est. flood insurance / yr
- $507 – $1,088
Fire risk 5/10 · Moderate
- Est. fire insurance / yr
- $1,222 – $2,270
Heat risk 8/10 · Major
- Hot days now (above 108°F)
- 7 days/yr
- Hot days in 30 yrs
- 22 days/yr
Wind risk 8/10 · Major
- Chance of severe wind over 30 yrs
- 80.0%
Air-quality risk 1/10 · Minimal
- Unhealthy air days now
- 0 days/yr
- Unhealthy air days in 30 yrs
- 0 days/yr
Risk factors via First Street. Map © Google.
Why this score? — see what drove the C grade
The composite is a weighted blend of 9 inputs, each scored 0–100. Each bar is that input's sub-score; the figure is the points it added to the 100-point composite (weight × sub-score).
- Cash flow +18.2/30.0
- ARV discount +15.0/15.0
- 1% rule +5.7/10.0
- DSCR +5.7/10.0
- Livability +3.3/5.0
- Condition / age +2.5/5.0
- Schools +2.4/10.0
- Rent growth +2.2/5.0
- Appreciation +0.0/10.0
$159,900
🖨 Deal sheet (PDF) 📄 Offer letter ✓ Due diligence
Listing remarks
Investor special with solid bones and tons of potential! This estate sale property is being sold as-is and is perfect for buyers looking to add value with a little TLC. Featuring 3 bedrooms, 2 bathrooms, and over 1,300 square feet, this one-story home offers a functional layout with a spacious living area, eat-in kitchen, and all bedrooms conveniently located on the main level. Major systems are in good condition, including the AC, water heater, and water softener-giving you a strong head start on improvements. The home also includes a one-car garage, an interior utility room, and a large walk-in pantry for added storage. Multiple walk-in closets provide great space and functionality throug
Key facts
- One story home
- Spacious living area
- Eat in kitchen
Tags
Property features AI
Finance
- Financial info: Association transfer fee applies
- HOA & community: Mandatory HOA; Community pool; Park/playground; HOA fee charged annually
Exterior
- Parking: 1-car garage
- Utilities: City water and sewer
- Home design: Pre-owned single-family home; Approximately 30 years old
- Construction: Brick and siding exterior; Composition roof; Slab foundation
- Exterior features: Covered patio; Patio slab; Privacy fence; Mature trees
Interior
- Kitchen: Eat-in kitchen; Stove/Range; Dishwasher; Walk-in pantry
- Bedrooms: Master bedroom with walk-in closet, ceiling fan and full bath; Bedroom 2; Bedroom 3
- Flooring: Carpeting; Wood flooring
- Bathrooms: Two full bathrooms; Master bath with tub/shower combination
- Heating & cooling: Central heating (electric); Central air conditioning
- Interior features: Ceiling fans; Chandelier; Eat-in kitchen; Walk-in pantry; Utility room inside; Washer and dryer connections; Stove/Range; Dishwasher; Ground level / no steps; Cable TV available; High speed internet; All bedrooms on main level; All window coverings remain
- Laundry & utility: Washer connection; Dryer connection; Utility room inside
Neighborhood map
What this means for you Summary
Snapshot
- This is a 3-bed/2.0-bath single-family listed at $160k.
Deal economics
- At list price, monthly cash flow is $144 ($2k/yr) — positive.
- The deal already cash-flows at list — no discount required.
- Meets the 1% rule at list price ($2k rent vs $160k).
- Cap rate 7.4% vs local median 4.4% in Converse — top-decile yield for the area; either an underpriced asset or a hidden risk that comps aren't pricing in. Stress-test before assuming the spread holds.
Location & tenants
- Location reads 66/100 on livability (#649 in TX) — a middle-class / working-renter tenant base. Strengths: cost of living A+, housing A+, employment B; Watch: schools C-, crime C-, amenities F.
- Judson ISD (suburban): math 21% / reading 33% proficiency, ranked #660 of 826 in TX (top 80%) — low school quality limits family demand, transient renter base, plan for 1-2y turnover.
- Market conditions: Rents soft (-1.1%/yr); 1152 active listings in the ZIP; 40 comparable units currently listed for rent nearby; rentals at typical pace (median 25d on market — plan ~3-4 weeks tenant-placement turnaround); solid renter incomes; 8,308 units permitted in Bexar County in 2024 (2,506 in 5+ unit buildings).
Forward outlook
- Local home prices are declining (-3.0%/yr); year-one equity from $1k of loan paydown is wiped out by about $5k of value loss. Plan a longer hold.
- Bexar County population projected at +50% by 2050 — long-run rental-demand tailwind backs the buy-and-hold thesis.
Negotiation context
- Only 12 days on market — expect competitive offers; lowballing is unlikely to land.
Risks & watch-outs
- Climate carrying-cost: severe wind risk, 80% chance of damaging wind over 30y; moderate wildfire risk; extreme-heat days projected 7→22/yr by 2055 (HVAC capex compounding) — expect insurance premiums to compound above CPI over the hold.
Questions for the listing agent
- What does the HOA fee cover, when was the last increase, and are there any pending special assessments or reserve-fund shortfalls?
- Is there a deadline driving the sale (1031 exchange, divorce, estate, relocation)? That informs how much negotiation room exists.
- What's the average days-on-market for RENTAL listings here right now (not sales)? A rising rental-DOM trend means longer vacancies and softer asking-rent achievability than the comps imply.
- What's the recent tenant-quality profile in this submarket — average credit score on applications, eviction rate, late-payment / NSF rate, and stable-employment percentage? A property-management company in the area should have these aggregated.
- How much new for-sale + rental construction is in the pipeline within 1–3 miles? Heavy new supply typically softens prices + rents 12–24 months out; constrained supply supports both.
Investment metrics
- 1% rule
- 1.07% ✓
- Cap rate
- 7.37%
- Cash-on-cash
- 3.86%
- DSCR
- 1.17
- GRM
- 7.8
CMA / ARV
- ARV (median comp)
- $201,390
- List price
- $159,900
- Delta
- -20.60%
- Verdict
- UNDERPRICED
- Comps
- 20 within 1.0 mi
Show comp detail 12 sales within ~0.75 mi
| Address | Dist | Beds/Ba | Sqft | Sold | Price | $/sf | Match |
|---|---|---|---|---|---|---|---|
| 8349 Morning Grv | 0.00mi | 3/2.0 | 1,328 (0%) | 0mo | $159,900 | $120 | 100 |
| 6555 Beech Trl | 0.30mi | 3/2.0 | 1,408 (+6%) | 2mo | $195,000 | $138 | 75 |
| 11548 Chestnut Rose | 0.60mi | 3/2.0 | 1,354 (+2%) | 3mo | $192,999 | $143 | 66 |
| 11572 Chestnut Rose | 0.60mi | 3/2.0 | 1,354 (+2%) | 3mo | $199,999 | $148 | 66 |
| 6852 Flatstone Pass | 0.38mi | 3/2.0 | 1,211 (-9%) | 2mo | $189,000 | $156 | 66 |
| 6630 Snow Mdw | 0.22mi | 3/2.0 | 1,525 (+15%) | 0mo | $215,000 | $141 | 65 |
| 11520 Chestnut Rose | 0.60mi | 3/2.0 | 1,380 (+4%) | 3mo | $159,999 | $116 | 63 |
| 6670 Snow Meadow Dr | 0.29mi | 3/2.0 | 1,513 (+14%) | 2mo | $169,900 | $112 | 62 |
| 8207 Tortoise Trl | 0.54mi | 3/2.0 | 1,436 (+8%) | 4mo | $270,000 | $188 | 58 |
| 11508 Chestnut Rose | 0.60mi | 3/2.0 | 1,213 (-9%) | 4mo | $182,999 | $151 | 54 |
| 11532 Chestnut Rose | 0.60mi | 3/2.0 | 1,213 (-9%) | 4mo | $180,999 | $149 | 54 |
| 11540 Chestnut Rose | 0.60mi | 4/2.0 (+1) | 1,483 (+12%) | 4mo | $197,999 | $134 | 44 |
Match score weights: distance 35% · size 25% · config 20% · recency 20%. Top-matched comps best support the ARV.
Projected returns pro-forma
-3.0% appreciation · 0.0% rent growth · sell at horizon
- IRR
- -13.9%
- Equity multiple
- 0.52×
- Total profit
- $-21,690
- Equity at exit
- $23,842
- IRR
- -11.4%
- Equity multiple
- 0.42×
- Total profit
- $-26,174
- Equity at exit
- $13,825
Cash invested: $44,772 (down + closing). Projections, not guarantees.
Landlord ↔ Tenant lean methodology
- Overall (STATE)
- 87 Strongly Landlord-Friendly
- State Texas
- 87 Strongly Landlord-Friendly · R+5
- County
- — inherits STATE
- City
- — inherits STATE
ZIP-level market 78109
- Home prices YoY
- -17.8%
- Rents YoY
- -1.1%
- Active inventory
- 1152
- Price-to-rent
- 7.8×
Monthly cashflow live
- Estimated rent
- $1,719 high interval (Pro) →
- Mortgage (P&I)
- −$839
- Tax from tax record
- −$287 /mo · $3,440/yr
- Insurance
- −$67
- HOA
- −$22
- Vacancy / Maint / Mgmt
- −$361
- Net cashflow
- $144
Break-even live
Sensitivity live
| Price | -10% $234 | -5% $189 | +0% $144 | +5% $99 | +10% $53 |
|---|---|---|---|---|---|
| Rent | -10% $8 | -5% $76 | +0% $144 | +5% $212 | +10% $280 |
| Rate | -1.0pp $224 | -0.5pp $185 | base $144 | +0.5pp $102 | +1.0pp $60 |
UW: 25.0% down · 7.5% · 30yr · 1.5% tax · 5.0% vac · 8.0% maint · 8.0% mgmt
Financing live
Cash to close
- Down payment
- $39,975
- Closing costs
- $4,797
- Reserves months
- —
- Total cash needed
- —
Loan-product check · same deal, 3 products live
Conventional
25% down · 7.5% · 30yr
- Down + closing
- —
- Monthly P&I
- —
- Monthly cashflow
- —
- DSCR
- —
- Eligible?
- —
Personal DTI + credit; lowest rate.
DSCR
20% down · 8.5% · 30yr
- Down + closing
- —
- Monthly P&I
- —
- Monthly cashflow
- —
- DSCR
- —
- Eligible?
- —
No personal income docs; deal must DSCR.
Hard money
10% down · 12.0% · 12mo
- Down + closing
- —
- Monthly P&I
- —
- Monthly cashflow
- —
- DSCR
- —
- Eligible?
- —
Short-term bridge; refi at stabilization.
Rent comps 40 comps
| Address | Beds | Baths | Sqft | Rent | $/sqft | DOM | Units | Dist |
|---|---|---|---|---|---|---|---|---|
| 6623 Meadow Dawn Dr Converse, TX | 3.0 | 2.0 | 1513 | $1,600 | $1.06 | 44d | 1 | 0.15mi |
| 6827 Cypress Mist Dr Converse, TX | 3.0 | 2.5 | 1698 | $1,449 | $0.85 | 3d | 1 | 0.15mi |
| 8335 Bent Meadow Dr Converse, TX | 3.0 | 2.0 | 1513 | $1,595 | $1.05 | 44d | 1 | 0.16mi |
| 6822 Eden Grove Dr Converse, TX | 3.0 | 2.0 | 1435 | $1,490 | $1.04 | 44d | 1 | 0.17mi |
| 6863 Cypress Mist Dr Converse, TX | 3.0 | 2.0 | 1735 | $1,550 | $0.89 | 11d | 1 | 0.22mi |
| 6846 Columbia Ridge Dr Converse, TX | 3.0 | 2.0 | 1307 | $1,430 | $1.09 | 5d | 1 | 0.24mi |
| 8304 Heights Vly Converse, TX | 3.0 | 2.0 | 1249 | $1,450 | $1.16 | 15d | 1 | 0.28mi |
| 6491 Beech Trail Dr Converse, TX | 3.0 | 2.0 | 1520 | $2,100 | $1.38 | 44d | 1 | 0.28mi |
| 6870 Flaming Ridge Dr Converse, TX | 3.0 | 2.5 | 1698 | $1,695 | $1.00 | 13d | 1 | 0.31mi |
| 6870 Flaming Ridge Dr Converse, TX | 3.0 | 2.0 | 1698 | $1,695 | $1.00 | 24d | 1 | 0.31mi |
| 8210 Steep Vly Converse, TX | 3.0 | 2.5 | 1757 | $1,485 | $0.85 | 44d | 1 | 0.33mi |
| 8011 Chestnut Barr Dr Converse, TX | 3.0 | 2.0 | 1520 | $1,665 | $1.10 | 44d | 1 | 0.33mi |
| 7038 Cole Creek Dr Converse, TX | 3.0 | 2.5 | 1582 | $1,695 | $1.07 | 24d | 1 | 0.34mi |
| 8732 Seneca Crk Converse, TX | 3.0 | 2.5 | 1582 | $1,445 | $0.91 | 44d | 1 | 0.36mi |
| 6802 Canary Meadow Dr Converse, TX | 3.0 | 2.0 | 1734 | $1,550 | $0.89 | 24d | 1 | 0.38mi |
| 8162 Heights Vly Converse, TX | 4.0 | 2.5 | 1828 | $1,680 | $0.92 | 44d | 1 | 0.38mi |
| 8206 Longhorn Ridge Dr Converse, TX | 3.0 | 2.0 | 1386 | $1,525 | $1.10 | 3d | 1 | 0.39mi |
| 6439 Beech Trail Dr Converse, TX | 3.0 | 2.0 | 1520 | $1,450 | $0.95 | 13d | 1 | 0.40mi |
| 6907 Saharastone Dr Converse, TX | 3.0 | 3.0 | 1211 | $1,416 | $1.17 | 13d | 1 | 0.40mi |
| 6907 Saharastone Dr Converse, TX | 3.0 | 3.0 | 1211 | $1,310 | $1.08 | 5d | 1 | 0.40mi |
| 8151 Cheryl Meadow Dr Converse, TX | 3.0 | 2.5 | 1698 | $1,730 | $1.02 | 5d | 1 | 0.51mi |
| 8127 Ocean Meadow Dr Converse, TX | 3.0 | 2.0 | 1520 | $1,700 | $1.12 | 44d | 1 | 0.51mi |
| 6610 Eastern Clouds Converse, TX | 3.0 | 2.0 | 1496 | $1,660 | $1.11 | 5d | 1 | 0.54mi |
| 8818 Slumber Ln Converse, TX | 3.0 | 2.0 | 1259 | $1,700 | $1.35 | 2d | 1 | 0.58mi |
| 8206 Talkenhorn Converse, TX | 3.0 | 2.0 | 1584 | $1,895 | $1.20 | 24d | 1 | 0.59mi |
| 8206 Talkenhorn Converse, TX | 3.0 | 2.0 | 1584 | $1,595 | $1.01 | 44d | 1 | 0.59mi |
| 6123 Ironmill Crk Converse, TX | 3.0 | 2.0 | 1590 | $1,595 | $1.00 | 44d | 1 | 0.59mi |
| 8039 Sunshine Trail Dr San Antonio, TX | 3.0 | 2.0 | 1774 | $1,745 | $0.98 | 5d | 1 | 0.60mi |
| 8827 Slumber Ln Converse, TX | 3.0 | 2.0 | 1292 | $2,000 | $1.55 | 44d | 1 | 0.60mi |
| 7611 Overview Pl San Antonio, TX | 3.0 | 2.0 | 1451 | $1,750 | $1.21 | 15d | 1 | 0.63mi |
| 8914 Kestrel Oak Converse, TX | 3.0 | 2.5 | 1582 | $1,600 | $1.01 | 24d | 1 | 0.69mi |
| 8848 Staghorn Ml Converse, TX | 3.0 | 2.0 | 1212 | $1,500 | $1.24 | 5d | 1 | 0.69mi |
| 6414 Kensinger Pass Converse, TX | 3.0 | 2.5 | 1582 | $2,100 | $1.33 | 44d | 1 | 0.70mi |
| 6027 Kensinger Pass Converse, TX | 3.0 | 2.0 | 1332 | $1,480 | $1.11 | 5d | 1 | 0.70mi |
| 8251 Sunshine Trail Dr San Antonio, TX | 3.0 | 2.0 | 1627 | $1,695 | $1.04 | 24d | 1 | 0.71mi |
| 7135 Grassy Trl San Antonio, TX | 3.0 | 2.0 | 1422 | $2,000 | $1.41 | 44d | 1 | 0.73mi |
| 6106 Secret Shrs San Antonio, TX | 3.0 | 2.5 | 1698 | $1,500 | $0.88 | 24d | 1 | 0.75mi |
| 5736 Brook Pr San Antonio, TX | 3.0 | 2.5 | 1497 | $1,500 | $1.00 | 24d | 1 | 0.76mi |
| 5735 Cool River Way San Antonio, TX | 3.0–5.0 | 2.0–3.5 | 2059 | $1,929 | $0.94 | 2d | 5 | 0.78mi |
| 8003 Chestnut Manor Dr Converse, TX | 3.0 | 2.0 | 1641 | $1,795 | $1.09 | 17d | 1 | 0.79mi |
HOA detail
- Monthly dues
- $22 · $264/yr
- Likely covers
- water
Listing history 3 events
-
2026-05-06status Pending 1118-char remark
-
2026-04-24$159,900 New 1118-char remark
-
1996-10-01soldstatus
ⓘ Source: listings_history table (triggers on properties + properties_extension) + one-shot
backfill from property_details.listing_events for pre-trigger history.
Tax reassessment forecast TX · Resets to sale price
- Current annual tax
- $3,440 · $287/mo
- Projected year-2 tax
- $3,440 · $287/mo
- Expected delta
- $0/yr ($0/mo · 0.0%)
ⓘ Screening estimate from a state-policy table — verify with the county assessor before closing.
Climate risk First Street
- Flood 1/10 Low FEMA zone X (unshaded) · 0% chance over 30 yrs
- Wildfire 5/10 Major
- Heat 8/10 Severe 7 d/yr ≥108°F today · 22 d/yr by 30 yrs out
- Wind 8/10 Severe 80% chance of damaging wind over 30 yrs
- Air quality 1/10 Low 0 unhealthy d/yr today · 0 by 30 yrs out
Nearby sold comps map
Loading sold comps map…
Walkable amenities ~0.75 mi
Loading nearby amenities…
Taxation est. · year 1
- Rental income
- $20,624
- − Mortgage interest
- −$8,957
- − Property taxes
- −$3,440
- − Insurance
- −$800
- − Repairs & maintenance
- −$1,650
- − Management
- −$1,650
- − HOA
- −$264
- − Depreciation
- −$4,652
- Taxable loss
- −$788
- Est. tax savings @ 24.0%
- +$189
- After-tax cash flow
- $1,916/yr
For passive investors: Depreciation is non-cash, so a rental often shows a tax loss while cash-flowing — sheltering income. Rental losses are passive: they offset passive income freely, and up to $25,000/yr can offset ordinary (W-2) income if you actively participate and your MAGI is under $100k (phasing out to $0 by $150k); unused losses carry forward. On sale, claimed depreciation is recaptured at up to 25%, and gains may owe capital-gains tax (a 1031 exchange can defer both). Figures are a year-1 estimate at your 24.0% rate — not tax advice; consult a CPA.
Schools (NCES district)
- District
- Judson ISD
- NCES district ID
- 4824990
- Math proficiency
- 21% ▼ -21.00%
- Reading proficiency
- 33% ▼ -7.00%
- Median HH income
- $57,542
- Composite
- 24.39/100
- National rank
- #7689
- State rank
- #660 of 826 in TX
Livability — Converse
- Score
- 66/100
- State rank
- #649
- US rank
- #12250
Category grades
Schools grade is shown separately in the Schools card above.
Census & demographics
- County
- Bexar County · 1,990,555 people
- City population
- 63,067
- Metro
- San Antonio-New Braunfels, TX
- Population (ZIP)
- 63,067
- Household income
- $91,320
- Rent vs Own
- Severe rent burden
- 1732.0
Population outlook (Bexar County) Hauer SSP2
- Today (2025)
- 2,336,851 people
- By 2030
- 2,560,728 · +9.6%
- By 2040
- 3,020,569 · +29.3%
- By 2050
- 3,493,522 · +49.5%
- By 2075
- 4,668,459 · +99.8%
- By 2100
- 5,533,242 · +136.8%
Race, ethnicity, and origin ACS 2023
- Neighborhood character
- Diverse neighborhood (Simpson 0.69)
- Race & ethnicity
- Hispanic / Latino 44% White 27% Two or more races 21% Black 21% Asian 3%
- Hispanic origin (detail)
- Mexican 29% Puerto Rican 4%
- Common ancestry
- Lithuanian 1% Romanian 1% Italian 1%
- Foreign-born
- 11% · Canada, Vietnam, South Korea
- Languages at home
- 71% English-only · Spanish 23% Tagalog/Filipino 1% Other Asian/Pacific 1%
Political lean MEDSL · Bexar
- 2024 margin
- Lean D (+9.8) · D 54.3% · R 44.6% · Other 1.1%
- 2008→2024 swing
- +4.2pp toward D · 2008: 5.6pp · 2024: 9.8pp
- All cycles
- 2024: D+9.8 2020: D+18.2 2016: D+13.5 2012: D+4.6 2008: D+5.6
Not yet ingested
- Civics
- —
Market trends
- HPI YoY
- ▼ -51.02%
- Current HPI
- 236.4923
- Rent YoY
- ▼ -1.08%
- Metro
- San Antonio-New Braunfels, TX
- State GDP YoY
- ▲ 3.95%
- F500 in state
- 110
Industry mix (Fortune 500 HQ in TX)
| Industry | F500 HQs | Revenue |
|---|---|---|
| Energy | 16 | $1,198B |
|
||
| Technology | 5 | $198B |
|
||
| Engineering / Construction | 4 | $72B |
|
||
| Energy Services | 3 | $60B |
|
||
| Utilities | 3 | $41B |
|
||
| Healthcare | 2 | $330B |
|
||
Price history
5 events — show timeline
- 2026-06-08 Sold (MLS) — LERA
- 2026-06-08 Sold (Public Records) — Public Records
- 2026-05-06 Pending — LERA
- 2026-04-24 Listed $159,900 LERA
- 1996-10-01 Sold (Public Records) — Public Records
Property tax history
+13.1%/yrLatest (2025): $3,440 · +2.4% YoY. Source: county tax records.
Cash-flow waterfall
monthlySold comps — $/sqft
last 12 mo · ≤1 miLoading sold comps…