 Multi-family
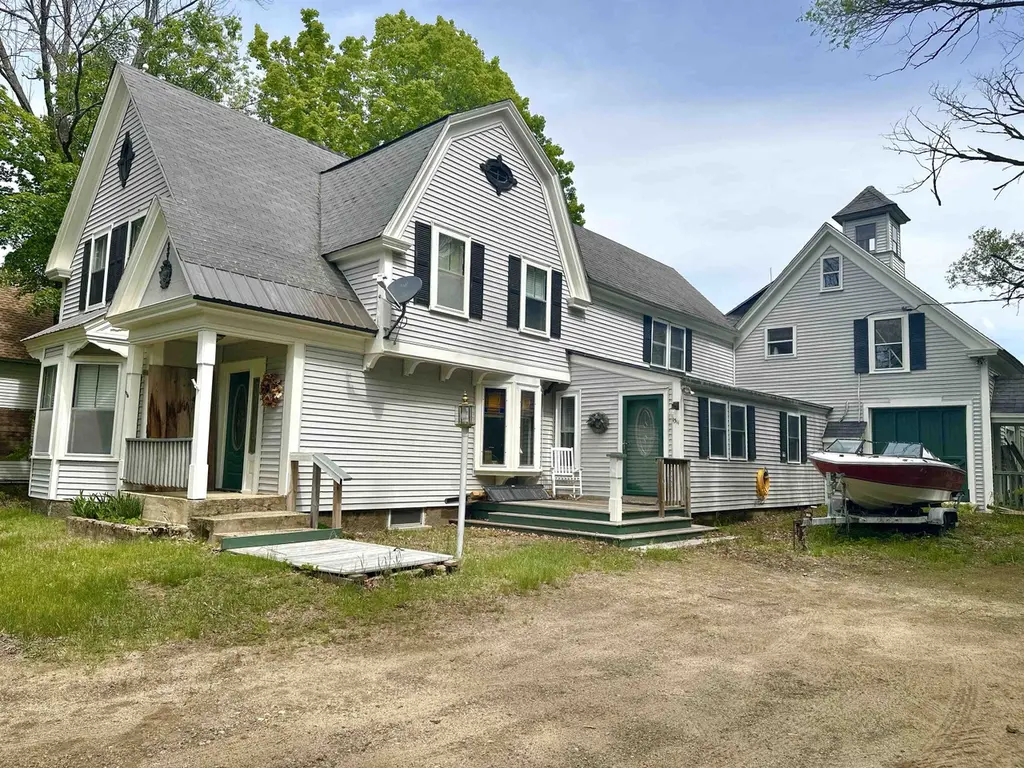
1311 Village Rd · Madison, NH
Flood risk 1/10 · Minimal
- FEMA flood zone
- X (unshaded)
- Chance of flooding over 30 yrs
- 0.0%
- Est. flood insurance / yr
- $507 – $1,088
Fire risk 3/10 · Minor
- Est. fire insurance / yr
- $507 – $941
Heat risk 3/10 · Minor
- Hot days now (above 93°F)
- 7 days/yr
- Hot days in 30 yrs
- 16 days/yr
Wind risk 3/10 · Minor
- Chance of severe wind over 30 yrs
- 5.0%
Air-quality risk 2/10 · Minimal
- Unhealthy air days now
- 1 days/yr
- Unhealthy air days in 30 yrs
- 1 days/yr
Risk factors via First Street. Map © Google.
Why this score? — see what drove the C- grade
The composite is a weighted blend of 9 inputs, each scored 0–100. Each bar is that input's sub-score; the figure is the points it added to the 100-point composite (weight × sub-score).
- Cash flow +19.2/30.0
- ARV discount +7.5/15.0
- DSCR +6.0/10.0
- Appreciation +5.0/10.0
- 1% rule +4.5/10.0
- Schools +3.4/10.0
- Rent growth +2.5/5.0
- Livability +2.5/5.0
- Condition / age +2.5/5.0
$399,000
🖨 Deal sheet 📄 Offer letter ✓ Due diligence
Multi-family units
County records classify this as Multi-Family (2-4 Unit). Listing-text estimate: 1 unit. estimate disagrees with records
Listing remarks
Prime Investment Opportunity – Walk to Silver Lake! Offering over 3,700 square feet of living space, this Victorian home is full of character and potential in a highly desirable location just steps from Silver Lake Beach. Featuring classic bay windows, vinyl siding, and generous living spaces, this property presents an excellent opportunity for investors, contractors, or buyers looking to restore a property to its full potential. The main residence features a spacious kitchen with ample storage, a dining area, formal living room, large den, and a ¾ bath with laundry on the first floor. Upstairs are three bright bedrooms and a full bath with a soaking tub. One bedroom connects t
Key facts
- Classic bay windows
- Spacious kitchen
- Private entrance
Tags
Property features AI
Finance
- Other: Total of 2 dwelling units (three 1-bedroom units and one 2-bedroom unit distribution indicated); Total finished area reported (data available but not shown per instructions)
Exterior
- Parking: 1-car garage
- Utilities: Drilled well water source; On-site septic system; Electric service with circuit breakers; Cable internet available
- Home design: Multi-family, multi-level Victorian style; Existing property built in 1875
- Construction: Wood frame construction; Metal and asphalt shingle roof; Built in 1875
- Exterior features: Level lot; Walking trails on or nearby; Near skiing; Beach access; Driveway composed of dirt and gravel
Interior
- Bedrooms: Unit 1: 3 bedrooms (located on levels 1 & 2); Unit 2: 1 bedroom
- Bathrooms: Unit 1: 3 bathrooms; Unit 2: 1 bathroom
- Heating & cooling: Oil heating with baseboard and hot water systems; No central cooling
- Interior features: Basement with interior access; partial, unfinished crawl space with interior stairs
Neighborhood map
What this means for you Summary
Snapshot
- This is a 5-bed/4.0-bath multifamily listed at $399k.
Deal economics
- At list price, monthly cash flow is $429 ($5k/yr) — positive.
- The deal already cash-flows at list — no discount required.
- To meet the 1% rule (rent ≥ 1% of price), the offer needs to be $378k (5.3% below list).
- Recommended offer: $378k (5.3% below list) — sets the bar for 1% rule.
Location & tenants
- Location reads: area grade C — affects rentability + tenant quality, not the cash-flow math above.
- Madison School District (rural): math 20% / reading 50% proficiency, ranked #145 of 171 in NH (top 85%) — families likely to look elsewhere, expect single-tenant / working-renter base with shorter leases.
- Zoned schools: Madison Elementary School (math 22% / reading 42%, grade F, #190 of 263 statewide, top 75%, 124 students, 39% FRL).
- Market conditions: 5 active listings in the ZIP; 357 units permitted in Carroll County in 2024 (0 in 5+ unit buildings).
Forward outlook
- In year one you build about $3k of equity ($3k loan paydown + $164 appreciation (0.0% local appreciation)).
- Carroll County population projected at -27% by 2050 — secular population decline; favor cash flow + early exit over multi-decade hold.
- At projected returns (0.0% appreciation + 3.0% rent growth), your $112k cash investment doubles in ~9 years — after that, you're playing with house money.
- By year 8, paydown + projected appreciation supports a ~$30k cash-out refi (75% LTV) — recoverable capital for the next deal without selling this one.
Negotiation context
- Only 1 days on market — expect competitive offers; lowballing is unlikely to land.
Risks & watch-outs
- Watch-outs: built in 1875 — expect roof / HVAC / electrical / plumbing capex.
Questions for the listing agent
- Built in 1875 — when were the roof, HVAC, electrical panel, plumbing, and water heater last replaced?
- Is there a deadline driving the sale (1031 exchange, divorce, estate, relocation)? That informs how much negotiation room exists.
- What's the average days-on-market for RENTAL listings here right now (not sales)? A rising rental-DOM trend means longer vacancies and softer asking-rent achievability than the comps imply.
- What's the recent tenant-quality profile in this submarket — average credit score on applications, eviction rate, late-payment / NSF rate, and stable-employment percentage? A property-management company in the area should have these aggregated.
- How much new apartment / multifamily construction is in the pipeline within 1–3 miles? Heavy new supply (>2% of stock underway) typically softens rents 12–24 months out; light construction supports rent growth.
Investment metrics
- 1% rule
- 0.95% ✗
- Cap rate
- 7.58%
- Cash-on-cash
- 4.60%
- DSCR
- 1.20
- GRM
- 8.8
CMA / ARV
No comps found within radius.
Projected returns pro-forma
0.04% appreciation · 3.0% rent growth · sell at horizon
- IRR
- 3.1%
- Equity multiple
- 1.15×
- Total profit
- $16,336
- Equity at exit
- $116,676
- IRR
- 8.4%
- Equity multiple
- 1.92×
- Total profit
- $102,329
- Equity at exit
- $140,905
Cash invested: $111,720 (down + closing). Projections, not guarantees.
Landlord ↔ Tenant lean methodology
- Overall (STATE)
- 56 Moderately Landlord-Leaning
- State New Hampshire
- 56 Moderately Landlord-Leaning · D+1
- County
- — inherits STATE
- City
- — inherits STATE
ZIP-level market 03875
- Home prices YoY
- 0.0%
- Active inventory
- 5
- Price-to-rent
- 22.5×
Monthly cashflow live
- Estimated rent
- $3,778 medium interval (Pro) →
- Mortgage (P&I)
- −$2,092
- Tax from tax record
- −$297 /mo · $3,567/yr
- Insurance
- −$166
- HOA
- −$0
- Vacancy / Maint / Mgmt
- −$793
- Net cashflow
- $429
Break-even live
3-unit breakdown (identical units grouped — click to expand)
| Units | Beds | Baths | Est. rent |
|---|---|---|---|
| 1× unit | 3 | 1.5 | $1,479 |
| 2× units | 1 | 1.5 | $2,298 |
| #2 | 1 | 1.5 | $1,149 |
| #3 | 1 | 1.5 | $1,149 |
| Total (3 units) | $3,778 | ||
UW: 25.0% down · 7.5% · 30yr · 1.5% tax · 5.0% vac · 8.0% maint · 8.0% mgmt
Financing live
Cash to close
- Down payment
- $99,750
- Closing costs
- $11,970
- Reserves months
- —
- Total cash needed
- —
Loan-product check · same deal, 3 products live
Conventional
25% down · 7.5% · 30yr
- Down + closing
- —
- Monthly P&I
- —
- Monthly cashflow
- —
- DSCR
- —
- Eligible?
- —
Personal DTI + credit; lowest rate.
DSCR
20% down · 8.5% · 30yr
- Down + closing
- —
- Monthly P&I
- —
- Monthly cashflow
- —
- DSCR
- —
- Eligible?
- —
No personal income docs; deal must DSCR.
Hard money
10% down · 12.0% · 12mo
- Down + closing
- —
- Monthly P&I
- —
- Monthly cashflow
- —
- DSCR
- —
- Eligible?
- —
Short-term bridge; refi at stabilization.
Listing history 6 events
-
2026-06-17days on market $399,000 Active 1 DOM
-
2026-06-16days on market $399,000 Active 6 DOM
-
2026-06-15days on market $399,000 Active 5 DOM
-
2026-06-13days on market $399,000 Active 3 DOM
-
2026-06-12remarks 686-char remark
-
2026-06-12$399,000 Active 2 DOM
ⓘ Source: listings_history table (triggers on properties + properties_extension) + one-shot
backfill from property_details.listing_events for pre-trigger history.
Tax reassessment forecast NH · Partial reset (capped growth)
- Current annual tax
- $3,567 · $297/mo
- Projected year-2 tax
- $6,133 · $511/mo
- Expected delta
- +$2,566/yr (+$214/mo · 71.9%)
ⓘ Screening estimate from a state-policy table — verify with the county assessor before closing.
Climate risk First Street
- Flood 1/10 Low FEMA zone X (unshaded) · 0% chance over 30 yrs
- Wildfire 3/10 Moderate
- Heat 3/10 Moderate 7 d/yr ≥93°F today · 16 d/yr by 30 yrs out
- Wind 3/10 Moderate 5% chance of damaging wind over 30 yrs
- Air quality 2/10 Low 1 unhealthy d/yr today · 1 by 30 yrs out
Nearby sold comps map
Loading sold comps map…
Walkable amenities ~0.75 mi
Loading nearby amenities…
Taxation est. · year 1
- Rental income
- $45,336
- − Mortgage interest
- −$22,350
- − Property taxes
- −$3,567
- − Insurance
- −$1,995
- − Repairs & maintenance
- −$3,627
- − Management
- −$3,627
- − Depreciation
- −$11,607
- Taxable loss
- −$1,437
- Est. tax savings @ 24.0%
- +$345
- After-tax cash flow
- $5,490/yr
For passive investors: Depreciation is non-cash, so a rental often shows a tax loss while cash-flowing — sheltering income. Rental losses are passive: they offset passive income freely, and up to $25,000/yr can offset ordinary (W-2) income if you actively participate and your MAGI is under $100k (phasing out to $0 by $150k); unused losses carry forward. On sale, claimed depreciation is recaptured at up to 25%, and gains may owe capital-gains tax (a 1031 exchange can defer both). Figures are a year-1 estimate at your 24.0% rate — not tax advice; consult a CPA.
Schools (NCES district)
- District
- Madison School District
- NCES district ID
- 3304560
- Math proficiency
- 20% ▼ -10.00%
- Reading proficiency
- 50% ▬ 0.00%
- Median HH income
- $56,168
- Composite
- 33.51/100
- National rank
- #10514
- State rank
- #145 of 171 in NH
Livability — Madison
No livability data for this city. (Only ~50 U.S. cities are tracked.)
Census & demographics
- Population (ZIP)
- 1,052
Population outlook (Carroll County) Hauer SSP2
- Today (2025)
- 45,072 people
- By 2030
- 43,158 · -4.2%
- By 2040
- 38,044 · -15.6%
- By 2050
- 33,087 · -26.6%
- By 2075
- 25,661 · -43.1%
- By 2100
- 18,684 · -58.5%
Race, ethnicity, and origin ACS 2023
- Neighborhood character
- Predominantly White (86%)
- Race & ethnicity
- White 86% Two or more races 12% Asian 1%
- Common ancestry
- Slovak 16% Lithuanian 14% Serbian 13%
- Foreign-born
- 4% · China
- Languages at home
- 96% English-only · Russian/Polish/Slavic 3%
Political lean MEDSL · Carroll
- 2024 margin
- Toss-up / Even · D 48.8% · R 50.5%
- 2008→2024 swing
- -8.0pp toward R · 2008: 6.3pp · 2024: -1.7pp
- All cycles
- 2024: R+1.7 2020: D+1.5 2016: R+5.7 2012: R+0.8 2008: D+6.3
Not yet ingested
- Civics
- —
Market trends
- HPI YoY
- ▬ 0.04%
- Current HPI
- 355.3101
- Rent YoY
- —
- Metro
- —
- State GDP YoY
- —
- F500 in state
- 0
Price history
1 event — show timeline
- 2026-06-11 Listed $399,000 PrimeMLS
Property tax history
-1.9%/yrLatest (2025): $3,567 · +2.2% YoY. Source: county tax records.
Cash-flow waterfall
monthlySold comps — $/sqft
last 12 mo · ≤1 miLoading sold comps…