 Duplex
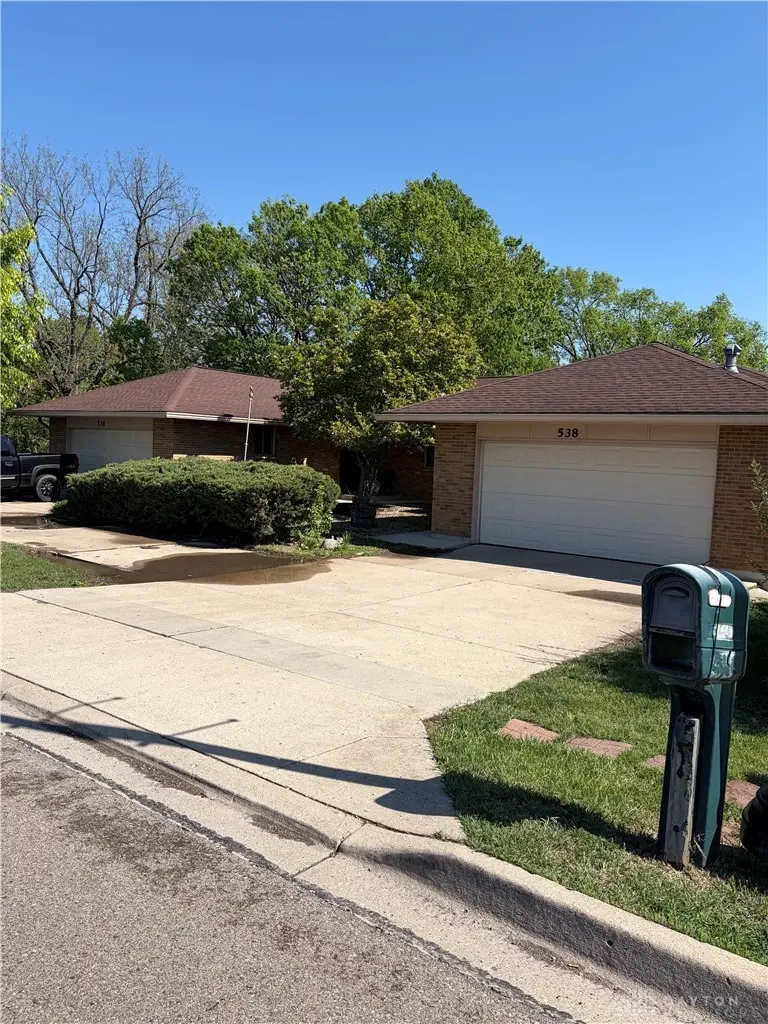
536-538 S Main St · Englewood, OH
Flood risk No data
- FEMA flood zone
- —
- Chance of flooding over 30 yrs
- —
- Est. flood insurance / yr
- —
Fire risk No data
- Est. fire insurance / yr
- —
Heat risk No data
- Hot days now (above threshold)
- —
- Hot days in 30 yrs
- —
Wind risk No data
- Chance of severe wind over 30 yrs
- —
Air-quality risk No data
- Unhealthy air days now
- —
- Unhealthy air days in 30 yrs
- —
Risk factors via First Street. Map © Google.
Why this score? — see what drove the C grade
The composite is a weighted blend of 9 inputs, each scored 0–100. Each bar is that input's sub-score; the figure is the points it added to the 100-point composite (weight × sub-score).
- Cash flow +23.4/30.0
- DSCR +7.5/10.0
- 1% rule +6.3/10.0
- ARV discount +6.2/15.0
- Schools +5.0/10.0
- Livability +3.5/5.0
- Condition / age +2.5/5.0
- Rent growth +2.4/5.0
- Appreciation +0.0/10.0
$275,000
🖨 Deal sheet (PDF) 📄 Offer letter ✓ Due diligence
Multi-family units
County records classify this as Multi-Family (2-4 Unit). Listing-text estimate: 2 units. confirmed
Listing remarks MLS
Welcome this to this duplex in the Northmont School District!. Live in one side and have your mortgage covered by your next door tenant! One unit features 3 bedrooms 2 baths. The other side features 2 bedrooms 1 bathroom. Great partially fenced backyard Surrounded by a variety of different amenities! Great Investment!
Key facts
- Recent updates
- Duct work
- Money-making duplex
Tags
Property features AI
Finance
- Other: Multi-unit property: 2 units in 1 building; unit type listed as Other
- Financial info: Gross income: $27,000 (multi-unit property with 2 units); For sale
Exterior
- Parking: Driveway; Garage with 4 spaces; Four or more parking spaces
- Security: Smoke detectors
- Utilities: Natural gas available; Public water; Sewer available
- Home design: Single-story building; Brick construction; Residential zoning
- Construction: Brick exterior; Crawl space foundation
- Exterior features: Partial fencing; Fence
Interior
- Kitchen: Range; Refrigerator
- Bathrooms: 3 full bathrooms
- Heating & cooling: Central air conditioning; Natural gas heating; Baseboard heating
- Interior features: Laminate counters
Neighborhood map
What this means for you Summary
Snapshot
- This is a 2 × 2-bed/1.5-bath units multifamily listed at $275k.
Deal economics
- At list price, monthly cash flow is $510 ($6k/yr) — positive. Per door: $255/mo.
- The deal already cash-flows at list — no discount required.
- Meets the 1% rule at list price ($3k rent vs $275k).
- Cap rate 8.5% vs local median 5.3% in Englewood — top-decile yield for the area; either an underpriced asset or a hidden risk that comps aren't pricing in. Stress-test before assuming the spread holds.
Location & tenants
- Location reads 69/100 on livability (#517 in OH) — a middle-class / working-renter tenant base. Strengths: cost of living A+, housing A+, schools A; Watch: employment C-, amenities F, commute F.
- Northmont City (suburban): math 52% / reading 62% proficiency, ranked #318 of 656 in OH (top 48%) — acceptable for families but not a draw, mixed tenant base, ~2y average lease.
- Market conditions: Rents soft (-0.5%/yr); 88 active listings in the ZIP; solid renter incomes; 907 units permitted in Montgomery County in 2024 (416 in 5+ unit buildings).
- At $3,095/mo this rent would consume 49% of the median local household income ($75k/yr) (locally 357% of renters already pay >50% of income on rent) — very limited rent-growth headroom before tenants either downsize or default.
Forward outlook
- Local home prices are declining (-3.0%/yr); year-one equity from $2k of loan paydown is wiped out by about $8k of value loss. Plan a longer hold.
- Montgomery County population projected at -10% by 2050 — secular population decline; favor cash flow + early exit over multi-decade hold.
Negotiation context
- Only 9 days on market — expect competitive offers; lowballing is unlikely to land.
- 2 sale attempts since 4y ago with the ask held roughly flat each time — persistent listings suggest the price (not the market) is what's stuck; bring a comps-based counter.
Risks & watch-outs
- Watch-outs: built in 1955 — expect roof / HVAC / electrical / plumbing capex.
Questions for the listing agent
- Can we see the unit-by-unit rent roll, current vacancy, and any below-market leases? What's the average tenancy length?
- What capital expenditures (roof, boiler, parking lot, exteriors) have been made in the last 5 years, and what's planned in the next 2?
- Built in 1955 — when were the roof, HVAC, electrical panel, plumbing, and water heater last replaced?
- Is there a deadline driving the sale (1031 exchange, divorce, estate, relocation)? That informs how much negotiation room exists.
- Schools are A-rated — typically a magnet for longer-tenancy family renters. What's the average tenant stay here, and is there a school-zone premium baked into asking?
- What's the average days-on-market for RENTAL listings here right now (not sales)? A rising rental-DOM trend means longer vacancies and softer asking-rent achievability than the comps imply.
- What's the recent tenant-quality profile in this submarket — average credit score on applications, eviction rate, late-payment / NSF rate, and stable-employment percentage? A property-management company in the area should have these aggregated.
- How much new apartment / multifamily construction is in the pipeline within 1–3 miles? Heavy new supply (>2% of stock underway) typically softens rents 12–24 months out; light construction supports rent growth.
Investment metrics
- 1% rule
- 1.13% ✓
- Cap rate
- 8.52%
- Cash-on-cash
- 7.95%
- DSCR
- 1.35
- GRM
- 7.4
CMA / ARV
- ARV (median comp)
- $267,000
- List price
- $275,000
- Delta
- 3.00%
- Verdict
- FAIR
- Comps
- 3 within 1.0 mi
Show comp detail 1 sale within ~0.75 mi
| Address | Dist | Beds/Ba | Sqft | Sold | Price | $/sf | Match |
|---|---|---|---|---|---|---|---|
| 536-538 S Main St | 0.00mi | 5/3.0 | 2,430 (0%) | 1mo | $267,000 | $110 | 95 |
Match score weights: distance 35% · size 25% · config 20% · recency 20%. Top-matched comps best support the ARV.
Projected returns pro-forma
-3.0% appreciation · 0.0% rent growth · sell at horizon
- IRR
- -7.7%
- Equity multiple
- 0.73×
- Total profit
- $-21,094
- Equity at exit
- $41,003
- IRR
- -2.5%
- Equity multiple
- 0.85×
- Total profit
- $-11,333
- Equity at exit
- $23,777
Cash invested: $77,000 (down + closing). Projections, not guarantees.
Landlord ↔ Tenant lean methodology
- Overall (STATE)
- 73 Landlord-Friendly
- State Ohio
- 73 Landlord-Friendly · R+6
- County
- — inherits STATE
- City
- — inherits STATE
ZIP-level market 45322
- Rents YoY
- -0.5%
- Active inventory
- 88
- Price-to-rent
- 14.8×
Monthly cashflow live
- Estimated rent
- $3,095 high interval (Pro) →
- Mortgage (P&I)
- −$1,442
- Tax from tax record
- −$379 /mo · $4,542/yr
- Insurance
- −$115
- HOA
- −$0
- Vacancy / Maint / Mgmt
- −$650
- Net cashflow
- $510
Break-even live
Sensitivity live
| Price | -10% $665 | -5% $588 | +0% $510 | +5% $432 | +10% $354 |
|---|---|---|---|---|---|
| Rent | -10% $265 | -5% $388 | +0% $510 | +5% $632 | +10% $754 |
| Rate | -1.0pp $648 | -0.5pp $580 | base $510 | +0.5pp $439 | +1.0pp $366 |
2-unit breakdown (identical units grouped — click to expand)
| Units | Beds | Baths | Est. rent |
|---|---|---|---|
| 2× units | 2 | 1.5 | $3,096 |
| #1 | 2 | 1.5 | $1,548 |
| #2 | 2 | 1.5 | $1,548 |
| Total (2 units) | $3,095 | ||
UW: 25.0% down · 7.5% · 30yr · 1.5% tax · 5.0% vac · 8.0% maint · 8.0% mgmt
Financing live
Cash to close
- Down payment
- $68,750
- Closing costs
- $8,250
- Reserves months
- —
- Total cash needed
- —
Loan-product check · same deal, 3 products live
Conventional
25% down · 7.5% · 30yr
- Down + closing
- —
- Monthly P&I
- —
- Monthly cashflow
- —
- DSCR
- —
- Eligible?
- —
Personal DTI + credit; lowest rate.
DSCR
20% down · 8.5% · 30yr
- Down + closing
- —
- Monthly P&I
- —
- Monthly cashflow
- —
- DSCR
- —
- Eligible?
- —
No personal income docs; deal must DSCR.
Hard money
10% down · 12.0% · 12mo
- Down + closing
- —
- Monthly P&I
- —
- Monthly cashflow
- —
- DSCR
- —
- Eligible?
- —
Short-term bridge; refi at stabilization.
Listing history 9 events
-
2026-05-02status Pending 644-char remark
-
2026-04-23$275,000 Active 644-char remark
-
2022-10-11soldstatus $173,697 Closed 320-char remark
Show marketing remark (320 chars)
Welcome this to this duplex in the Northmont School District!. Live in one side and have your mortgage covered by your next door tenant! One unit features 3 bedrooms 2 baths. The other side features 2 bedrooms 1 bathroom. Great partially fenced backyard Surrounded by a variety of different amenities! Great Investment!
-
2022-10-11soldstatus $173,697 Sold 320-char remark
Show marketing remark (320 chars)
Welcome this to this duplex in the Northmont School District!. Live in one side and have your mortgage covered by your next door tenant! One unit features 3 bedrooms 2 baths. The other side features 2 bedrooms 1 bathroom. Great partially fenced backyard Surrounded by a variety of different amenities! Great Investment!
-
2022-09-06status Pending 320-char remark
Show marketing remark (320 chars)
Welcome this to this duplex in the Northmont School District!. Live in one side and have your mortgage covered by your next door tenant! One unit features 3 bedrooms 2 baths. The other side features 2 bedrooms 1 bathroom. Great partially fenced backyard Surrounded by a variety of different amenities! Great Investment!
-
2022-09-01$204,900 Active 320-char remark
Show marketing remark (320 chars)
Welcome this to this duplex in the Northmont School District!. Live in one side and have your mortgage covered by your next door tenant! One unit features 3 bedrooms 2 baths. The other side features 2 bedrooms 1 bathroom. Great partially fenced backyard Surrounded by a variety of different amenities! Great Investment!
-
1998-01-08soldstatus $121,000
-
1997-01-08soldstatus $121,000
-
1991-06-18soldstatus $94,000
ⓘ Source: listings_history table (triggers on properties + properties_extension) + one-shot
backfill from property_details.listing_events for pre-trigger history.
Tax reassessment forecast OH · Partial reset (capped growth)
- Current annual tax
- $4,542 · $379/mo
- Projected year-2 tax
- $4,542 · $379/mo
- Expected delta
- $0/yr ($0/mo · 0.0%)
ⓘ Screening estimate from a state-policy table — verify with the county assessor before closing.
Nearby sold comps map
Loading sold comps map…
Walkable amenities ~0.75 mi
Loading nearby amenities…
Taxation est. · year 1
- Rental income
- $37,140
- − Mortgage interest
- −$15,404
- − Property taxes
- −$4,542
- − Insurance
- −$1,375
- − Repairs & maintenance
- −$2,971
- − Management
- −$2,971
- − Depreciation
- −$8,000
- Taxable income
- $1,876
- Est. tax owed @ 24.0%
- −$450
- After-tax cash flow
- $5,668/yr
For passive investors: Depreciation is non-cash, so a rental often shows a tax loss while cash-flowing — sheltering income. Rental losses are passive: they offset passive income freely, and up to $25,000/yr can offset ordinary (W-2) income if you actively participate and your MAGI is under $100k (phasing out to $0 by $150k); unused losses carry forward. On sale, claimed depreciation is recaptured at up to 25%, and gains may owe capital-gains tax (a 1031 exchange can defer both). Figures are a year-1 estimate at your 24.0% rate — not tax advice; consult a CPA.
Schools (NCES district)
- District
- Northmont City
- NCES district ID
- 3904872
- Math proficiency
- 52% ▼ -15.00%
- Reading proficiency
- 62% ▼ -8.00%
- Median HH income
- $60,230
- Composite
- 49.53/100
- National rank
- #1995
- State rank
- #318 of 656 in OH
Livability — Englewood
- Score
- 69/100
- State rank
- #517
- US rank
- #8768
Category grades
Schools grade is shown separately in the Schools card above.
Census & demographics
- Census place
- Englewood, OH
- County
- Montgomery County · 459,541 people
- City population
- 20,884
- Metro
- Dayton-Kettering, OH
- Population (ZIP)
- 20,884
- Household income
- $75,349
- Rent vs Own
- Severe rent burden
- 357.0
Population outlook (Montgomery County) Hauer SSP2
- Today (2025)
- 523,241 people
- By 2030
- 514,948 · -1.6%
- By 2040
- 493,378 · -5.7%
- By 2050
- 469,639 · -10.2%
- By 2075
- 418,360 · -20.0%
- By 2100
- 353,315 · -32.5%
Race, ethnicity, and origin ACS 2023
- Neighborhood character
- Predominantly White (80%)
- Race & ethnicity
- White 80% Black 11% Two or more races 6% Hispanic / Latino 3% Asian 1%
- Common ancestry
- Lithuanian 2% Slovak 2% Romanian 1%
- Foreign-born
- 3% · China, Canada
- Languages at home
- 96% English-only · Spanish 2%
Political lean MEDSL · Montgomery
- 2024 margin
- Toss-up / Even · D 49.8% · R 49.3%
- 2008→2024 swing
- -5.8pp toward R · 2008: 6.2pp · 2024: 0.5pp
- All cycles
- 2024: D+0.5 2020: D+2.2 2016: R+1.2 2012: D+3.1 2008: D+6.2
Not yet ingested
- Civics
- —
Market trends
- HPI YoY
- ▼ -176.42%
- Current HPI
- 218.5409
- Rent YoY
- ▼ -0.45%
- Metro
- Dayton-Kettering, OH
- State GDP YoY
- ▲ 1.98%
- F500 in state
- 48
Industry mix (Fortune 500 HQ in OH)
| Industry | F500 HQs | Revenue |
|---|---|---|
| Insurance | 3 | $145B |
|
||
| Industrial Machinery | 3 | $49B |
|
||
| Financial Services | 3 | $24B |
|
||
| Consumer Goods | 2 | $93B |
|
||
| Aerospace / Defense | 2 | $47B |
|
||
| Utilities | 2 | $33B |
|
||
Price history
+184.0% since first listed10 events — show timeline
- 2026-05-22 Sold (MLS) $267,000 Dayton MLS
- 2026-05-02 Pending — Dayton MLS
- 2026-04-23 Listed $275,000 Dayton MLS
- 2022-10-11 Sold (MLS) $173,697 Dayton MLS
- 2022-10-11 Sold (MLS) $173,697 Dayton MLS
- 2022-09-06 Pending — Dayton MLS
- 2022-09-01 Listed $204,900 Dayton MLS
- 1998-01-08 Sold (Public Records) $121,000 Public Records
- 1997-01-08 Sold (Public Records) $121,000 Public Records
- 1991-06-18 Sold (Public Records) $94,000 Public Records
Property tax history
+1.9%/yrLatest (2025): $4,542 · -6.0% YoY. Source: county tax records.
Cash-flow waterfall
monthlySold comps — $/sqft
last 12 mo · ≤1 miLoading sold comps…