 🏗️ New Construction
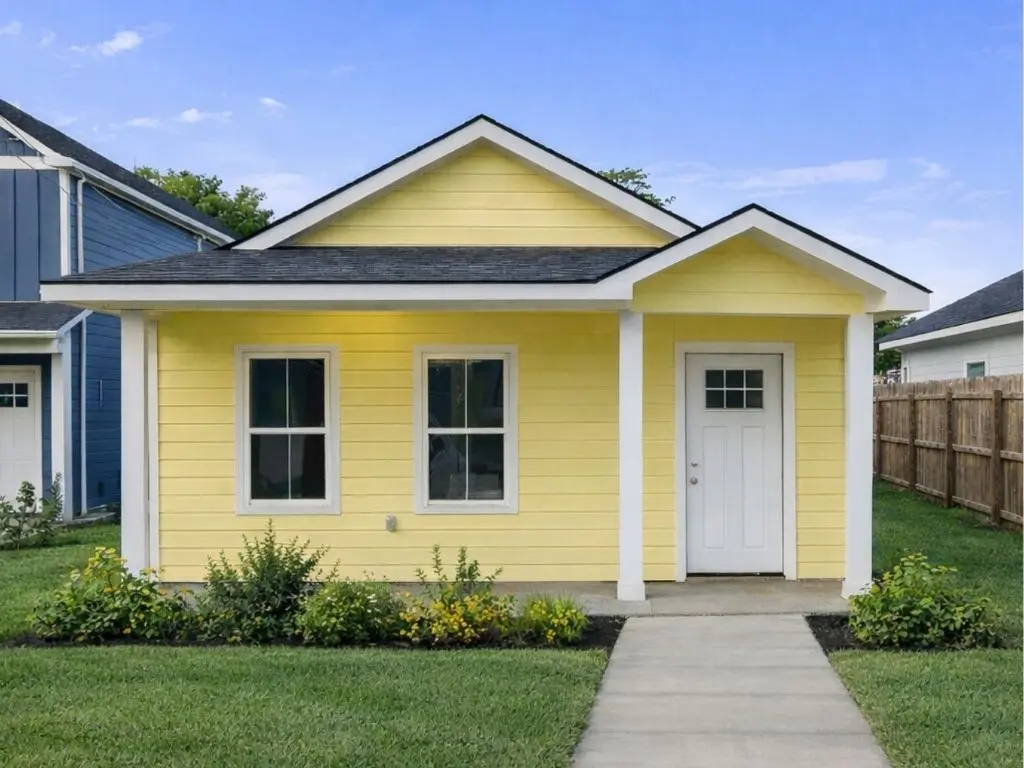
The Elvis Plan · Conroe, TX
Flood risk 1/10 · Minimal
- FEMA flood zone
- X (unshaded)
- Chance of flooding over 30 yrs
- 0.0%
- Est. flood insurance / yr
- $507 – $1,088
Fire risk 4/10 · Minor
- Est. fire insurance / yr
- $1,222 – $2,270
Heat risk 8/10 · Major
- Hot days now (above 110°F)
- 7 days/yr
- Hot days in 30 yrs
- 24 days/yr
Wind risk 8/10 · Major
- Chance of severe wind over 30 yrs
- 99.0%
Air-quality risk 2/10 · Minimal
- Unhealthy air days now
- 1 days/yr
- Unhealthy air days in 30 yrs
- 1 days/yr
Risk factors via First Street. Map © Google.
Why this score? — see what drove the C- grade
The composite is a weighted blend of 9 inputs, each scored 0–100. Each bar is that input's sub-score; the figure is the points it added to the 100-point composite (weight × sub-score).
- Cash flow +17.7/30.0
- ARV discount +7.5/15.0
- DSCR +5.6/10.0
- Schools +5.4/10.0
- 1% rule +5.0/10.0
- Condition / age +4.0/5.0
- Livability +3.7/5.0
- Rent growth +2.6/5.0
- Appreciation +0.0/10.0
$169,900
🖨 Deal sheet 📄 Offer letter ✓ Due diligence
Listing remarks MLS
Do Not Miss The Elvis, a stunning, modern 1 story, 3-bedroom, 2-bathroom home designed to turn heads. Inside, the open-concept layout offers effortless flow between the living area, dining space, and a sleek, thoughtfully designed kitchen.
Key facts
- Listed 107 days
Neighborhood map
What this means for you Summary
Snapshot
- This is a 3-bed/2.0-bath single-family listed at $170k. Condition is rated good.
Deal economics
- At list price, monthly cash flow is $141 ($2k/yr) — positive.
- The deal already cash-flows at list — no discount required.
- Meets the 1% rule at list price ($2k rent vs $170k).
- Recommended offer: $155k (9.0% below list) — sets the bar for market timing.
- Cap rate 7.3% vs local median 3.1% in Conroe — top-decile yield for the area; either an underpriced asset or a hidden risk that comps aren't pricing in. Stress-test before assuming the spread holds.
Location & tenants
- Location reads 74/100 on livability (#169 in TX, #4,447 nationally) — a middle-class / working-renter tenant base. Strengths: cost of living A+, housing A+, amenities B; Watch: schools D+, commute F, health & safety F.
- Montgomery ISD (rural): math 63% / reading 57% proficiency, ranked #49 of 826 in TX (top 6%) — acceptable for families but not a draw, mixed tenant base, ~2y average lease.
- Market conditions: Rents flat; 2283 active listings in the ZIP; 4 comparable units currently listed for rent nearby; rentals lingering (median 44d on market — plan ~5-8 weeks vacancy on turnover, expect pricing pressure); 50% of comp listings sitting > 30 days — soft ceiling on asking rent; high-income renter base; 13,259 units permitted in Montgomery County in 2024 (1,402 in 5+ unit buildings).
- This rent is only 17% of the median local income ($124k/yr) — well below the 30% rent-burden line; pricing power to push rent on renewal without tenant pushback.
Forward outlook
- Local home prices are declining (-3.0%/yr); year-one equity from $1k of loan paydown is wiped out by about $5k of value loss. Plan a longer hold.
- Montgomery County population projected at +65% by 2050 — long-run rental-demand tailwind backs the buy-and-hold thesis.
Negotiation context
- It's been on market 107 days — a 9% lower offer ($155k) is reasonable based on typical stale-listing flexibility.
Risks & watch-outs
- Climate carrying-cost: severe wind risk, 99% chance of damaging wind over 30y; extreme-heat days projected 7→24/yr by 2055 (HVAC capex compounding) — expect insurance premiums to compound above CPI over the hold.
Questions for the listing agent
- It's been on market 107 days. Have you received any prior offers? Is the seller open to a 9% concession, seller financing, or rate buy-down credit?
- What does the HOA fee cover, when was the last increase, and are there any pending special assessments or reserve-fund shortfalls?
- Why hasn't it sold? Are there any deal-killer items the seller is aware of (foundation, flood, title, zoning, code violations)?
- Is there a deadline driving the sale (1031 exchange, divorce, estate, relocation)? That informs how much negotiation room exists.
- Schools are D-rated, which usually means shorter tenancies and higher turnover. Who's the typical renter profile here, and what's been the actual vacancy rate?
- What's the average days-on-market for RENTAL listings here right now (not sales)? A rising rental-DOM trend means longer vacancies and softer asking-rent achievability than the comps imply.
- What's the recent tenant-quality profile in this submarket — average credit score on applications, eviction rate, late-payment / NSF rate, and stable-employment percentage? A property-management company in the area should have these aggregated.
- How much new for-sale + rental construction is in the pipeline within 1–3 miles? Heavy new supply typically softens prices + rents 12–24 months out; constrained supply supports both.
Investment metrics
- 1% rule
- 1.00% ✓
- Cap rate
- 7.27%
- Cash-on-cash
- 3.49%
- DSCR
- 1.16
- GRM
- 8.3
CMA / ARV
- ARV (median comp)
- $172,568
- List price
- $169,900
- Delta
- -1.55%
- Verdict
- FAIR
- Comps
- 20 within 1.0 mi
Show comp detail 12 sales within ~0.75 mi
| Address | Dist | Beds/Ba | Sqft | Sold | Price | $/sf | Match |
|---|---|---|---|---|---|---|---|
| 16725 E Hammon | 0.13mi | 3/2.0 | 958 (0%) | 4mo | $169,900 | $177 | 90 |
| 16900 West Juneau | 0.25mi | 3/2.0 | 1,014 (+6%) | 1mo | $153,000 | $151 | 78 |
| 16891 W Dounreay St | 0.19mi | 3/2.0 | 1,030 (+8%) | 5mo | $161,900 | $157 | 75 |
| 16902 W Alderson | 0.17mi | 3/2.0 | 1,058 (+10%) | 2mo | $179,900 | $170 | 73 |
| 241 Ridgeside | 0.31mi | 3/2.0 | 1,012 (+6%) | 4mo | $160,000 | $158 | 73 |
| 16729 E Hammon | 0.13mi | 3/2.0 | 1,072 (+12%) | 4mo | $177,900 | $166 | 71 |
| 16930 W Lynbrook St | 0.33mi | 3/2.0 | 1,030 (+8%) | 5mo | $161,900 | $157 | 68 |
| 16965 W Hammon | 0.31mi | 3/2.0 | 1,065 (+11%) | 1mo | $180,000 | $169 | 66 |
| 846 Omeara | 0.33mi | 3/2.0 | 1,095 (+14%) | 2mo | $170,000 | $155 | 59 |
| 822 Omeara | 0.30mi | 2/2.0 (-1) | 837 (-13%) | 3mo | $156,900 | $187 | 58 |
| 16942 W Lynbrook St | 0.35mi | 2/2.0 (-1) | 830 (-13%) | 2mo | $137,900 | $166 | 55 |
| 16934 W Lynbrook St | 0.34mi | 2/2.0 (-1) | 830 (-13%) | 4mo | $140,000 | $169 | 53 |
Match score weights: distance 35% · size 25% · config 20% · recency 20%. Top-matched comps best support the ARV.
Projected returns pro-forma
-3.0% appreciation · 0.4% rent growth · sell at horizon
- IRR
- -13.8%
- Equity multiple
- 0.52×
- Total profit
- $-23,373
- Equity at exit
- $25,730
- IRR
- -9.9%
- Equity multiple
- 0.47×
- Total profit
- $-25,805
- Equity at exit
- $14,921
Cash invested: $48,319 (down + closing). Projections, not guarantees.
Landlord ↔ Tenant lean methodology
- Overall (STATE)
- 87 Strongly Landlord-Friendly
- State Texas
- 87 Strongly Landlord-Friendly · R+5
- County
- — inherits STATE
- City
- — inherits STATE
ZIP-level market 77316
- Home prices YoY
- -10.7%
- Rents YoY
- 0.4%
- Active inventory
- 2283
- Price-to-rent
- 8.2×
Monthly cashflow live
- Estimated rent
- $1,728 medium interval (Pro) →
- Mortgage (P&I)
- −$905
- Tax est. 1.5%
- −$216 /mo · $2,589/yr
- Insurance
- −$72
- HOA
- −$32
- Vacancy / Maint / Mgmt
- −$363
- Net cashflow
- $141
Break-even live
UW: 25.0% down · 7.5% · 30yr · 1.5% tax · 5.0% vac · 8.0% maint · 8.0% mgmt
Financing live
Cash to close
- Down payment
- $43,142
- Closing costs
- $5,177
- Reserves months
- —
- Total cash needed
- —
Loan-product check · same deal, 3 products live
Conventional
25% down · 7.5% · 30yr
- Down + closing
- —
- Monthly P&I
- —
- Monthly cashflow
- —
- DSCR
- —
- Eligible?
- —
Personal DTI + credit; lowest rate.
DSCR
20% down · 8.5% · 30yr
- Down + closing
- —
- Monthly P&I
- —
- Monthly cashflow
- —
- DSCR
- —
- Eligible?
- —
No personal income docs; deal must DSCR.
Hard money
10% down · 12.0% · 12mo
- Down + closing
- —
- Monthly P&I
- —
- Monthly cashflow
- —
- DSCR
- —
- Eligible?
- —
Short-term bridge; refi at stabilization.
Rent comps 4 comps
| Address | Beds | Baths | Sqft | Rent | $/sqft | DOM | Units | Dist |
|---|---|---|---|---|---|---|---|---|
| 16928 Kempwood Montgomery, TX | 3.0 | 2.0 | 1100 | $1,450 | $1.32 | 43d | 1 | 0.34mi |
| 16967 W Ivanhoe Montgomery, TX | 3.0 | 2.0 | 1012 | $1,350 | $1.33 | 12d | 1 | 0.36mi |
| 298 Capetown Way Unit A Montgomery, TX | 2.0 | 1.5 | 1100 | $1,400 | $1.27 | 43d | 1 | 0.71mi |
| 1050 S Pine Lake Rd Montgomery, TX | 2.0 | 2.0 | 1052 | $1,845 | $1.75 | 24d | 1 | 0.76mi |
HOA detail
- Monthly dues
- $32 · $384/yr
Listing history 15 events
-
2026-06-18days on market $169,900 Active 107 DOM
-
2026-06-17days on market $169,900 Active 106 DOM
-
2026-06-16days on market $169,900 Active 105 DOM
-
2026-06-15days on market $169,900 Active 104 DOM
-
2026-06-13days on market $169,900 Active 102 DOM
-
2026-06-13days on market $169,900 Active 101 DOM
-
2026-06-09days on market $169,900 Active 98 DOM
-
2026-06-08days on market $169,900 Active 97 DOM
-
2026-06-07days on market $169,900 Active 96 DOM
-
2026-06-04days on market $169,900 Active 93 DOM
-
2026-06-03days on market $169,900 Active 92 DOM
-
2026-06-02days on market $169,900 Active 91 DOM
-
2026-06-01days on market $169,900 Active 90 DOM
-
2026-05-31days on market $169,900 Active 89 DOM
-
2026-03-03$169,900 Active 239-char remark
Show marketing remark (239 chars)
Do Not Miss The Elvis, a stunning, modern 1 story, 3-bedroom, 2-bathroom home designed to turn heads. Inside, the open-concept layout offers effortless flow between the living area, dining space, and a sleek, thoughtfully designed kitchen.
ⓘ Source: listings_history table (triggers on properties + properties_extension) + one-shot
backfill from property_details.listing_events for pre-trigger history.
Climate risk First Street
- Flood 1/10 Low FEMA zone X (unshaded) · 0% chance over 30 yrs
- Wildfire 4/10 Moderate
- Heat 8/10 Severe 7 d/yr ≥110°F today · 24 d/yr by 30 yrs out
- Wind 8/10 Severe 99% chance of damaging wind over 30 yrs
- Air quality 2/10 Low 1 unhealthy d/yr today · 1 by 30 yrs out
Nearby sold comps map
Loading sold comps map…
Walkable amenities ~0.75 mi
Loading nearby amenities…
Taxation est. · year 1
- Rental income
- $20,736
- − Mortgage interest
- −$9,666
- − Property taxes
- −$2,589
- − Insurance
- −$863
- − Repairs & maintenance
- −$1,659
- − Management
- −$1,659
- − HOA
- −$384
- − Depreciation
- −$5,020
- Taxable loss
- −$1,104
- Est. tax savings @ 24.0%
- +$265
- After-tax cash flow
- $1,951/yr
For passive investors: Depreciation is non-cash, so a rental often shows a tax loss while cash-flowing — sheltering income. Rental losses are passive: they offset passive income freely, and up to $25,000/yr can offset ordinary (W-2) income if you actively participate and your MAGI is under $100k (phasing out to $0 by $150k); unused losses carry forward. On sale, claimed depreciation is recaptured at up to 25%, and gains may owe capital-gains tax (a 1031 exchange can defer both). Figures are a year-1 estimate at your 24.0% rate — not tax advice; consult a CPA.
Condition & rehab AI · 2 photos
This modern, single-story home is in excellent condition with a good curb appeal and well-maintained interior. It offers a good return on investment with minor updates that can significantly enhance its resale and rental value.
Value-add opportunities
- Both Painting the exterior and interior — Fresh paint can enhance curb appeal and interior aesthetics.
- Both Landscaping improvements — Enhanced landscaping can improve curb appeal and attract potential buyers/tenants.
- Resale Kitchen updates — Modern kitchen appliances and fixtures can increase the home's appeal to buyers.
- Rental Home office organization — A well-organized home office can attract tenants looking for a professional space.
Renovation cost estimate screening
Value-add ROI direction
- Both Painting the exterior and interior — Fresh paint can enhance curb appeal and interior aesthetics. ↑
- Both Landscaping improvements — Enhanced landscaping can improve curb appeal and attract potential buyers/tenants. ↑
- Resale Kitchen updates — Modern kitchen appliances and fixtures can increase the home's appeal to buyers. ↑
- Rental Home office organization — A well-organized home office can attract tenants looking for a professional space. ↑
ⓘ Cost ranges are severity-bucket heuristics (US national rule-of-thumb). Get contractor quotes + a written scope before underwriting a rehab budget.
Schools (NCES district)
- District
- Montgomery ISD
- NCES district ID
- 4831260
- Math proficiency
- 63% ▼ -3.00%
- Reading proficiency
- 57% ▼ -3.00%
- Median HH income
- $75,596
- Composite
- 53.55/100
- National rank
- #1445
- State rank
- #49 of 826 in TX
Livability — Conroe
- Score
- 74/100
- State rank
- #169
- US rank
- #4447
Category grades
Schools grade is shown separately in the Schools card above.
Census & demographics
- County
- Montgomery County · 663,713 people
- City population
- 205,417
- Metro
- Houston-The Woodlands-Sugar Land, TX
- Population (ZIP)
- 34,694
- Household income
- $124,055
- Rent vs Own
- Severe rent burden
- 273.0
Population outlook (Montgomery County) Hauer SSP2
- Today (2025)
- 713,896 people
- By 2030
- 805,263 · +12.8%
- By 2040
- 992,708 · +39.1%
- By 2050
- 1,179,590 · +65.2%
- By 2075
- 1,628,084 · +128.1%
- By 2100
- 1,937,880 · +171.5%
Race, ethnicity, and origin ACS 2023
- Neighborhood character
- Predominantly White (80%)
- Race & ethnicity
- White 80% Hispanic / Latino 14% Two or more races 11% Black 1% Asian 1%
- Hispanic origin (detail)
- Mexican 9%
- Common ancestry
- Lithuanian 6% Slovak 3% Romanian 3%
- Foreign-born
- 6% · Canada
- Languages at home
- 90% English-only · Spanish 8%
Political lean MEDSL · Montgomery
- 2024 margin
- Solid R (+45.5) · D 26.8% · R 72.3%
- 2008→2024 swing
- +7.2pp toward D · 2008: -52.7pp · 2024: -45.5pp
- All cycles
- 2024: R+45.5 2020: R+43.8 2016: R+51.4 2012: R+60.7 2008: R+52.7
Not yet ingested
- Civics
- —
Market trends
- HPI YoY
- ▼ -31.44%
- Current HPI
- 262.6973
- Rent YoY
- ▲ 0.40%
- Metro
- Houston-The Woodlands-Sugar Land, TX
- State GDP YoY
- ▲ 3.95%
- F500 in state
- 110
Industry mix (Fortune 500 HQ in TX)
| Industry | F500 HQs | Revenue |
|---|---|---|
| Energy | 16 | $1,198B |
|
||
| Technology | 5 | $198B |
|
||
| Engineering / Construction | 4 | $72B |
|
||
| Energy Services | 3 | $60B |
|
||
| Utilities | 3 | $41B |
|
||
| Healthcare | 2 | $330B |
|
||
Price history
1 event — show timeline
- 2026-03-03 Listed $169,900 Zillow
Cash-flow waterfall
monthlySold comps — $/sqft
last 12 mo · ≤1 miLoading sold comps…