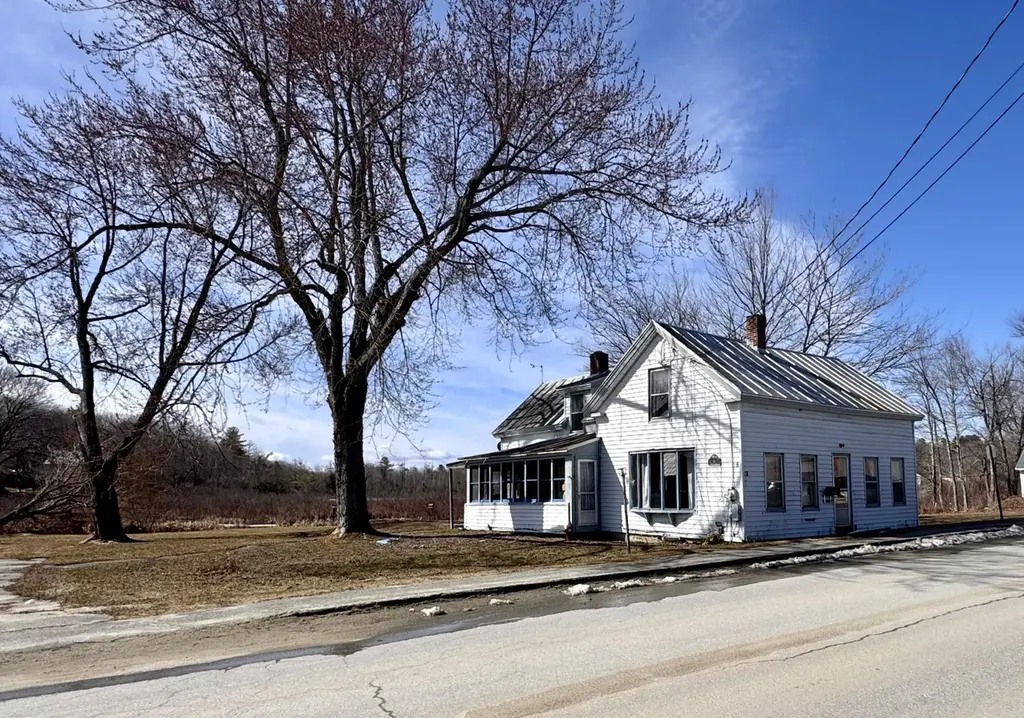
16 Heath St · Oakland, ME
Flood risk No data
- FEMA flood zone
- —
- Chance of flooding over 30 yrs
- —
- Est. flood insurance / yr
- —
Fire risk No data
- Est. fire insurance / yr
- —
Heat risk No data
- Hot days now (above threshold)
- —
- Hot days in 30 yrs
- —
Wind risk No data
- Chance of severe wind over 30 yrs
- —
Air-quality risk No data
- Unhealthy air days now
- —
- Unhealthy air days in 30 yrs
- —
Risk factors via First Street. Map © Google.
Why this score? — see what drove the A grade
The composite is a weighted blend of 9 inputs, each scored 0–100. Each bar is that input's sub-score; the figure is the points it added to the 100-point composite (weight × sub-score).
- Cash flow +27.5/30.0
- ARV discount +15.0/15.0
- Appreciation +10.0/10.0
- DSCR +9.6/10.0
- Schools +7.5/10.0
- 1% rule +6.9/10.0
- Livability +3.8/5.0
- Rent growth +2.5/5.0
- Condition / age +2.5/5.0
$150,000
🖨 Deal sheet (PDF) 📄 Offer letter ✓ Due diligence
Listing remarks MLS
This in town Oakland home is in a convenient location and just in need of some TLC. Within walking distance to downtown Oakland and the schools. Double lot with plenty of outside space.
Key facts
- Double lot
- Convenient location
- 0.69 acre lot
Tags
Neighborhood map
What this means for you Summary
Snapshot
- This is a 3-bed/1.0-bath single-family listed at $150k.
Deal economics
- At list price, monthly cash flow is $443 ($5k/yr) — positive.
- The deal already cash-flows at list — no discount required.
- Meets the 1% rule at list price ($2k rent vs $150k).
- Recommended offer: $146k (3.0% below list) — sets the bar for market timing.
- Cap rate 9.8% vs local median 1.8% in Oakland — top-decile yield for the area; either an underpriced asset or a hidden risk that comps aren't pricing in. Stress-test before assuming the spread holds.
Location & tenants
- Location reads 75/100 on livability (#37 in ME, #3,871 nationally) — a middle-class / working-renter tenant base. Strengths: crime A+, cost of living A+, housing A+; Watch: schools C-, employment D+, amenities F.
- RSU 18 (rural): math 88% / reading 89% proficiency, ranked #36 of 112 in ME (top 32%) — strong family-tenant draw, lease renewals of 3-5y typical.
- Market conditions: 72 active listings in the ZIP; 460 units permitted in Kennebec County in 2024 (0 in 5+ unit buildings).
Forward outlook
- In year one you build about $16k of equity ($1k loan paydown + $15k appreciation (10.0% local appreciation)).
- Kennebec County population projected at -17% by 2050 — secular population decline; favor cash flow + early exit over multi-decade hold.
- At projected returns (10.0% appreciation + 3.0% rent growth), your $42k cash investment doubles in ~2 years — after that, you're playing with house money.
- By year 3, paydown + projected appreciation supports a ~$41k cash-out refi (75% LTV) — recoverable capital for the next deal without selling this one.
Negotiation context
- It's been on market 56 days — a 3% lower offer ($146k) is reasonable based on typical stale-listing flexibility.
Risks & watch-outs
- Watch-outs: built in 1940 — expect roof / HVAC / electrical / plumbing capex.
Questions for the listing agent
- It's been on market 56 days. Have you received any prior offers? Is the seller open to a 3% concession, seller financing, or rate buy-down credit?
- Built in 1940 — when were the roof, HVAC, electrical panel, plumbing, and water heater last replaced?
- Is there a deadline driving the sale (1031 exchange, divorce, estate, relocation)? That informs how much negotiation room exists.
- What's the average days-on-market for RENTAL listings here right now (not sales)? A rising rental-DOM trend means longer vacancies and softer asking-rent achievability than the comps imply.
- What's the recent tenant-quality profile in this submarket — average credit score on applications, eviction rate, late-payment / NSF rate, and stable-employment percentage? A property-management company in the area should have these aggregated.
- How much new for-sale + rental construction is in the pipeline within 1–3 miles? Heavy new supply typically softens prices + rents 12–24 months out; constrained supply supports both.
Investment metrics
- 1% rule
- 1.19% ✓
- Cap rate
- 9.84%
- Cash-on-cash
- 12.66%
- DSCR
- 1.56
- GRM
- 7.0
CMA / ARV
- ARV (median comp)
- $213,323
- List price
- $150,000
- Delta
- -29.68%
- Verdict
- UNDERPRICED
- Comps
- 20 within 1.0 mi
Show comp detail 8 sales within ~0.75 mi
| Address | Dist | Beds/Ba | Sqft | Sold | Price | $/sf | Match |
|---|---|---|---|---|---|---|---|
| 66 Summer St | 0.59mi | 3/1.0 | 1,372 (-4%) | 2mo | $200,000 | $146 | 64 |
| 27 Water St | 0.29mi | 3/1.5 | 1,277 (-11%) | 8mo | $199,500 | $156 | 60 |
| 103 S Alpine St | 0.51mi | 3/1.5 | 1,348 (-6%) | 8mo | $150,000 | $111 | 58 |
| 51 Old Belgrade Ave | 0.70mi | 3/1.5 | 1,406 (-2%) | 11mo | $240,000 | $171 | 53 |
| 32 Selden Ln | 0.73mi | 3/2.0 | 1,344 (-6%) | 4mo | $358,000 | $266 | 48 |
| 9 Bacon St | 0.47mi | 2/1.0 (-1) | 1,502 (+5%) | 22mo | $290,000 | $193 | 47 |
| 155 Oak St | 0.69mi | 2/2.0 (-1) | 1,480 (+3%) | 10mo | $262,000 | $177 | 45 |
| 105 S Alpine St | 0.52mi | 2/1.5 (-1) | 1,242 (-13%) | 5mo | $190,000 | $153 | 43 |
Match score weights: distance 35% · size 25% · config 20% · recency 20%. Top-matched comps best support the ARV.
Projected returns pro-forma
10.0% appreciation · 3.0% rent growth · sell at horizon
- IRR
- 33.6%
- Equity multiple
- 3.62×
- Total profit
- $109,885
- Equity at exit
- $135,132
- IRR
- 28.9%
- Equity multiple
- 8.18×
- Total profit
- $301,371
- Equity at exit
- $291,417
Cash invested: $42,000 (down + closing). Projections, not guarantees.
Landlord ↔ Tenant lean methodology
- Overall (STATE)
- 41 Moderately Tenant-Leaning
- State Maine
- 41 Moderately Tenant-Leaning · D+2
- County
- — inherits STATE
- City
- — inherits STATE
ZIP-level market 04963
- Home prices YoY
- 25.1%
- Active inventory
- 72
- Price-to-rent
- 7.0×
Monthly cashflow live
- Estimated rent
- $1,778 medium interval (Pro) →
- Mortgage (P&I)
- −$787
- Tax from tax record
- −$113 /mo · $1,353/yr
- Insurance
- −$62
- HOA
- −$0
- Vacancy / Maint / Mgmt
- −$373
- Net cashflow
- $443
Break-even live
Sensitivity live
| Price | -10% $528 | -5% $485 | +0% $443 | +5% $400 | +10% $358 |
|---|---|---|---|---|---|
| Rent | -10% $302 | -5% $373 | +0% $443 | +5% $513 | +10% $583 |
| Rate | -1.0pp $518 | -0.5pp $481 | base $443 | +0.5pp $404 | +1.0pp $365 |
UW: 25.0% down · 7.5% · 30yr · 1.5% tax · 5.0% vac · 8.0% maint · 8.0% mgmt
Financing live
Cash to close
- Down payment
- $37,500
- Closing costs
- $4,500
- Reserves months
- —
- Total cash needed
- —
Loan-product check · same deal, 3 products live
Conventional
25% down · 7.5% · 30yr
- Down + closing
- —
- Monthly P&I
- —
- Monthly cashflow
- —
- DSCR
- —
- Eligible?
- —
Personal DTI + credit; lowest rate.
DSCR
20% down · 8.5% · 30yr
- Down + closing
- —
- Monthly P&I
- —
- Monthly cashflow
- —
- DSCR
- —
- Eligible?
- —
No personal income docs; deal must DSCR.
Hard money
10% down · 12.0% · 12mo
- Down + closing
- —
- Monthly P&I
- —
- Monthly cashflow
- —
- DSCR
- —
- Eligible?
- —
Short-term bridge; refi at stabilization.
Listing history 3 events
-
2026-05-06historical Active Under Contract 185-char remark
Show marketing remark (185 chars)
This in town Oakland home is in a convenient location and just in need of some TLC. Within walking distance to downtown Oakland and the schools. Double lot with plenty of outside space.
-
2026-04-01$150,000 Active 185-char remark
Show marketing remark (185 chars)
This in town Oakland home is in a convenient location and just in need of some TLC. Within walking distance to downtown Oakland and the schools. Double lot with plenty of outside space.
-
2025-04-25price $299,000
ⓘ Source: listings_history table (triggers on properties + properties_extension) + one-shot
backfill from property_details.listing_events for pre-trigger history.
Tax reassessment forecast ME · Partial reset (capped growth)
- Current annual tax
- $1,353 · $113/mo
- Projected year-2 tax
- $1,696 · $141/mo
- Expected delta
- +$344/yr (+$29/mo · 25.4%)
ⓘ Screening estimate from a state-policy table — verify with the county assessor before closing.
Nearby sold comps map
Loading sold comps map…
Walkable amenities ~0.75 mi
Loading nearby amenities…
Taxation est. · year 1
- Rental income
- $21,339
- − Mortgage interest
- −$8,402
- − Property taxes
- −$1,353
- − Insurance
- −$750
- − Repairs & maintenance
- −$1,707
- − Management
- −$1,707
- − Depreciation
- −$4,364
- Taxable income
- $3,055
- Est. tax owed @ 24.0%
- −$733
- After-tax cash flow
- $4,582/yr
For passive investors: Depreciation is non-cash, so a rental often shows a tax loss while cash-flowing — sheltering income. Rental losses are passive: they offset passive income freely, and up to $25,000/yr can offset ordinary (W-2) income if you actively participate and your MAGI is under $100k (phasing out to $0 by $150k); unused losses carry forward. On sale, claimed depreciation is recaptured at up to 25%, and gains may owe capital-gains tax (a 1031 exchange can defer both). Figures are a year-1 estimate at your 24.0% rate — not tax advice; consult a CPA.
Schools (NCES district)
- District
- RSU 18
- NCES district ID
- 2314779
- Math proficiency
- 88% ▲ 53.00%
- Reading proficiency
- 89% ▲ 32.00%
- Median HH income
- $55,125
- Composite
- 75.2/100
- National rank
- #139
- State rank
- #36 of 112 in ME
Livability — Oakland
- Score
- 75/100
- State rank
- #37
- US rank
- #3871
Category grades
Schools grade is shown separately in the Schools card above.
Census & demographics
- Census place
- Oakland, ME
- Population (ZIP)
- 7,375
Population outlook (Kennebec County) Hauer SSP2
- Today (2025)
- 115,421 people
- By 2030
- 111,852 · -3.1%
- By 2040
- 103,757 · -10.1%
- By 2050
- 95,710 · -17.1%
- By 2075
- 78,172 · -32.3%
- By 2100
- 59,500 · -48.4%
Race, ethnicity, and origin ACS 2023
- Neighborhood character
- Predominantly White (94%)
- Race & ethnicity
- White 94% Two or more races 5% Asian 1%
- Common ancestry
- Lithuanian 14% Slovak 4% Romanian 2%
- Foreign-born
- 2% · Canada
- Languages at home
- 96% English-only · French/Haitian/Cajun 3% Spanish 1% Other Indo-European 1%
Political lean MEDSL · Kennebec
- 2024 margin
- Toss-up / Even · D 47.5% · R 50.2% · Other 2.4%
- 2008→2024 swing
- -17.5pp toward R · 2008: 14.8pp · 2024: -2.8pp
- All cycles
- 2024: R+2.8 2020: D+0.2 2016: R+3.7 2012: D+13.5 2008: D+14.8
Not yet ingested
- Civics
- —
Market trends
- HPI YoY
- ▲ 76.94%
- Current HPI
- 383.7687
- Rent YoY
- —
- Metro
- —
- State GDP YoY
- —
- F500 in state
- 0
Price history
-49.8% since first listed3 events — show timeline
- 2026-05-06 Contingent — MREIS
- 2026-04-01 Listed $150,000 MREIS
- 2025-04-25 Price Changed $299,000 MREIS
Property tax history
+3.8%/yrLatest (2025): $1,353 · +6.9% YoY. Source: county tax records.
Cash-flow waterfall
monthlySold comps — $/sqft
last 12 mo · ≤1 miLoading sold comps…