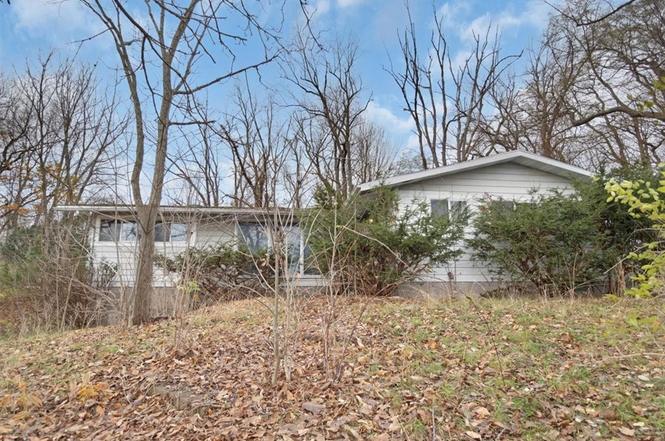
3041 Rt-350 Rd · Gananda, NY
Flood risk 1/10 · Minimal
- FEMA flood zone
- —
- Chance of flooding over 30 yrs
- 0.0%
- Est. flood insurance / yr
- —
Fire risk 2/10 · Minimal
- Est. fire insurance / yr
- $691 – $1,283
Heat risk 2/10 · Minimal
- Hot days now (above 95°F)
- 7 days/yr
- Hot days in 30 yrs
- 16 days/yr
Wind risk 1/10 · Minimal
- Chance of severe wind over 30 yrs
- —
Air-quality risk 2/10 · Minimal
- Unhealthy air days now
- 1 days/yr
- Unhealthy air days in 30 yrs
- 1 days/yr
Risk factors via First Street. Map © Google.
Why this score? — see what drove the B- grade
The composite is a weighted blend of 9 inputs, each scored 0–100. Each bar is that input's sub-score; the figure is the points it added to the 100-point composite (weight × sub-score).
- Cash flow +30.0/30.0
- 1% rule +10.0/10.0
- DSCR +10.0/10.0
- ARV discount +7.5/15.0
- Schools +4.4/10.0
- Rent growth +2.5/5.0
- Livability +2.5/5.0
- Condition / age +2.5/5.0
- Appreciation +0.0/10.0
$99,900
🖨 Deal sheet 📄 Offer letter ✓ Due diligence
Listing remarks
Welcome to this 3-bedroom, 2-bath ranch home located in the Town of Macedon, within the highly regarded Gananda School District. Sitting on a peaceful setting and just minutes from local conveniences, this property offers a great opportunity for someone ready to make it their own. This ranch features a desirable layout, including a spacious two-car attached garage and a walk-out basement—perfect for additional living space or storage. A major upgrade has already been completed with geothermal heating installed in 2019, offering efficient and eco-friendly climate control. Home also offers 400 amo electrical service. Many of the windows are also newer. The home will require significant
Key facts
- Walk-out basement
- Newer windows
- Geothermal heating
Tags
Neighborhood map
What this means for you Summary
Snapshot
- This is a 3-bed/2.0-bath single-family listed at $100k.
Deal economics
- At list price, monthly cash flow is $970 ($12k/yr) — positive.
- The deal already cash-flows at list — no discount required.
- Meets the 1% rule at list price ($2k rent vs $100k).
- Recommended offer: $98k (1.5% below list) — sets the bar for market timing.
- Cap rate 17.9% vs local median 3.2% in Gananda — top-decile yield for the area; either an underpriced asset or a hidden risk that comps aren't pricing in. Stress-test before assuming the spread holds.
Location & tenants
- Location reads: area grade B — affects rentability + tenant quality, not the cash-flow math above.
- Gananda Central School District (rural): math 43% / reading 56% proficiency, ranked #357 of 590 in NY (top 60%) — families likely to look elsewhere, expect single-tenant / working-renter base with shorter leases; only 18% free/reduced lunch — higher-income household profile.
- Market conditions: 49 active listings in the ZIP; 259 units permitted in Wayne County in 2024 (90 in 5+ unit buildings).
Forward outlook
- Local home prices are declining (-3.0%/yr); year-one equity from $691 of loan paydown is wiped out by about $3k of value loss. Plan a longer hold.
- Wayne County population projected at -24% by 2050 — secular population decline; favor cash flow + early exit over multi-decade hold.
- At projected returns (-3.0% appreciation + 3.0% rent growth), your $28k cash investment doubles in ~3 years — after that, you're playing with house money.
Negotiation context
- It's been on market 30 days — a 2% lower offer ($98k) is reasonable based on typical stale-listing flexibility.
Risks & watch-outs
- Watch-outs: built in 1958 — expect roof / HVAC / electrical / plumbing capex.
Questions for the listing agent
- Built in 1958 — when were the roof, HVAC, electrical panel, plumbing, and water heater last replaced?
- Is there a deadline driving the sale (1031 exchange, divorce, estate, relocation)? That informs how much negotiation room exists.
- What's the average days-on-market for RENTAL listings here right now (not sales)? A rising rental-DOM trend means longer vacancies and softer asking-rent achievability than the comps imply.
- What's the recent tenant-quality profile in this submarket — average credit score on applications, eviction rate, late-payment / NSF rate, and stable-employment percentage? A property-management company in the area should have these aggregated.
- How much new for-sale + rental construction is in the pipeline within 1–3 miles? Heavy new supply typically softens prices + rents 12–24 months out; constrained supply supports both.
Investment metrics
- 1% rule
- 2.10% ✓
- Cap rate
- 17.94%
- Cash-on-cash
- 41.61%
- DSCR
- 2.85
- GRM
- 4.0
CMA / ARV
- ARV (on-the-fly)
- $284,435
- Comps found
- 10
Show comp detail 10 sales within ~0.75 mi
| Address | Dist | Beds/Ba | Sqft | Sold | Price | $/sf | Match |
|---|---|---|---|---|---|---|---|
| 3237 Pine View Dr | 0.40mi | 4/2.0 (+1) | 1,768 (+1%) | 8mo | $238,000 | $135 | 67 |
| 3249 Green Tree Dr | 0.47mi | 3/1.5 | 1,576 (-10%) | 1mo | $300,000 | $190 | 59 |
| 2889 Ontario Center Rd | 0.33mi | 3/2.5 | 1,500 (-14%) | 7mo | $397,200 | $265 | 53 |
| 3253 Woodfield Dr | 0.56mi | 4/2.5 (+1) | 1,818 (+4%) | 10mo | $285,000 | $157 | 52 |
| 3245 Pineview Dr | 0.45mi | 4/2.5 (+1) | 1,918 (+10%) | 9mo | $312,500 | $163 | 48 |
| 3247 Green Tree Dr | 0.46mi | 4/2.0 (+1) | 1,974 (+13%) | 9mo | $267,500 | $136 | 44 |
| 3342 Evergreen Cir | 0.71mi | 3/2.0 | 1,808 (+4%) | 21mo | $300,000 | $166 | 43 |
| 3338 Evergreen Cir | 0.69mi | 4/2.0 (+1) | 1,812 (+4%) | 18mo | $280,000 | $155 | 42 |
| 3259 Green Tree Dr | 0.54mi | 4/2.5 (+1) | 1,832 (+5%) | 23mo | $315,000 | $172 | 41 |
| 1600 Waterford Rd | 0.63mi | 3/1.0 | 1,568 (-10%) | 21mo | $185,000 | $118 | 32 |
Match score weights: distance 35% · size 25% · config 20% · recency 20%. Top-matched comps best support the ARV.
Projected returns pro-forma
-3.0% appreciation · 3.0% rent growth · sell at horizon
- IRR
- 38.2%
- Equity multiple
- 2.63×
- Total profit
- $45,612
- Equity at exit
- $14,895
- IRR
- 44.7%
- Equity multiple
- 5.27×
- Total profit
- $119,384
- Equity at exit
- $8,638
Cash invested: $27,972 (down + closing). Projections, not guarantees.
Landlord ↔ Tenant lean methodology
- Overall (STATE)
- 15 Strongly Tenant-Friendly
- State New York
- 15 Strongly Tenant-Friendly · D+10
- County
- — inherits STATE
- City
- — inherits STATE
ZIP-level market 14502
- Home prices YoY
- -26.0%
- Active inventory
- 49
- Price-to-rent
- 4.0×
Monthly cashflow live
- Estimated rent
- $2,102 medium interval (Pro) →
- Mortgage (P&I)
- −$524
- Tax est. 1.5%
- −$125 /mo · $1,498/yr
- Insurance
- −$42
- HOA
- −$0
- Vacancy / Maint / Mgmt
- −$441
- Net cashflow
- $970
Break-even live
UW: 25.0% down · 7.5% · 30yr · 1.5% tax · 5.0% vac · 8.0% maint · 8.0% mgmt
Financing live
Cash to close
- Down payment
- $24,975
- Closing costs
- $2,997
- Reserves months
- —
- Total cash needed
- —
Loan-product check · same deal, 3 products live
Conventional
25% down · 7.5% · 30yr
- Down + closing
- —
- Monthly P&I
- —
- Monthly cashflow
- —
- DSCR
- —
- Eligible?
- —
Personal DTI + credit; lowest rate.
DSCR
20% down · 8.5% · 30yr
- Down + closing
- —
- Monthly P&I
- —
- Monthly cashflow
- —
- DSCR
- —
- Eligible?
- —
No personal income docs; deal must DSCR.
Hard money
10% down · 12.0% · 12mo
- Down + closing
- —
- Monthly P&I
- —
- Monthly cashflow
- —
- DSCR
- —
- Eligible?
- —
Short-term bridge; refi at stabilization.
Listing history 3 events
-
2025-12-20status Pending
-
2025-12-04historical Active Under Contract
-
2025-11-18$99,900 Active
ⓘ Source: listings_history table (triggers on properties + properties_extension) + one-shot
backfill from property_details.listing_events for pre-trigger history.
Climate risk First Street
- Flood 1/10 Low 0% chance over 30 yrs
- Wildfire 2/10 Low
- Heat 2/10 Low 7 d/yr ≥95°F today · 16 d/yr by 30 yrs out
- Wind 1/10 Low
- Air quality 2/10 Low 1 unhealthy d/yr today · 1 by 30 yrs out
Nearby sold comps map
Loading sold comps map…
Walkable amenities ~0.75 mi
Loading nearby amenities…
Taxation est. · year 1
- Rental income
- $25,218
- − Mortgage interest
- −$5,596
- − Property taxes
- −$1,498
- − Insurance
- −$500
- − Repairs & maintenance
- −$2,017
- − Management
- −$2,017
- − Depreciation
- −$2,906
- Taxable income
- $10,683
- Est. tax owed @ 24.0%
- −$2,564
- After-tax cash flow
- $9,074/yr
For passive investors: Depreciation is non-cash, so a rental often shows a tax loss while cash-flowing — sheltering income. Rental losses are passive: they offset passive income freely, and up to $25,000/yr can offset ordinary (W-2) income if you actively participate and your MAGI is under $100k (phasing out to $0 by $150k); unused losses carry forward. On sale, claimed depreciation is recaptured at up to 25%, and gains may owe capital-gains tax (a 1031 exchange can defer both). Figures are a year-1 estimate at your 24.0% rate — not tax advice; consult a CPA.
Schools (NCES district)
- District
- Gananda Central School District
- NCES district ID
- 3611740
- Math proficiency
- 43% ▼ -8.00%
- Reading proficiency
- 56% ▲ 9.00%
- Median HH income
- $69,406
- Composite
- 44.17/100
- National rank
- #2857
- State rank
- #357 of 590 in NY
Livability — Gananda
No livability data for this city. (Only ~50 U.S. cities are tracked.)
Census & demographics
- Population (ZIP)
- 10,515
Population outlook (Wayne County) Hauer SSP2
- Today (2025)
- 85,662 people
- By 2030
- 81,945 · -4.3%
- By 2040
- 73,735 · -13.9%
- By 2050
- 65,029 · -24.1%
- By 2075
- 47,451 · -44.6%
- By 2100
- 31,574 · -63.1%
Race, ethnicity, and origin ACS 2023
- Neighborhood character
- Predominantly White (88%)
- Race & ethnicity
- White 88% Two or more races 6% Asian 3% Black 1% Hispanic / Latino 1%
- Common ancestry
- Iranian 8% Romanian 7% Lithuanian 3%
- Foreign-born
- 4% · China, South Korea
- Languages at home
- 94% English-only · Russian/Polish/Slavic 2% Other Indo-European 2% Chinese 1%
Political lean MEDSL · Wayne
- 2024 margin
- Strong R (+23.1) · D 38.5% · R 61.5%
- 2008→2024 swing
- -13.2pp toward R · 2008: -9.9pp · 2024: -23.1pp
- All cycles
- 2024: R+23.1 2020: R+19.6 2016: R+26.1 2012: R+9.3 2008: R+9.9
Not yet ingested
- Civics
- —
Market trends
- HPI YoY
- ▼ -85.25%
- Current HPI
- 242.5682
- Rent YoY
- —
- Metro
- —
- State GDP YoY
- ▲ 2.60%
- F500 in state
- 92
Industry mix (Fortune 500 HQ in NY)
| Industry | F500 HQs | Revenue |
|---|---|---|
| Financial Services | 10 | $950B |
|
||
| Consumer Goods | 9 | $162B |
|
||
| Insurance | 4 | $225B |
|
||
| Telecommunications | 2 | $144B |
|
||
| Pharmaceuticals | 2 | $112B |
|
||
| Media / Entertainment | 2 | $69B |
|
||
Price history
3 events — show timeline
- 2025-12-20 Pending — UNYREIS
- 2025-12-04 Contingent — UNYREIS
- 2025-11-18 Listed $99,900 UNYREIS
Cash-flow waterfall
monthlySold comps — $/sqft
last 12 mo · ≤1 miLoading sold comps…