 Duplex
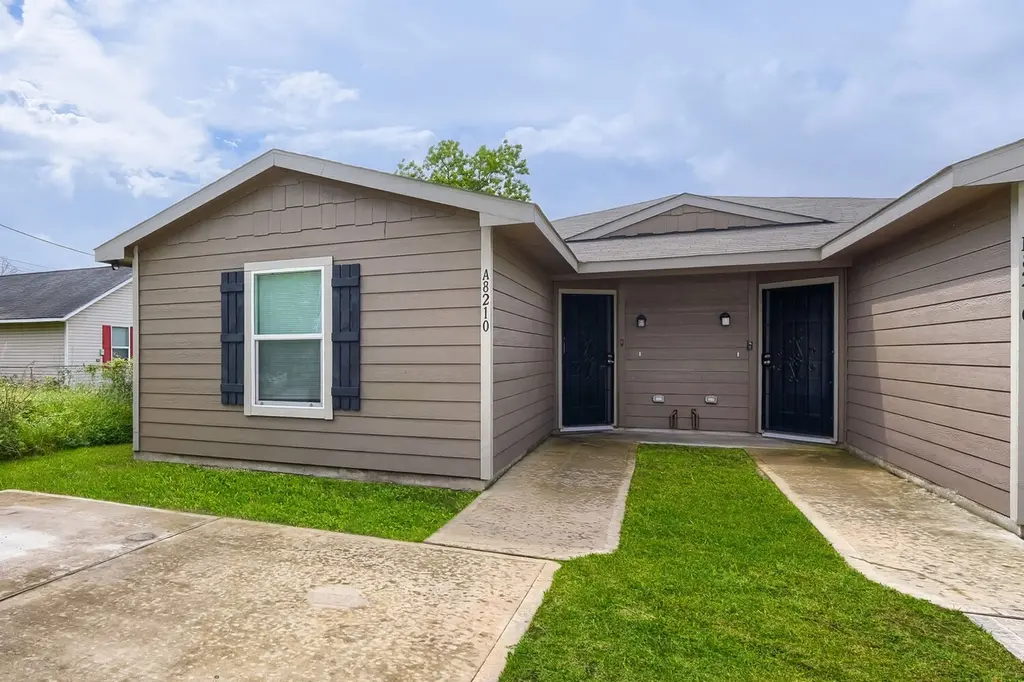
8210 Hanna St Unit A-B · Houston, TX
Flood risk 6/10 · Moderate
- FEMA flood zone
- X (unshaded)
- Chance of flooding over 30 yrs
- 0.68%
- Est. flood insurance / yr
- $507 – $1,088
Fire risk 2/10 · Minimal
- Est. fire insurance / yr
- $1,222 – $2,270
Heat risk 9/10 · Severe
- Hot days now (above 110°F)
- 7 days/yr
- Hot days in 30 yrs
- 24 days/yr
Wind risk 9/10 · Severe
- Chance of severe wind over 30 yrs
- 99.0%
Air-quality risk 3/10 · Minor
- Unhealthy air days now
- 2 days/yr
- Unhealthy air days in 30 yrs
- 3 days/yr
Risk factors via First Street. Map © Google.
Why this score? — see what drove the C+ grade
The composite is a weighted blend of 9 inputs, each scored 0–100. Each bar is that input's sub-score; the figure is the points it added to the 100-point composite (weight × sub-score).
- Cash flow +19.2/30.0
- ARV discount +13.5/15.0
- Appreciation +7.6/10.0
- DSCR +6.1/10.0
- 1% rule +5.1/10.0
- Condition / age +4.0/5.0
- Livability +3.7/5.0
- Schools +2.7/10.0
- Rent growth +2.1/5.0
$334,900
🖨 Deal sheet (PDF) 📄 Offer letter ✓ Due diligence
Multi-family units
County records classify this as Multi-Family (2-4 Unit). Listing-text estimate: 2 units. confirmed
Listing remarks
Centrally located multi-family property with great income producing potential. Two units, both with 3 bedrooms and two bathrooms. Solid surface flooring throughout, open concept living, dining and kitchen areas, pantry closet, with utility space in the hallway. The kitchen offers a built-in microwave, dishwasher, refrigerator and stove. Unit A is vacant, and unit B is occupied, you could live in one unit while the other unit produces income
Key facts
- Open concept living
- Utility space
- Built-in microwave
Tags
Property features AI
Finance
- Financial info: Property used as residential income (multi-unit)
Exterior
- Utilities: Electric heating and cooling
- Home design: Residential income property; Built in 2023
- Construction: Built in 2023
- Exterior features: Lot approximately 6,499 square feet
Interior
- Bedrooms: Unit 1 has 3 bedrooms; Property has a total of 2 units
- Bathrooms: 4 full bathrooms (total)
- Heating & cooling: Central heating (electric); Central air conditioning (electric)
- Interior features: Property contains two separate units (duplex-style residential income)
Neighborhood map
What this means for you Summary
Snapshot
- This is a 2 × 3-bed/2.0-bath units multifamily listed at $335k. Condition is rated good.
Deal economics
- At list price, monthly cash flow is $361 ($4k/yr) — positive. Per door: $181/mo.
- The deal already cash-flows at list — no discount required.
- Meets the 1% rule at list price ($3k rent vs $335k).
- Recommended offer: $325k (3.0% below list) — sets the bar for market timing.
- Cap rate 7.6% vs local median 3.1% in Houston — top-decile yield for the area; either an underpriced asset or a hidden risk that comps aren't pricing in. Stress-test before assuming the spread holds.
Location & tenants
- Location reads 74/100 on livability (#184 in TX, #4,771 nationally) — a middle-class / working-renter tenant base. Strengths: amenities A+, cost of living A+, housing A+; Watch: crime F.
- Houston ISD (urban): math 27% / reading 35% proficiency, ranked #593 of 826 in TX (top 72%) — families likely to look elsewhere, expect single-tenant / working-renter base with shorter leases; 71% free/reduced lunch — lower-income household profile, screen leases tightly.
- Zoned schools: Key Middle (math 10% / reading 20%, grade F, #1,569 of 1,662 statewide, top 95%, 615 students, 100% FRL); Kashmere H S (math 14% / reading 22%, grade F, #1,445 of 1,632 statewide, top 89%, 725 students, 96% FRL) — zoned schools average 98% FRL vs 71% district-wide (27 pts higher); higher-poverty schools than district average — tighter screening recommended.
- Zoned-school proficiency averages 16% at this address vs 31% district-wide (-14 pts) — the specific schools serving this property underperform the Houston ISD average; the district grade overstates school quality for this exact location.
- Market conditions: Rents soft (-1.6%/yr); 354 active listings in the ZIP; lower-income renter base — watch delinquency; 29,883 units permitted in Harris County in 2024 (8,621 in 5+ unit buildings).
- At $3,387/mo this rent would consume 106% of the median local household income ($38k/yr) (locally 1177% of renters already pay >50% of income on rent) — very limited rent-growth headroom before tenants either downsize or default.
Forward outlook
- In year one you build about $20k of equity ($2k loan paydown + $18k appreciation (5.2% local appreciation)).
- Harris County population projected at +47% by 2050 — long-run rental-demand tailwind backs the buy-and-hold thesis.
- At projected returns (5.2% appreciation + 0.0% rent growth), your $94k cash investment doubles in ~4 years — after that, you're playing with house money.
- By year 2, paydown + projected appreciation supports a ~$32k cash-out refi (75% LTV) — recoverable capital for the next deal without selling this one.
Negotiation context
- It's been on market 44 days — a 3% lower offer ($325k) is reasonable based on typical stale-listing flexibility.
Risks & watch-outs
- Climate carrying-cost: major flood risk; severe wind risk, 99% chance of damaging wind over 30y; extreme-heat days projected 7→24/yr by 2055 (HVAC capex compounding) — expect insurance premiums to compound above CPI over the hold.
Questions for the listing agent
- It's been on market 44 days. Have you received any prior offers? Is the seller open to a 3% concession, seller financing, or rate buy-down credit?
- Can we see the unit-by-unit rent roll, current vacancy, and any below-market leases? What's the average tenancy length?
- What capital expenditures (roof, boiler, parking lot, exteriors) have been made in the last 5 years, and what's planned in the next 2?
- Is there a deadline driving the sale (1031 exchange, divorce, estate, relocation)? That informs how much negotiation room exists.
- Schools are D-rated, which usually means shorter tenancies and higher turnover. Who's the typical renter profile here, and what's been the actual vacancy rate?
- Crime grade is F in this area — have there been break-ins, vandalism, or insurance claims at this property in the last 3 years? What carrier currently insures it and at what premium?
- What's the average days-on-market for RENTAL listings here right now (not sales)? A rising rental-DOM trend means longer vacancies and softer asking-rent achievability than the comps imply.
- What's the recent tenant-quality profile in this submarket — average credit score on applications, eviction rate, late-payment / NSF rate, and stable-employment percentage? A property-management company in the area should have these aggregated.
- How much new apartment / multifamily construction is in the pipeline within 1–3 miles? Heavy new supply (>2% of stock underway) typically softens rents 12–24 months out; light construction supports rent growth.
Investment metrics
- 1% rule
- 1.01% ✓
- Cap rate
- 7.59%
- Cash-on-cash
- 4.62%
- DSCR
- 1.21
- GRM
- 8.2
CMA / ARV
- ARV (median comp)
- $386,190
- List price
- $334,900
- Delta
- -13.28%
- Verdict
- UNDERPRICED
- Comps
- 20 within 1.0 mi
Projected returns pro-forma
5.25% appreciation · 0.0% rent growth · sell at horizon
- IRR
- 16.0%
- Equity multiple
- 2.01×
- Total profit
- $95,031
- Equity at exit
- $194,787
- IRR
- 15.1%
- Equity multiple
- 3.65×
- Total profit
- $248,410
- Equity at exit
- $340,389
Cash invested: $93,772 (down + closing). Projections, not guarantees.
Landlord ↔ Tenant lean methodology
- Overall (STATE)
- 87 Strongly Landlord-Friendly
- State Texas
- 87 Strongly Landlord-Friendly · R+5
- County
- — inherits STATE
- City
- — inherits STATE
ZIP-level market 77028
- Home prices YoY
- 2.0%
- Rents YoY
- -1.6%
- Active inventory
- 354
- Price-to-rent
- 16.5×
Monthly cashflow live
- Estimated rent
- $3,387 high interval (Pro) →
- Mortgage (P&I)
- −$1,756
- Tax est. 1.5%
- −$419 /mo · $5,024/yr
- Insurance
- −$140
- HOA
- −$0
- Vacancy / Maint / Mgmt
- −$711
- Net cashflow
- $361
Break-even live
Sensitivity live
| Price | -10% $593 | -5% $477 | +0% $361 | +5% $246 | +10% $130 |
|---|---|---|---|---|---|
| Rent | -10% $94 | -5% $228 | +0% $361 | +5% $495 | +10% $629 |
| Rate | -1.0pp $530 | -0.5pp $446 | base $361 | +0.5pp $275 | +1.0pp $186 |
2-unit breakdown (identical units grouped — click to expand)
| Units | Beds | Baths | Est. rent |
|---|---|---|---|
| 2× units | 3 | 2 | $3,386 |
| #1 | 3 | 2 | $1,693 |
| #2 | 3 | 2 | $1,693 |
| Total (2 units) | $3,387 | ||
UW: 25.0% down · 7.5% · 30yr · 1.5% tax · 5.0% vac · 8.0% maint · 8.0% mgmt
Financing live
Cash to close
- Down payment
- $83,725
- Closing costs
- $10,047
- Reserves months
- —
- Total cash needed
- —
Loan-product check · same deal, 3 products live
Conventional
25% down · 7.5% · 30yr
- Down + closing
- —
- Monthly P&I
- —
- Monthly cashflow
- —
- DSCR
- —
- Eligible?
- —
Personal DTI + credit; lowest rate.
DSCR
20% down · 8.5% · 30yr
- Down + closing
- —
- Monthly P&I
- —
- Monthly cashflow
- —
- DSCR
- —
- Eligible?
- —
No personal income docs; deal must DSCR.
Hard money
10% down · 12.0% · 12mo
- Down + closing
- —
- Monthly P&I
- —
- Monthly cashflow
- —
- DSCR
- —
- Eligible?
- —
Short-term bridge; refi at stabilization.
Listing history 13 events
-
2026-06-21days on market $334,900 Active 44 DOM
-
2026-06-18days on market $334,900 Active 41 DOM
-
2026-06-17days on market $334,900 Active 40 DOM
-
2026-06-16days on market $334,900 Active 39 DOM
-
2026-06-15days on market $334,900 Active 38 DOM
-
2026-06-13days on market $334,900 Active 36 DOM
-
2026-06-10pricedays on market $334,900 Active 32 DOM
-
2026-06-08days on market $349,900 Active 31 DOM
-
2026-06-07days on market $349,900 Active 30 DOM
-
2026-06-04days on market $349,900 Active 27 DOM
-
2026-06-01days on market $349,900 Active 24 DOM
-
2026-05-31days on market $349,900 Active 23 DOM
-
2026-05-08$349,900 Active 443-char remark
ⓘ Source: listings_history table (triggers on properties + properties_extension) + one-shot
backfill from property_details.listing_events for pre-trigger history.
Climate risk First Street
- Flood 6/10 Major FEMA zone X (unshaded) · 68% chance over 30 yrs
- Wildfire 2/10 Low
- Heat 9/10 Extreme 7 d/yr ≥110°F today · 24 d/yr by 30 yrs out
- Wind 9/10 Extreme 99% chance of damaging wind over 30 yrs
- Air quality 3/10 Moderate 2 unhealthy d/yr today · 3 by 30 yrs out
Nearby sold comps map
Loading sold comps map…
Walkable amenities ~0.75 mi
Loading nearby amenities…
Taxation est. · year 1
- Rental income
- $40,644
- − Mortgage interest
- −$18,760
- − Property taxes
- −$5,024
- − Insurance
- −$1,674
- − Repairs & maintenance
- −$3,252
- − Management
- −$3,252
- − Depreciation
- −$9,743
- Taxable loss
- −$1,059
- Est. tax savings @ 24.0%
- +$254
- After-tax cash flow
- $4,590/yr
For passive investors: Depreciation is non-cash, so a rental often shows a tax loss while cash-flowing — sheltering income. Rental losses are passive: they offset passive income freely, and up to $25,000/yr can offset ordinary (W-2) income if you actively participate and your MAGI is under $100k (phasing out to $0 by $150k); unused losses carry forward. On sale, claimed depreciation is recaptured at up to 25%, and gains may owe capital-gains tax (a 1031 exchange can defer both). Figures are a year-1 estimate at your 24.0% rate — not tax advice; consult a CPA.
Condition & rehab AI · 22 photos
This multi-family property is in good condition with modern amenities and a well-maintained exterior. It offers a good investment opportunity with potential for rental or resale value enhancement through minor updates.
Value-add opportunities
- Both Painting exterior and interior walls — Enhances curb appeal and interior aesthetics
- Both Landscaping and curb appeal improvements — Improves property's visual appeal
- Both Replace old appliances with energy-efficient models — Reduces utility costs and enhances home's marketability
Renovation cost estimate screening
Value-add ROI direction
- Both Painting exterior and interior walls — Enhances curb appeal and interior aesthetics ↑
- Both Landscaping and curb appeal improvements — Improves property's visual appeal ↑
- Both Replace old appliances with energy-efficient models — Reduces utility costs and enhances home's marketability ↑
ⓘ Cost ranges are severity-bucket heuristics (US national rule-of-thumb). Get contractor quotes + a written scope before underwriting a rehab budget.
Schools (NCES district)
- District
- Houston ISD
- NCES district ID
- 4823640
- Math proficiency
- 27% ▼ -18.00%
- Reading proficiency
- 35% ▼ -6.00%
- Median HH income
- $46,054
- Composite
- 26.63/100
- National rank
- #7173
- State rank
- #593 of 826 in TX
Livability — Houston
- Score
- 74/100
- State rank
- #184
- US rank
- #4771
Category grades
Schools grade is shown separately in the Schools card above.
Census & demographics
- Census place
- Houston, TX
- County
- Harris County · 4,702,590 people
- City population
- 3,226,434
- Metro
- Houston-The Woodlands-Sugar Land, TX
- Population (ZIP)
- 19,109
- Household income
- $38,357
- Rent vs Own
- Severe rent burden
- 1177.0
Population outlook (Harris County) Hauer SSP2
- Today (2025)
- 5,571,493 people
- By 2030
- 6,089,821 · +9.3%
- By 2040
- 7,142,806 · +28.2%
- By 2050
- 8,185,864 · +46.9%
- By 2075
- 10,574,329 · +89.8%
- By 2100
- 12,109,958 · +117.4%
Race, ethnicity, and origin ACS 2023
- Neighborhood character
- Majority Black (57%)
- Race & ethnicity
- Black 57% Hispanic / Latino 41% Two or more races 15% White 2%
- Hispanic origin (detail)
- Mexican 36%
- Foreign-born
- 13% · Canada
- Languages at home
- 61% English-only · Spanish 38%
Political lean MEDSL · Harris
- 2024 margin
- Lean D (+5.5) · D 52.0% · R 46.4% · Other 1.6%
- 2008→2024 swing
- +3.9pp toward D · 2008: 1.6pp · 2024: 5.5pp
- All cycles
- 2024: D+5.5 2020: D+13.3 2016: D+12.4 2012: D+0.1 2008: D+1.6
Not yet ingested
- Civics
- —
Market trends
- HPI YoY
- ▲ 5.25%
- Current HPI
- 267.7798
- Rent YoY
- ▼ -1.55%
- Metro
- Houston-The Woodlands-Sugar Land, TX
- State GDP YoY
- ▲ 3.95%
- F500 in state
- 110
Industry mix (Fortune 500 HQ in TX)
| Industry | F500 HQs | Revenue |
|---|---|---|
| Energy | 16 | $1,198B |
|
||
| Technology | 5 | $198B |
|
||
| Engineering / Construction | 4 | $72B |
|
||
| Energy Services | 3 | $60B |
|
||
| Utilities | 3 | $41B |
|
||
| Healthcare | 2 | $330B |
|
||
Price history
-4.3% since first listed2 events — show timeline
- 2026-06-09 Price Changed $334,900 HARMLS
- 2026-05-08 Listed $349,900 HARMLS
Cash-flow waterfall
monthlySold comps — $/sqft
last 12 mo · ≤1 miLoading sold comps…