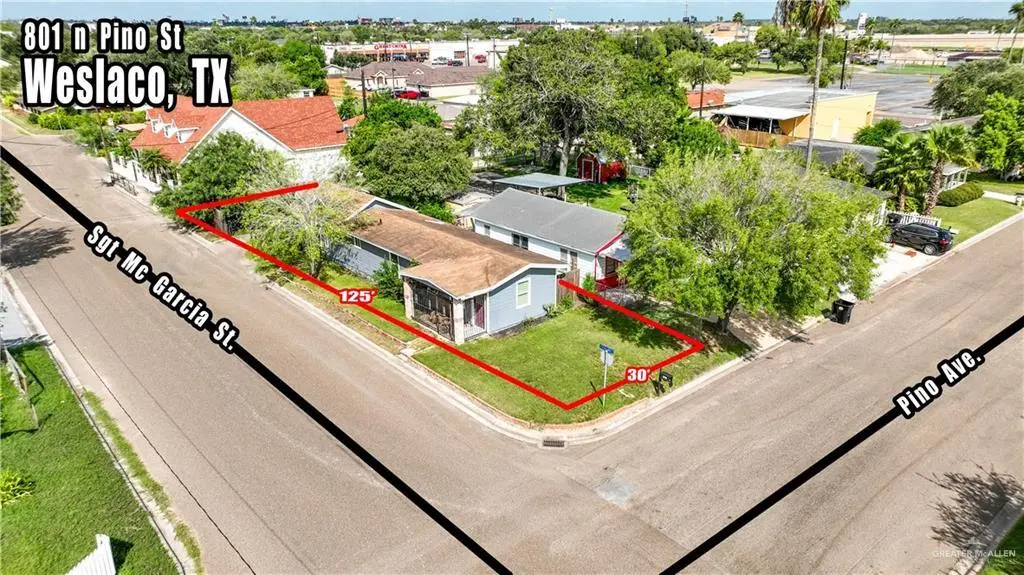
801 N Pino St · Weslaco, TX
Flood risk 6/10 · Moderate
- FEMA flood zone
- AH
- Chance of flooding over 30 yrs
- 0.74%
- Est. flood insurance / yr
- $1,142 – $2,507
Fire risk 1/10 · Minimal
- Est. fire insurance / yr
- $1,222 – $2,270
Heat risk 9/10 · Severe
- Hot days now (above 111°F)
- 7 days/yr
- Hot days in 30 yrs
- 23 days/yr
Wind risk 8/10 · Major
- Chance of severe wind over 30 yrs
- 99.0%
Air-quality risk 1/10 · Minimal
- Unhealthy air days now
- 0 days/yr
- Unhealthy air days in 30 yrs
- 0 days/yr
Risk factors via First Street. Map © Google.
Why this score? — see what drove the B grade
The composite is a weighted blend of 9 inputs, each scored 0–100. Each bar is that input's sub-score; the figure is the points it added to the 100-point composite (weight × sub-score).
- Cash flow +26.0/30.0
- ARV discount +15.0/15.0
- DSCR +8.8/10.0
- 1% rule +6.9/10.0
- Appreciation +4.7/10.0
- Livability +3.6/5.0
- Rent growth +2.5/5.0
- Condition / age +2.5/5.0
- Schools +2.2/10.0
$119,000
🖨 Deal sheet (PDF) 📄 Offer letter ✓ Due diligence
Listing remarks MLS
Wow! Look no further, this is a great opportunity to get into a home at an affordable price in a great location. This home features a 3 bedroom 1 bath on a corner acre with plenty of on street parking. Just minutes away from the highway and shopping centers. House has an updated kitchen and roof. Easy to show, Please contact your local agent today for a showing.
Key facts
- Updated kitchen
- Updated roof
- Corner acre
Tags
Neighborhood map
What this means for you Summary
Snapshot
- This is a 5-bed/1.0-bath single-family listed at $119k.
Deal economics
- At list price, monthly cash flow is $146 ($2k/yr) — positive.
- The deal already cash-flows at list — no discount required.
- Meets the 1% rule at list price ($1k rent vs $119k).
- Recommended offer: $105k (12.0% below list) — sets the bar for market timing.
- Cap rate 9.3% vs local median 4.1% in Weslaco — top-decile yield for the area; either an underpriced asset or a hidden risk that comps aren't pricing in. Stress-test before assuming the spread holds.
Location & tenants
- Location reads 72/100 on livability (#277 in TX) — a middle-class / working-renter tenant base. Strengths: cost of living A+, housing A+, health & safety A+; Watch: employment D+, crime F, amenities F.
- Weslaco ISD (suburban): math 23% / reading 31% proficiency, ranked #705 of 826 in TX (top 85%) — low school quality limits family demand, transient renter base, plan for 1-2y turnover.
- Zoned schools: Sam Houston El (math 22% / reading 37%, grade F, #2,525 of 4,322 statewide, top 62%, 745 students, 87% FRL); Central Middle (math 33% / reading 40%, grade F, #786 of 1,662 statewide, top 48%, 974 students, 70% FRL); Weslaco H S (math 25% / reading 33%, grade F, #1,147 of 1,632 statewide, top 71%, 2,553 students, 73% FRL) — zoned schools average 77% FRL vs 59% district-wide (17 pts higher); higher-poverty schools than district average — tighter screening recommended.
- Market conditions: 711 active listings in the ZIP; 7,378 units permitted in Hidalgo County in 2024 (641 in 5+ unit buildings).
Forward outlook
- In year one you build about $128 of equity ($823 loan paydown + $-695 appreciation (-0.6% local appreciation)).
- Hidalgo County population projected at +28% by 2050 — long-run rental-demand tailwind backs the buy-and-hold thesis.
- At projected returns (-0.6% appreciation + 3.0% rent growth), your $33k cash investment doubles in ~10 years — after that, you're playing with house money.
Negotiation context
- It's been on market 228 days — a 12% lower offer ($105k) is reasonable based on typical stale-listing flexibility.
- 6 sale attempts since 5y ago with the ask held roughly flat each time — persistent listings suggest the price (not the market) is what's stuck; bring a comps-based counter.
Risks & watch-outs
- Watch-outs: flood insurance adds $152/mo.
- Climate carrying-cost: in FEMA flood zone AH (mandatory federal flood insurance); severe wind risk, 99% chance of damaging wind over 30y; extreme-heat days projected 7→23/yr by 2055 (HVAC capex compounding) — expect insurance premiums to compound above CPI over the hold.
Questions for the listing agent
- It's been on market 228 days. Have you received any prior offers? Is the seller open to a 12% concession, seller financing, or rate buy-down credit?
- What's the actual annual flood-insurance premium (NFIP or private), and is the property in a SFHA with mandatory coverage?
- Why hasn't it sold? Are there any deal-killer items the seller is aware of (foundation, flood, title, zoning, code violations)?
- Is there a deadline driving the sale (1031 exchange, divorce, estate, relocation)? That informs how much negotiation room exists.
- Crime grade is F in this area — have there been break-ins, vandalism, or insurance claims at this property in the last 3 years? What carrier currently insures it and at what premium?
- What's the average days-on-market for RENTAL listings here right now (not sales)? A rising rental-DOM trend means longer vacancies and softer asking-rent achievability than the comps imply.
- What's the recent tenant-quality profile in this submarket — average credit score on applications, eviction rate, late-payment / NSF rate, and stable-employment percentage? A property-management company in the area should have these aggregated.
- How much new for-sale + rental construction is in the pipeline within 1–3 miles? Heavy new supply typically softens prices + rents 12–24 months out; constrained supply supports both.
Investment metrics
- 1% rule
- 1.19% ✓
- Cap rate
- 9.30%
- Cash-on-cash
- 10.72%
- DSCR
- 1.48
- GRM
- 7.0
CMA / ARV
- ARV (median comp)
- $145,734
- List price
- $119,000
- Delta
- -18.34%
- Verdict
- UNDERPRICED
- Comps
- 20 within 1.0 mi
Projected returns pro-forma
-0.58% appreciation · 3.0% rent growth · sell at horizon
- IRR
- 1.8%
- Equity multiple
- 1.08×
- Total profit
- $2,686
- Equity at exit
- $31,118
- IRR
- 7.9%
- Equity multiple
- 1.80×
- Total profit
- $26,816
- Equity at exit
- $34,763
Cash invested: $33,320 (down + closing). Projections, not guarantees.
Landlord ↔ Tenant lean methodology
- Overall (STATE)
- 87 Strongly Landlord-Friendly
- State Texas
- 87 Strongly Landlord-Friendly · R+5
- County
- — inherits STATE
- City
- — inherits STATE
ZIP-level market 78596
- Home prices YoY
- -0.2%
- Active inventory
- 711
- Price-to-rent
- 7.0×
Monthly cashflow live
- Estimated rent
- $1,419 medium interval (Pro) →
- Mortgage (P&I)
- −$624
- Tax from tax record
- −$149 /mo · $1,792/yr
- Insurance
- −$50
- Flood insurance flood zone
- −$152 /mo · $1,824/yr
- HOA
- −$0
- Vacancy / Maint / Mgmt
- −$298
- Net cashflow
- $146
Break-even live
Sensitivity live
| Price | -10% $213 | -5% $179 | +0% $146 | +5% $112 | +10% $78 |
|---|---|---|---|---|---|
| Rent | -10% $34 | -5% $90 | +0% $146 | +5% $202 | +10% $258 |
| Rate | -1.0pp $206 | -0.5pp $176 | base $146 | +0.5pp $115 | +1.0pp $84 |
UW: 25.0% down · 7.5% · 30yr · 1.5% tax · 5.0% vac · 8.0% maint · 8.0% mgmt
Financing live
Cash to close
- Down payment
- $29,750
- Closing costs
- $3,570
- Reserves months
- —
- Total cash needed
- —
Loan-product check · same deal, 3 products live
Conventional
25% down · 7.5% · 30yr
- Down + closing
- —
- Monthly P&I
- —
- Monthly cashflow
- —
- DSCR
- —
- Eligible?
- —
Personal DTI + credit; lowest rate.
DSCR
20% down · 8.5% · 30yr
- Down + closing
- —
- Monthly P&I
- —
- Monthly cashflow
- —
- DSCR
- —
- Eligible?
- —
No personal income docs; deal must DSCR.
Hard money
10% down · 12.0% · 12mo
- Down + closing
- —
- Monthly P&I
- —
- Monthly cashflow
- —
- DSCR
- —
- Eligible?
- —
Short-term bridge; refi at stabilization.
Listing history 29 events
-
2026-06-21days on market $119,000 Active 228 DOM
-
2026-06-21days on market $119,000 Active 227 DOM
-
2026-06-18days on market $119,000 Active 225 DOM
-
2026-06-17days on market $119,000 Active 224 DOM
-
2026-06-16days on market $119,000 Active 223 DOM
-
2026-06-15days on market $119,000 Active 222 DOM
-
2026-06-15days on market $119,000 Active 221 DOM
-
2026-06-13days on market $119,000 Active 220 DOM
-
2026-06-12days on market $119,000 Active 219 DOM
-
2026-06-09days on market $119,000 Active 216 DOM
-
2026-06-08days on market $119,000 Active 215 DOM
-
2026-06-08days on market $119,000 Active 214 DOM
-
2026-06-07days on market $119,000 Active 213 DOM
-
2026-06-03days on market $119,000 Active 210 DOM
-
2026-06-02days on market $119,000 Active 209 DOM
-
2026-06-01days on market $119,000 Active 208 DOM
-
2026-05-31days on market $119,000 Active 207 DOM
-
2025-11-05$119,000 Active 366-char remark
Show marketing remark (366 chars)
Wow! Look no further, this is a great opportunity to get into a home at an affordable price in a great location. This home features a 3 bedroom 1 bath on a corner acre with plenty of on street parking. Just minutes away from the highway and shopping centers. House has an updated kitchen and roof. Easy to show, Please contact your local agent today for a showing.
-
2025-04-21$124,900 Active
-
2024-02-15$124,900 Active
-
2023-10-09status Active
-
2023-10-09price $124,900
-
2023-09-15price $127,000
-
2023-05-23$130,000 Active
-
2021-10-12soldstatus
-
2021-08-27soldstatus Sold
-
2021-08-14status Pending
-
2021-08-12status Option Pending
-
2021-07-21$65,000 Active
ⓘ Source: listings_history table (triggers on properties + properties_extension) + one-shot
backfill from property_details.listing_events for pre-trigger history.
Tax reassessment forecast TX · Resets to sale price
- Current annual tax
- $1,792 · $149/mo
- Projected year-2 tax
- $2,178 · $181/mo
- Expected delta
- +$386/yr (+$32/mo · 21.5%)
ⓘ Screening estimate from a state-policy table — verify with the county assessor before closing.
Climate risk First Street
- Flood 6/10 Major FEMA zone AH · 74% chance over 30 yrs
- Wildfire 1/10 Low
- Heat 9/10 Extreme 7 d/yr ≥111°F today · 23 d/yr by 30 yrs out
- Wind 8/10 Severe 99% chance of damaging wind over 30 yrs
- Air quality 1/10 Low 0 unhealthy d/yr today · 0 by 30 yrs out
Nearby sold comps map
Loading sold comps map…
Walkable amenities ~0.75 mi
Loading nearby amenities…
Taxation est. · year 1
- Rental income
- $17,024
- − Mortgage interest
- −$6,666
- − Property taxes
- −$1,792
- − Insurance
- −$2,420
- − Repairs & maintenance
- −$1,362
- − Management
- −$1,362
- − Depreciation
- −$3,462
- Taxable loss
- −$39
- Est. tax savings @ 24.0%
- +$9
- After-tax cash flow
- $1,758/yr
For passive investors: Depreciation is non-cash, so a rental often shows a tax loss while cash-flowing — sheltering income. Rental losses are passive: they offset passive income freely, and up to $25,000/yr can offset ordinary (W-2) income if you actively participate and your MAGI is under $100k (phasing out to $0 by $150k); unused losses carry forward. On sale, claimed depreciation is recaptured at up to 25%, and gains may owe capital-gains tax (a 1031 exchange can defer both). Figures are a year-1 estimate at your 24.0% rate — not tax advice; consult a CPA.
Schools (NCES district)
- District
- Weslaco ISD
- NCES district ID
- 4844960
- Math proficiency
- 23% ▼ -29.00%
- Reading proficiency
- 31% ▼ -9.00%
- Median HH income
- $32,867
- Composite
- 22.05/100
- National rank
- #8196
- State rank
- #705 of 826 in TX
Livability — Weslaco
- Score
- 72/100
- State rank
- #277
- US rank
- #6469
Category grades
Schools grade is shown separately in the Schools card above.
Census & demographics
- Census place
- Weslaco, TX
- Population (ZIP)
- 38,942
Population outlook (Hidalgo County) Hauer SSP2
- Today (2025)
- 955,232 people
- By 2030
- 1,009,774 · +5.7%
- By 2040
- 1,120,332 · +17.3%
- By 2050
- 1,225,036 · +28.2%
- By 2075
- 1,439,189 · +50.7%
- By 2100
- 1,533,429 · +60.5%
Race, ethnicity, and origin ACS 2023
- Neighborhood character
- Predominantly Hispanic (86%)
- Race & ethnicity
- Hispanic / Latino 86% Two or more races 38% White 13%
- Hispanic origin (detail)
- Mexican 82%
- Common ancestry
- Slovak 1%
- Foreign-born
- 17% · Canada
- Languages at home
- 27% English-only · Spanish 72%
Political lean MEDSL · Hidalgo
- 2024 margin
- Toss-up / Even · D 48.1% · R 51.0%
- 2008→2024 swing
- -41.6pp toward R · 2008: 38.7pp · 2024: -2.9pp
- All cycles
- 2024: R+2.9 2020: D+17.1 2016: D+40.5 2012: D+41.8 2008: D+38.7
Not yet ingested
- Civics
- —
Market trends
- HPI YoY
- ▼ -0.58%
- Current HPI
- 261.5117
- Rent YoY
- —
- Metro
- —
- State GDP YoY
- ▲ 3.95%
- F500 in state
- 110
Industry mix (Fortune 500 HQ in TX)
| Industry | F500 HQs | Revenue |
|---|---|---|
| Energy | 16 | $1,198B |
|
||
| Technology | 5 | $198B |
|
||
| Engineering / Construction | 4 | $72B |
|
||
| Energy Services | 3 | $60B |
|
||
| Utilities | 3 | $41B |
|
||
| Healthcare | 2 | $330B |
|
||
Price history
+83.1% since first listed12 events — show timeline
- 2025-11-05 Listed $119,000 MCALLENMLS
- 2025-04-21 Listed $124,900 MCALLENMLS
- 2024-02-15 Listed $124,900 MCALLENMLS
- 2023-10-09 Relisted — MCALLENMLS
- 2023-10-09 Price Changed $124,900 MCALLENMLS
- 2023-09-15 Price Changed $127,000 MCALLENMLS
- 2023-05-23 Listed $130,000 MCALLENMLS
- 2021-10-12 Sold (Public Records) — Public Records
- 2021-08-27 Sold (MLS) — HARMLS
- 2021-08-14 Pending — HARMLS
- 2021-08-12 Pending — HARMLS
- 2021-07-21 Listed $65,000 HARMLS
Property tax history
+7.5%/yrLatest (2025): $1,792 · +9.8% YoY. Source: county tax records.
Cash-flow waterfall
monthlySold comps — $/sqft
last 12 mo · ≤1 miLoading sold comps…