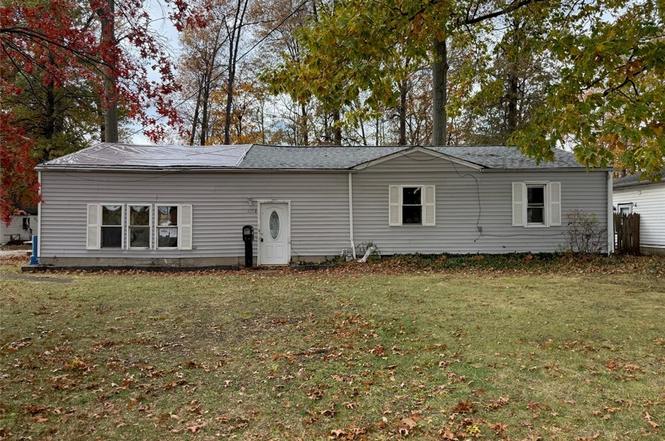
1798 E 337th St · Eastlake, OH
Flood risk 1/10 · Minimal
- FEMA flood zone
- X (unshaded)
- Chance of flooding over 30 yrs
- 0.0%
- Est. flood insurance / yr
- $507 – $1,088
Fire risk 1/10 · Minimal
- Est. fire insurance / yr
- $713 – $1,323
Heat risk 3/10 · Minor
- Hot days now (above 95°F)
- 7 days/yr
- Hot days in 30 yrs
- 17 days/yr
Wind risk 1/10 · Minimal
- Chance of severe wind over 30 yrs
- —
Air-quality risk 4/10 · Minor
- Unhealthy air days now
- 3 days/yr
- Unhealthy air days in 30 yrs
- 5 days/yr
Risk factors via First Street. Map © Google.
Why this score? — see what drove the B grade
The composite is a weighted blend of 9 inputs, each scored 0–100. Each bar is that input's sub-score; the figure is the points it added to the 100-point composite (weight × sub-score).
- Cash flow +30.0/30.0
- 1% rule +10.0/10.0
- DSCR +10.0/10.0
- ARV discount +7.5/15.0
- Schools +4.3/10.0
- Rent growth +3.7/5.0
- Livability +3.4/5.0
- Condition / age +2.5/5.0
- Appreciation +0.0/10.0
$85,000
🖨 Deal sheet (PDF) 📄 Offer letter ✓ Due diligence
Listing remarks MLS
Included Parcel # 34a002c000280 + 035 0
Key facts
- 0.84 acre lot
- Parking
- Built 1952
Neighborhood map
What this means for you Summary
Snapshot
- This is a 3-bed/1.0-bath single-family listed at $85k.
Deal economics
- At list price, monthly cash flow is $818 ($10k/yr) — positive.
- The deal already cash-flows at list — no discount required.
- Meets the 1% rule at list price ($2k rent vs $85k).
- Recommended offer: $80k (6.0% below list) — sets the bar for market timing.
- Cap rate 17.8% vs local median 4.8% in Eastlake — top-decile yield for the area; either an underpriced asset or a hidden risk that comps aren't pricing in. Stress-test before assuming the spread holds.
Location & tenants
- Location reads 68/100 on livability (#550 in OH) — a middle-class / working-renter tenant base. Strengths: cost of living A+, housing A+, health & safety A-; Watch: employment D+, amenities F, commute F.
- Willoughby-Eastlake City (suburban): math 42% / reading 58% proficiency, ranked #434 of 656 in OH (top 66%) — acceptable for families but not a draw, mixed tenant base, ~2y average lease.
- Market conditions: Rents rising fast (+4.8%/yr); 129 active listings in the ZIP; 4 comparable units currently listed for rent nearby; rentals lingering (median 45d on market — plan ~5-8 weeks vacancy on turnover, expect pricing pressure); 50% of comp listings sitting > 30 days — soft ceiling on asking rent; 448 units permitted in Lake County in 2024 (0 in 5+ unit buildings).
- This rent runs 32% of the median local income ($72k/yr) — at the standard rent-burdened threshold; future hikes will face affordability resistance.
Forward outlook
- Local home prices are declining (-3.0%/yr); year-one equity from $588 of loan paydown is wiped out by about $3k of value loss. Plan a longer hold.
- Lake County population projected to shrink 8% by 2050 — rents likely to lag national; underwrite the cash flow, not the appreciation.
- At projected returns (-3.0% appreciation + 4.8% rent growth), your $24k cash investment doubles in ~3 years — after that, you're playing with house money.
Negotiation context
- It's been on market 90 days — a 6% lower offer ($80k) is reasonable based on typical stale-listing flexibility.
- 3 sale attempts since 22y ago; this cycle's ask has dropped $35k (29%) from the opening price — seller is motivated, your offer sets the floor, not the list.
Risks & watch-outs
- Watch-outs: property tax is 2.9% of price; built in 1952 — expect roof / HVAC / electrical / plumbing capex.
Questions for the listing agent
- It's been on market 90 days. Have you received any prior offers? Is the seller open to a 6% concession, seller financing, or rate buy-down credit?
- Built in 1952 — when were the roof, HVAC, electrical panel, plumbing, and water heater last replaced?
- Property tax is high relative to price — has the assessment been appealed recently, and will the sale trigger a re-assessment?
- Why hasn't it sold? Are there any deal-killer items the seller is aware of (foundation, flood, title, zoning, code violations)?
- Is there a deadline driving the sale (1031 exchange, divorce, estate, relocation)? That informs how much negotiation room exists.
- Schools are B-rated — typically a magnet for longer-tenancy family renters. What's the average tenant stay here, and is there a school-zone premium baked into asking?
- What's the average days-on-market for RENTAL listings here right now (not sales)? A rising rental-DOM trend means longer vacancies and softer asking-rent achievability than the comps imply.
- What's the recent tenant-quality profile in this submarket — average credit score on applications, eviction rate, late-payment / NSF rate, and stable-employment percentage? A property-management company in the area should have these aggregated.
- How much new for-sale + rental construction is in the pipeline within 1–3 miles? Heavy new supply typically softens prices + rents 12–24 months out; constrained supply supports both.
Investment metrics
- 1% rule
- 2.24% ✓
- Cap rate
- 17.85%
- Cash-on-cash
- 41.27%
- DSCR
- 2.84
- GRM
- 3.7
CMA / ARV
- ARV (on-the-fly)
- $241,200
- Comps found
- 7
Show comp detail 7 sales within ~0.75 mi
| Address | Dist | Beds/Ba | Sqft | Sold | Price | $/sf | Match |
|---|---|---|---|---|---|---|---|
| 1798 E 337th St | 0.00mi | 3/1.0 | 1,800 (0%) | 1mo | $61,555 | $34 | 99 |
| 31716 Daniel Dr | 0.48mi | 3/1.5 | 1,733 (-4%) | 7mo | $226,000 | $130 | 63 |
| 853 Bayridge Blvd | 0.41mi | 3/1.5 | 1,600 (-11%) | 9mo | $240,000 | $150 | 53 |
| 725 Pendley Rd | 0.59mi | 4/1.5 (+1) | 1,584 (-12%) | 7mo | $163,900 | $103 | 40 |
| 732 Pendley Rd | 0.61mi | 3/2.0 | 1,600 (-11%) | 11mo | $230,000 | $144 | 40 |
| 1605 Luanna Dr | 0.38mi | 4/2.0 (+1) | 1,625 (-10%) | 22mo | $218,000 | $134 | 38 |
| 30612 Ronald Dr | 0.75mi | 3/2.0 | 1,586 (-12%) | 12mo | $260,000 | $164 | 31 |
Match score weights: distance 35% · size 25% · config 20% · recency 20%. Top-matched comps best support the ARV.
Projected returns pro-forma
-3.0% appreciation · 4.81% rent growth · sell at horizon
- IRR
- 40.0%
- Equity multiple
- 2.76×
- Total profit
- $41,969
- Equity at exit
- $12,674
- IRR
- 47.3%
- Equity multiple
- 6.00×
- Total profit
- $119,049
- Equity at exit
- $7,349
Cash invested: $23,800 (down + closing). Projections, not guarantees.
Landlord ↔ Tenant lean methodology
- Overall (STATE)
- 73 Landlord-Friendly
- State Ohio
- 73 Landlord-Friendly · R+6
- County
- — inherits STATE
- City
- — inherits STATE
ZIP-level market 44095
- Rents YoY
- 4.8%
- Active inventory
- 129
- Price-to-rent
- 3.7×
Monthly cashflow live
- Estimated rent
- $1,903 medium interval (Pro) →
- Mortgage (P&I)
- −$446
- Tax from tax record
- −$204 /mo · $2,445/yr
- Insurance
- −$35
- HOA
- −$0
- Vacancy / Maint / Mgmt
- −$400
- Net cashflow
- $818
Break-even live
Sensitivity live
| Price | -10% $867 | -5% $842 | +0% $818 | +5% $794 | +10% $770 |
|---|---|---|---|---|---|
| Rent | -10% $668 | -5% $743 | +0% $818 | +5% $894 | +10% $969 |
| Rate | -1.0pp $861 | -0.5pp $840 | base $818 | +0.5pp $796 | +1.0pp $774 |
UW: 25.0% down · 7.5% · 30yr · 1.5% tax · 5.0% vac · 8.0% maint · 8.0% mgmt
Financing live
Cash to close
- Down payment
- $21,250
- Closing costs
- $2,550
- Reserves months
- —
- Total cash needed
- —
Loan-product check · same deal, 3 products live
Conventional
25% down · 7.5% · 30yr
- Down + closing
- —
- Monthly P&I
- —
- Monthly cashflow
- —
- DSCR
- —
- Eligible?
- —
Personal DTI + credit; lowest rate.
DSCR
20% down · 8.5% · 30yr
- Down + closing
- —
- Monthly P&I
- —
- Monthly cashflow
- —
- DSCR
- —
- Eligible?
- —
No personal income docs; deal must DSCR.
Hard money
10% down · 12.0% · 12mo
- Down + closing
- —
- Monthly P&I
- —
- Monthly cashflow
- —
- DSCR
- —
- Eligible?
- —
Short-term bridge; refi at stabilization.
Rent comps 4 comps
| Address | Beds | Baths | Sqft | Rent | $/sqft | DOM | Units | Dist |
|---|---|---|---|---|---|---|---|---|
| 762 E 305th St Willowick, OH | 3.0 | 1.0 | 2436 | $2,000 | $0.82 | 2d | 1 | 0.78mi |
| 30620 Euclid Ave Wickliffe, OH | 2.0 | 1.0 | 1500 | $1,500 | $1.00 | 3d | 1 | 0.79mi |
| 1902 Harding Dr Wickliffe, OH | 3.0 | 2.0 | 2376 | $2,300 | $0.97 | 44d | 1 | 1.15mi |
| 459 Clarmont Rd Willowick, OH | 4.0 | 2.0 | 1488 | $1,875 | $1.26 | 44d | 1 | 1.27mi |
Listing history 12 events
-
2026-02-04status Pending
-
2026-01-21price $85,000
-
2026-01-17price $94,900
-
2025-12-17price $99,900
-
2025-11-25price $114,000
-
2025-11-06$120,000 Active
-
2025-09-13historical
-
2025-08-17$195,000 Active
-
2025-08-08soldstatus $100,200
-
2004-09-23soldstatus $99,000 39-char remark
Show marketing remark (39 chars)
Included Parcel # 34a002c000280 + 035 0
-
2004-06-12$99,900 39-char remark
Show marketing remark (39 chars)
Included Parcel # 34a002c000280 + 035 0
-
1994-12-19soldstatus $70,000
ⓘ Source: listings_history table (triggers on properties + properties_extension) + one-shot
backfill from property_details.listing_events for pre-trigger history.
Tax reassessment forecast OH · Partial reset (capped growth)
- Current annual tax
- $2,445 · $204/mo
- Projected year-2 tax
- $2,445 · $204/mo
- Expected delta
- $0/yr ($0/mo · 0.0%)
ⓘ Screening estimate from a state-policy table — verify with the county assessor before closing.
Climate risk First Street
- Flood 1/10 Low FEMA zone X (unshaded) · 0% chance over 30 yrs
- Wildfire 1/10 Low
- Heat 3/10 Moderate 7 d/yr ≥95°F today · 17 d/yr by 30 yrs out
- Wind 1/10 Low
- Air quality 4/10 Moderate 3 unhealthy d/yr today · 5 by 30 yrs out
Nearby sold comps map
Loading sold comps map…
Walkable amenities ~0.75 mi
Loading nearby amenities…
Taxation est. · year 1
- Rental income
- $22,836
- − Mortgage interest
- −$4,761
- − Property taxes
- −$2,445
- − Insurance
- −$425
- − Repairs & maintenance
- −$1,827
- − Management
- −$1,827
- − Depreciation
- −$2,473
- Taxable income
- $9,078
- Est. tax owed @ 24.0%
- −$2,179
- After-tax cash flow
- $7,642/yr
For passive investors: Depreciation is non-cash, so a rental often shows a tax loss while cash-flowing — sheltering income. Rental losses are passive: they offset passive income freely, and up to $25,000/yr can offset ordinary (W-2) income if you actively participate and your MAGI is under $100k (phasing out to $0 by $150k); unused losses carry forward. On sale, claimed depreciation is recaptured at up to 25%, and gains may owe capital-gains tax (a 1031 exchange can defer both). Figures are a year-1 estimate at your 24.0% rate — not tax advice; consult a CPA.
Schools (NCES district)
- District
- Willoughby-Eastlake City
- NCES district ID
- 3904510
- Math proficiency
- 42% ▼ -21.00%
- Reading proficiency
- 58% ▼ -11.00%
- Median HH income
- $52,500
- Composite
- 42.96/100
- National rank
- #3110
- State rank
- #434 of 656 in OH
Livability — Eastlake
- Score
- 68/100
- State rank
- #550
- US rank
- #9388
Category grades
Schools grade is shown separately in the Schools card above.
Census & demographics
- Census place
- Eastlake, OH
- County
- Lake County · 204,927 people
- City population
- 32,363
- Metro
- Cleveland-Elyria, OH
- Population (ZIP)
- 32,363
- Household income
- $71,543
- Rent vs Own
- Severe rent burden
- 590.0
Population outlook (Lake County) Hauer SSP2
- Today (2025)
- 230,022 people
- By 2030
- 228,151 · -0.8%
- By 2040
- 221,018 · -3.9%
- By 2050
- 212,754 · -7.5%
- By 2075
- 200,309 · -12.9%
- By 2100
- 183,315 · -20.3%
Race, ethnicity, and origin ACS 2023
- Neighborhood character
- Predominantly White (87%)
- Race & ethnicity
- White 87% Black 5% Two or more races 5% Hispanic / Latino 3%
- Common ancestry
- Romanian 8% Slovak 2% Lithuanian 2%
- Foreign-born
- 3% · Canada
- Languages at home
- 94% English-only · Russian/Polish/Slavic 3% Spanish 1% German/W. Germanic 1%
Political lean MEDSL · Lake
- 2024 margin
- R (+14.3) · D 42.4% · R 56.7%
- 2008→2024 swing
- -15.2pp toward R · 2008: 0.8pp · 2024: -14.3pp
- All cycles
- 2024: R+14.3 2020: R+13.6 2016: R+15.6 2012: R+1.7 2008: D+0.8
Not yet ingested
- Civics
- —
Market trends
- HPI YoY
- ▼ -187.78%
- Current HPI
- 171.8121
- Rent YoY
- ▲ 4.81%
- Metro
- Cleveland-Elyria, OH
- State GDP YoY
- ▲ 1.98%
- F500 in state
- 48
Industry mix (Fortune 500 HQ in OH)
| Industry | F500 HQs | Revenue |
|---|---|---|
| Insurance | 3 | $145B |
|
||
| Industrial Machinery | 3 | $49B |
|
||
| Financial Services | 3 | $24B |
|
||
| Consumer Goods | 2 | $93B |
|
||
| Aerospace / Defense | 2 | $47B |
|
||
| Utilities | 2 | $33B |
|
||
Price history
+21.4% since first listed12 events — show timeline
- 2026-02-04 Pending — MLSNOW
- 2026-01-21 Price Changed $85,000 MLSNOW
- 2026-01-17 Price Changed $94,900 MLSNOW
- 2025-12-17 Price Changed $99,900 MLSNOW
- 2025-11-25 Price Changed $114,000 MLSNOW
- 2025-11-06 Listed $120,000 MLSNOW
- 2025-09-13 Listing Removed — MLSNOW
- 2025-08-17 Listed $195,000 MLSNOW
- 2025-08-08 Sold (Public Records) $100,200 Public Records
- 2004-09-23 Sold (MLS) $99,000 MLSNOW
- 2004-06-12 Listed $99,900 MLSNOW
- 1994-12-19 Sold (Public Records) $70,000 Public Records
Property tax history
+6.8%/yrLatest (2025): $2,445 · -2.2% YoY. Source: county tax records.
Cash-flow waterfall
monthlySold comps — $/sqft
last 12 mo · ≤1 miLoading sold comps…