 Multi-family
422 W Burleson St · Wharton, TX
Flood risk 1/10 · Minimal
- FEMA flood zone
- X (shaded)
- Chance of flooding over 30 yrs
- 0.0%
- Est. flood insurance / yr
- $507 – $1,088
Fire risk 3/10 · Minor
- Est. fire insurance / yr
- $1,222 – $2,270
Heat risk 9/10 · Severe
- Hot days now (above 110°F)
- 7 days/yr
- Hot days in 30 yrs
- 22 days/yr
Wind risk 9/10 · Severe
- Chance of severe wind over 30 yrs
- 99.0%
Air-quality risk 1/10 · Minimal
- Unhealthy air days now
- 0 days/yr
- Unhealthy air days in 30 yrs
- 0 days/yr
Risk factors via First Street. Map © Google.
Why this score? — see what drove the C grade
The composite is a weighted blend of 9 inputs, each scored 0–100. Each bar is that input's sub-score; the figure is the points it added to the 100-point composite (weight × sub-score).
- Cash flow +30.0/30.0
- DSCR +10.0/10.0
- 1% rule +9.1/10.0
- Livability +3.2/5.0
- Rent growth +2.5/5.0
- Schools +2.5/10.0
- Condition / age +2.5/5.0
- ARV discount +0.0/15.0
- Appreciation +0.0/10.0
$140,000
🖨 Deal sheet 📄 Offer letter ✓ Due diligence
Multi-family units
County records classify this as Multi-Family (2-4 Unit). Listing-text estimate: 1 unit. estimate disagrees with records
Listing remarks MLS
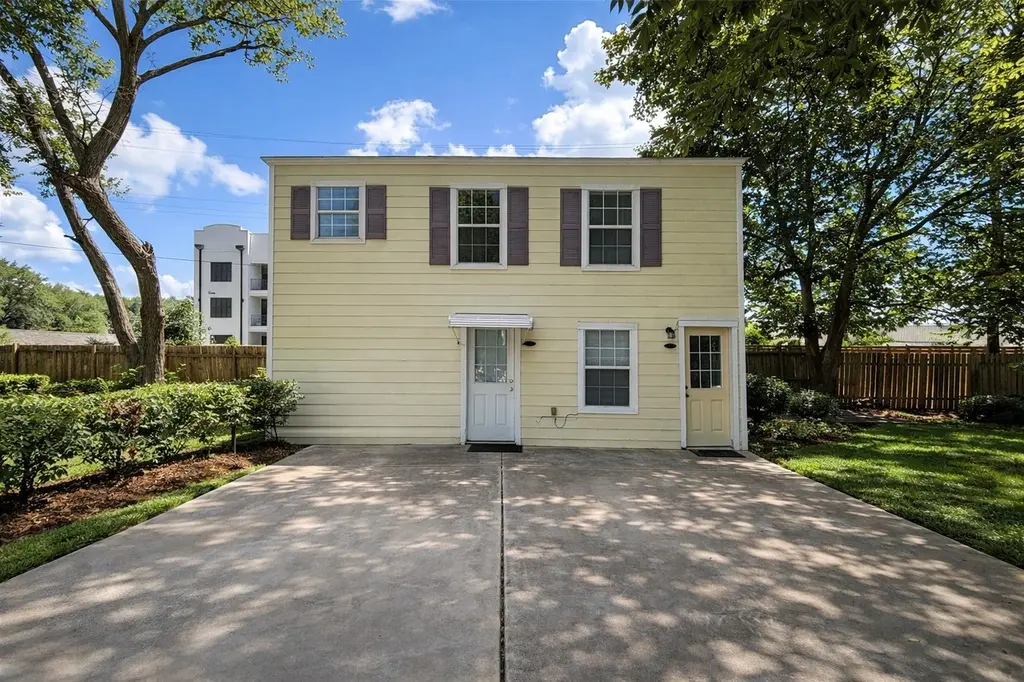
This duplex is situated on a residential lot within the city limits of Wharton and features two separate units under one roof. The structure is a single-story building with a traditional layout, each unit offering its own private entry. The exterior includes a combination of siding materials, a pitched roofline, and a standard driveway approach from W Burleson Street. The lot provides a front yard area with additional open space toward the rear of the property. The surrounding neighborhood consists of single-family homes and small multifamily structures with convenient access to local schools, parks, and community amenities.
Key facts
- Front yard area
- Two separate units
- Private entry
Tags
Neighborhood map
What this means for you Summary
Snapshot
- This is a 2-bed/2.0-bath multifamily listed at $140k.
Deal economics
- At list price, monthly cash flow is $540 ($6k/yr) — positive.
- The deal already cash-flows at list — no discount required.
- Meets the 1% rule at list price ($2k rent vs $140k).
- Recommended offer: $123k (12.0% below list) — sets the bar for market timing.
- Cap rate 10.9% vs local median 3.2% in Wharton — top-decile yield for the area; either an underpriced asset or a hidden risk that comps aren't pricing in. Stress-test before assuming the spread holds.
Location & tenants
- Location reads 65/100 on livability (#693 in TX) — a middle-class / working-renter tenant base. Strengths: cost of living A+, housing A+, health & safety B; Watch: crime C-, schools F, amenities F.
- Wharton ISD (town): math 28% / reading 31% proficiency, ranked #651 of 826 in TX (top 79%) — low school quality limits family demand, transient renter base, plan for 1-2y turnover; 70% free/reduced lunch — lower-income household profile, screen leases tightly.
- Market conditions: 164 active listings in the ZIP; 1 comparable units currently listed for rent nearby; 191 units permitted in Wharton County in 2024 (45 in 5+ unit buildings).
Forward outlook
- Local home prices are declining (-3.0%/yr); year-one equity from $968 of loan paydown is wiped out by about $4k of value loss. Plan a longer hold.
- At projected returns (-3.0% appreciation + 3.0% rent growth), your $39k cash investment doubles in ~8 years — after that, you're playing with house money.
Negotiation context
- It's been on market 137 days — a 12% lower offer ($123k) is reasonable based on typical stale-listing flexibility.
- 6 sale attempts since 13y ago; this cycle's ask is 17400% above the opening price — seller raised mid-cycle; expect resistance to lowballs.
Risks & watch-outs
- Watch-outs: built in 1950 — expect roof / HVAC / electrical / plumbing capex.
- Climate carrying-cost: severe wind risk, 99% chance of damaging wind over 30y; extreme-heat days projected 7→22/yr by 2055 (HVAC capex compounding) — expect insurance premiums to compound above CPI over the hold.
Questions for the listing agent
- It's been on market 137 days. Have you received any prior offers? Is the seller open to a 12% concession, seller financing, or rate buy-down credit?
- Built in 1950 — when were the roof, HVAC, electrical panel, plumbing, and water heater last replaced?
- Why hasn't it sold? Are there any deal-killer items the seller is aware of (foundation, flood, title, zoning, code violations)?
- Is there a deadline driving the sale (1031 exchange, divorce, estate, relocation)? That informs how much negotiation room exists.
- Schools are F-rated, which usually means shorter tenancies and higher turnover. Who's the typical renter profile here, and what's been the actual vacancy rate?
- What's the average days-on-market for RENTAL listings here right now (not sales)? A rising rental-DOM trend means longer vacancies and softer asking-rent achievability than the comps imply.
- What's the recent tenant-quality profile in this submarket — average credit score on applications, eviction rate, late-payment / NSF rate, and stable-employment percentage? A property-management company in the area should have these aggregated.
- How much new apartment / multifamily construction is in the pipeline within 1–3 miles? Heavy new supply (>2% of stock underway) typically softens rents 12–24 months out; light construction supports rent growth.
Investment metrics
- 1% rule
- 1.41% ✓
- Cap rate
- 10.92%
- Cash-on-cash
- 16.53%
- DSCR
- 1.74
- GRM
- 5.9
CMA / ARV
- ARV (median comp)
- $93,753
- List price
- $140,000
- Delta
- 49.33%
- Verdict
- OVERPRICED
- Comps
- 2 within 2.0 mi
Projected returns pro-forma
-3.0% appreciation · 3.0% rent growth · sell at horizon
- IRR
- 7.7%
- Equity multiple
- 1.30×
- Total profit
- $11,767
- Equity at exit
- $20,874
- IRR
- 17.0%
- Equity multiple
- 2.40×
- Total profit
- $54,773
- Equity at exit
- $12,105
Cash invested: $39,200 (down + closing). Projections, not guarantees.
Landlord ↔ Tenant lean methodology
- Overall (STATE)
- 87 Strongly Landlord-Friendly
- State Texas
- 87 Strongly Landlord-Friendly · R+5
- County
- — inherits STATE
- City
- — inherits STATE
ZIP-level market 77488
- Home prices YoY
- -25.3%
- Active inventory
- 164
- Price-to-rent
- 11.9×
Monthly cashflow live
- Estimated rent
- $1,968 medium interval (Pro) →
- Mortgage (P&I)
- −$734
- Tax from tax record
- −$222 /mo · $2,666/yr
- Insurance
- −$58
- HOA
- −$0
- Vacancy / Maint / Mgmt
- −$413
- Net cashflow
- $540
Break-even live
2-unit breakdown (identical units grouped — click to expand)
| Units | Beds | Baths | Est. rent |
|---|---|---|---|
| 2× units | 2 | 2 | $1,968 |
| #1 | 2 | 2 | $984 |
| #2 | 2 | 2 | $984 |
| Total (2 units) | $1,968 | ||
UW: 25.0% down · 7.5% · 30yr · 1.5% tax · 5.0% vac · 8.0% maint · 8.0% mgmt
Financing live
Cash to close
- Down payment
- $35,000
- Closing costs
- $4,200
- Reserves months
- —
- Total cash needed
- —
Loan-product check · same deal, 3 products live
Conventional
25% down · 7.5% · 30yr
- Down + closing
- —
- Monthly P&I
- —
- Monthly cashflow
- —
- DSCR
- —
- Eligible?
- —
Personal DTI + credit; lowest rate.
DSCR
20% down · 8.5% · 30yr
- Down + closing
- —
- Monthly P&I
- —
- Monthly cashflow
- —
- DSCR
- —
- Eligible?
- —
No personal income docs; deal must DSCR.
Hard money
10% down · 12.0% · 12mo
- Down + closing
- —
- Monthly P&I
- —
- Monthly cashflow
- —
- DSCR
- —
- Eligible?
- —
Short-term bridge; refi at stabilization.
Rent comps 1 comps
| Address | Beds | Baths | Sqft | Rent | $/sqft | DOM | Units | Dist |
|---|---|---|---|---|---|---|---|---|
| 526 Wilkes St Wharton, TX | 2.0 | 1.0 | 950 | $1,000 | $1.05 | 44d | 1 | 1.12mi |
Listing history 29 events
-
2026-06-19days on market $140,000 Active 137 DOM
-
2026-06-18days on market $140,000 Active 136 DOM
-
2026-06-17days on market $140,000 Active 135 DOM
-
2026-06-16days on market $140,000 Active 134 DOM
-
2026-06-15days on market $140,000 Active 133 DOM
-
2026-06-14days on market $140,000 Active 131 DOM
-
2026-06-12days on market $140,000 Active 130 DOM
-
2026-06-09days on market $140,000 Active 127 DOM
-
2026-06-08days on market $140,000 Active 126 DOM
-
2026-06-07days on market $140,000 Active 125 DOM
-
2026-06-07days on market $140,000 Active 124 DOM
-
2026-06-02days on market $140,000 Active 120 DOM
-
2026-06-01days on market $140,000 Active 119 DOM
-
2026-05-31days on market $140,000 Active 118 DOM
-
2026-05-30days on market $140,000 Active 117 DOM
-
2026-05-14$800
-
2026-02-02$150,000 Active 633-char remark
Show marketing remark (633 chars)
This duplex is situated on a residential lot within the city limits of Wharton and features two separate units under one roof. The structure is a single-story building with a traditional layout, each unit offering its own private entry. The exterior includes a combination of siding materials, a pitched roofline, and a standard driveway approach from W Burleson Street. The lot provides a front yard area with additional open space toward the rear of the property. The surrounding neighborhood consists of single-family homes and small multifamily structures with convenient access to local schools, parks, and community amenities.
-
2025-12-17historical $800
-
2025-12-03$800
-
2025-06-30historical $850
-
2025-06-27$850
-
2024-11-18historical
-
2024-10-03price $159,000
-
2024-09-04price $169,000
-
2023-12-07$175,000 Active
-
2013-03-15soldstatus Sold
-
2013-03-07status Pending
-
2013-02-21historical
-
2013-01-14$79,900
ⓘ Source: listings_history table (triggers on properties + properties_extension) + one-shot
backfill from property_details.listing_events for pre-trigger history.
Tax reassessment forecast TX · Resets to sale price
- Current annual tax
- $2,666 · $222/mo
- Projected year-2 tax
- $2,666 · $222/mo
- Expected delta
- $0/yr ($0/mo · 0.0%)
ⓘ Screening estimate from a state-policy table — verify with the county assessor before closing.
Climate risk First Street
- Flood 1/10 Low FEMA zone X (shaded) · 0% chance over 30 yrs
- Wildfire 3/10 Moderate
- Heat 9/10 Extreme 7 d/yr ≥110°F today · 22 d/yr by 30 yrs out
- Wind 9/10 Extreme 99% chance of damaging wind over 30 yrs
- Air quality 1/10 Low 0 unhealthy d/yr today · 0 by 30 yrs out
Nearby sold comps map
Loading sold comps map…
Walkable amenities ~0.75 mi
Loading nearby amenities…
Taxation est. · year 1
- Rental income
- $23,616
- − Mortgage interest
- −$7,842
- − Property taxes
- −$2,666
- − Insurance
- −$700
- − Repairs & maintenance
- −$1,889
- − Management
- −$1,889
- − Depreciation
- −$4,073
- Taxable income
- $4,556
- Est. tax owed @ 24.0%
- −$1,094
- After-tax cash flow
- $5,387/yr
For passive investors: Depreciation is non-cash, so a rental often shows a tax loss while cash-flowing — sheltering income. Rental losses are passive: they offset passive income freely, and up to $25,000/yr can offset ordinary (W-2) income if you actively participate and your MAGI is under $100k (phasing out to $0 by $150k); unused losses carry forward. On sale, claimed depreciation is recaptured at up to 25%, and gains may owe capital-gains tax (a 1031 exchange can defer both). Figures are a year-1 estimate at your 24.0% rate — not tax advice; consult a CPA.
Schools (NCES district)
- District
- Wharton ISD
- NCES district ID
- 4845380
- Math proficiency
- 28% ▼ -3.00%
- Reading proficiency
- 31% ▬ 0.00%
- Median HH income
- $38,558
- Composite
- 24.69/100
- National rank
- #7617
- State rank
- #651 of 826 in TX
Livability — Wharton
- Score
- 65/100
- State rank
- #693
- US rank
- #12966
Category grades
Schools grade is shown separately in the Schools card above.
Census & demographics
- Census place
- Wharton, TX
- Population (ZIP)
- 14,129
Population outlook (Wharton County) Hauer SSP2
- Today (2025)
- 42,448 people
- By 2030
- 42,726 · +0.7%
- By 2040
- 43,042 · +1.4%
- By 2050
- 43,368 · +2.2%
- By 2075
- 44,962 · +5.9%
- By 2100
- 44,510 · +4.9%
Race, ethnicity, and origin ACS 2023
- Neighborhood character
- Diverse neighborhood (Simpson 0.68)
- Race & ethnicity
- Hispanic / Latino 38% White 36% Black 22% Two or more races 15% Asian 1%
- Hispanic origin (detail)
- Mexican 33% Puerto Rican 1%
- Common ancestry
- Scottish 2% Danish 2% Serbian 2%
- Foreign-born
- 7% · Canada
- Languages at home
- 81% English-only · Spanish 17% Other Indo-European 1%
Political lean MEDSL · Wharton
- 2024 margin
- Solid R (+51.8) · D 23.8% · R 75.6%
- 2008→2024 swing
- -20.7pp toward R · 2008: -31.2pp · 2024: -51.8pp
- All cycles
- 2024: R+51.8 2020: R+43.1 2016: R+40.2 2012: R+39.1 2008: R+31.2
Not yet ingested
- Civics
- —
Market trends
- HPI YoY
- ▼ -63.29%
- Current HPI
- 186.7798
- Rent YoY
- —
- Metro
- —
- State GDP YoY
- ▲ 3.95%
- F500 in state
- 110
Industry mix (Fortune 500 HQ in TX)
| Industry | F500 HQs | Revenue |
|---|---|---|
| Energy | 16 | $1,198B |
|
||
| Technology | 5 | $198B |
|
||
| Engineering / Construction | 4 | $72B |
|
||
| Energy Services | 3 | $60B |
|
||
| Utilities | 3 | $41B |
|
||
| Healthcare | 2 | $330B |
|
||
Price history
+87.7% since first listed14 events — show timeline
- 2026-05-14 Listed for Rent $800 HARMLS
- 2026-02-02 Listed $150,000 HARMLS
- 2025-12-17 Rental Removed $800 HARMLS
- 2025-12-03 Listed for Rent $800 HARMLS
- 2025-06-30 Rental Removed $850 HARMLS
- 2025-06-27 Listed for Rent $850 HARMLS
- 2024-11-18 Listing Removed — HARMLS
- 2024-10-03 Price Changed $159,000 HARMLS
- 2024-09-04 Price Changed $169,000 HARMLS
- 2023-12-07 Listed $175,000 HARMLS
- 2013-03-15 Sold (MLS) — HARMLS
- 2013-03-07 Pending — HARMLS
- 2013-02-21 Listing Removed — HARMLS
- 2013-01-14 Listed $79,900 HARMLS
Property tax history
+6.1%/yrLatest (2025): $2,666 · -3.5% YoY. Source: county tax records.
Cash-flow waterfall
monthlySold comps — $/sqft
last 12 mo · ≤1 miLoading sold comps…