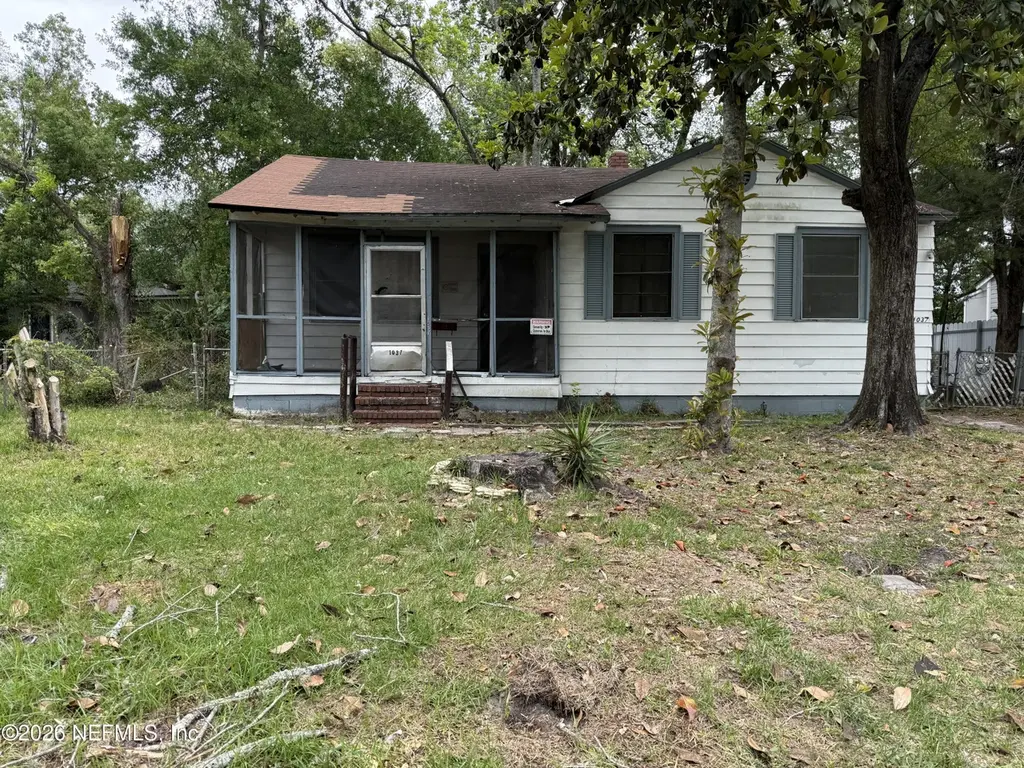
1037 Westbrook Cir W · Jacksonville, FL
Flood risk 1/10 · Minimal
- FEMA flood zone
- X (unshaded)
- Chance of flooding over 30 yrs
- 0.0%
- Est. flood insurance / yr
- $507 – $1,088
Fire risk 1/10 · Minimal
- Est. fire insurance / yr
- $947 – $1,759
Heat risk 9/10 · Severe
- Hot days now (above 107°F)
- 6 days/yr
- Hot days in 30 yrs
- 17 days/yr
Wind risk 9/10 · Severe
- Chance of severe wind over 30 yrs
- 99.0%
Air-quality risk 5/10 · Moderate
- Unhealthy air days now
- 7 days/yr
- Unhealthy air days in 30 yrs
- 7 days/yr
Risk factors via First Street. Map © Google.
Why this score? — see what drove the B+ grade
The composite is a weighted blend of 9 inputs, each scored 0–100. Each bar is that input's sub-score; the figure is the points it added to the 100-point composite (weight × sub-score).
- Cash flow +30.0/30.0
- ARV discount +15.0/15.0
- DSCR +10.0/10.0
- 1% rule +9.6/10.0
- Livability +4.2/5.0
- Schools +3.9/10.0
- Rent growth +3.0/5.0
- Condition / age +2.5/5.0
- Appreciation +0.0/10.0
$85,000
🖨 Deal sheet (PDF) 📄 Offer letter ✓ Due diligence
Listing remarks
* NO DAISY-CHAIN, NO WHOLESALERS - END BUYERS ONLY & MUST SHOW PROOF OF FUNDS - PLEASE READ THE OFFER INSTRUCTIONS * Investor Special with Endless Potential! Unlock the opportunity to add a high-potential asset to your portfolio with this 3-bedroom, 1-bathroom home. Whether you're looking to renovate and flip or secure your next income-producing rental, this property offers a solid foundation and strong upside. Bring your vision and capitalize on the potential--properties like this don't last long! Seller to make no repairs.
Key facts
- 4,791 sq ft lot
- Built 1948
- Listed 47 days
Property features AI
Finance
- HOA & community: Not a senior community
Exterior
- Parking: Off-street parking
- Utilities: Public sewer; Electricity connected; Sewer connected; Water connected
- Home design: Single family residence; One level; Entry on level 1
- Construction: Wood siding and other construction materials; Shingle roof
- Exterior features: Covered front porch; Chain link and other fencing; City street frontage; Concrete road surface
Interior
- Kitchen: Electric oven; Electric range; Refrigerator
- Bedrooms: 3 bedrooms
- Flooring: Carpet; Tile; Vinyl; Wood
- Bathrooms: 1 full bathroom
- Heating & cooling: Wall/window cooling units
- Interior features: Primary bathroom with tub and shower; Primary bedroom on the main floor
Neighborhood map
What this means for you Summary
Snapshot
- This is a 3-bed/1.0-bath single-family listed at $85k.
Deal economics
- At list price, monthly cash flow is $377 ($5k/yr) — positive.
- The deal already cash-flows at list — no discount required.
- Meets the 1% rule at list price ($1k rent vs $85k).
- Recommended offer: $82k (3.0% below list) — sets the bar for market timing.
- Cap rate 11.6% vs local median 3.9% in Jacksonville — top-decile yield for the area; either an underpriced asset or a hidden risk that comps aren't pricing in. Stress-test before assuming the spread holds.
Location & tenants
- Location reads 83/100 on livability (#50 in FL, #911 nationally) — a professional / high-income tenant draw. Strengths: amenities A+, commute A+, housing A+.
- Duval (urban): math 46% / reading 45% proficiency, ranked #48 of 73 in FL (top 66%) — families likely to look elsewhere, expect single-tenant / working-renter base with shorter leases.
- Zoned schools: Annie R. Morgan Elementary School (math 22% / reading 17%, grade F, #2,105 of 2,144 statewide, top 98%, 212 students, 82% FRL); Lake Shore Middle School (math 25% / reading 22%, grade F, #536 of 571 statewide, top 95%, 972 students, 75% FRL); William M. Raines High School (math 14% / reading 13%, grade F, #616 of 667 statewide, top 92%, 1,217 students, 78% FRL) — zoned schools average 79% FRL vs 49% district-wide (29 pts higher); higher-poverty schools than district average — tighter screening recommended.
- Zoned-school proficiency averages 19% at this address vs 46% district-wide (-27 pts) — the specific schools serving this property underperform the Duval average; the district grade overstates school quality for this exact location.
- Market conditions: Rents rising (+1.8%/yr); 399 active listings in the ZIP; 40 comparable units currently listed for rent nearby; rentals at typical pace (median 22d on market — plan ~3-4 weeks tenant-placement turnaround); lower-income renter base — watch delinquency; 6,503 units permitted in Duval County in 2024 (1,131 in 5+ unit buildings).
Forward outlook
- Local home prices are declining (-3.0%/yr); year-one equity from $588 of loan paydown is wiped out by about $3k of value loss. Plan a longer hold.
- Duval County population projected at +19% by 2050 — long-run rental-demand tailwind backs the buy-and-hold thesis.
- At projected returns (-3.0% appreciation + 1.8% rent growth), your $24k cash investment doubles in ~7 years — after that, you're playing with house money.
Negotiation context
- It's been on market 47 days — a 3% lower offer ($82k) is reasonable based on typical stale-listing flexibility.
- Current owner paid $55k; list at $85k implies a 55% gain — meaningful room to come down on a strong offer.
Risks & watch-outs
- Watch-outs: built in 1948 — expect roof / HVAC / electrical / plumbing capex.
- Climate carrying-cost: severe wind risk, 99% chance of damaging wind over 30y; extreme-heat days projected 6→17/yr by 2055 (HVAC capex compounding) — expect insurance premiums to compound above CPI over the hold.
Questions for the listing agent
- It's been on market 47 days. Have you received any prior offers? Is the seller open to a 3% concession, seller financing, or rate buy-down credit?
- Built in 1948 — when were the roof, HVAC, electrical panel, plumbing, and water heater last replaced?
- Is there a deadline driving the sale (1031 exchange, divorce, estate, relocation)? That informs how much negotiation room exists.
- Schools are B-rated — typically a magnet for longer-tenancy family renters. What's the average tenant stay here, and is there a school-zone premium baked into asking?
- What's the average days-on-market for RENTAL listings here right now (not sales)? A rising rental-DOM trend means longer vacancies and softer asking-rent achievability than the comps imply.
- What's the recent tenant-quality profile in this submarket — average credit score on applications, eviction rate, late-payment / NSF rate, and stable-employment percentage? A property-management company in the area should have these aggregated.
- How much new for-sale + rental construction is in the pipeline within 1–3 miles? Heavy new supply typically softens prices + rents 12–24 months out; constrained supply supports both.
Investment metrics
- 1% rule
- 1.46% ✓
- Cap rate
- 11.61%
- Cash-on-cash
- 19.00%
- DSCR
- 1.85
- GRM
- 5.7
CMA / ARV
- ARV (on-the-fly)
- $102,604
- Comps found
- 12
Show comp detail 12 sales within ~0.75 mi
| Address | Dist | Beds/Ba | Sqft | Sold | Price | $/sf | Match |
|---|---|---|---|---|---|---|---|
| 760 Westbrook Rd | 0.28mi | 2/1.0 (-1) | 898 (-1%) | 2mo | $101,150 | $113 | 78 |
| 2081 Baldwin St | 0.44mi | 3/1.0 | 915 (+1%) | 2mo | $47,000 | $51 | 77 |
| 2108 Yulee St | 0.38mi | 3/1.0 | 873 (-4%) | 0mo | $117,000 | $134 | 75 |
| 2202 W 1st St | 0.22mi | 3/1.0 | 988 (+9%) | 2mo | $56,900 | $58 | 74 |
| 2325 Westbrook Cir N | 0.04mi | 3/2.0 | 812 (-11%) | 6mo | $125,500 | $155 | 71 |
| 1073 Huron St | 0.69mi | 3/1.0 | 916 (+1%) | 3mo | $77,000 | $84 | 64 |
| 2067 Woodside St | 0.44mi | 3/1.0 | 1,013 (+12%) | 1mo | $34,900 | $34 | 59 |
| 2070 Woodside St | 0.44mi | 3/1.0 | 800 (-12%) | 4mo | $116,500 | $146 | 56 |
| 1023 Ontario St | 0.56mi | 2/1.0 (-1) | 840 (-8%) | 2mo | $33,000 | $39 | 55 |
| 2630 Beaverbrook Pl | 0.45mi | 2/1.0 (-1) | 800 (-12%) | 4mo | $176,500 | $221 | 51 |
| 2667 Amy St | 0.62mi | 3/1.0 | 1,038 (+14%) | 0mo | $117,000 | $113 | 47 |
| 2002 Baldwin St | 0.55mi | 2/1.0 (-1) | 780 (-14%) | 6mo | $87,500 | $112 | 41 |
Match score weights: distance 35% · size 25% · config 20% · recency 20%. Top-matched comps best support the ARV.
Projected returns pro-forma
-3.0% appreciation · 1.81% rent growth · sell at horizon
- IRR
- 9.5%
- Equity multiple
- 1.37×
- Total profit
- $8,790
- Equity at exit
- $12,674
- IRR
- 17.6%
- Equity multiple
- 2.38×
- Total profit
- $32,800
- Equity at exit
- $7,349
Cash invested: $23,800 (down + closing). Projections, not guarantees.
Landlord ↔ Tenant lean methodology
- Overall (STATE)
- 87 Strongly Landlord-Friendly
- State Florida
- 87 Strongly Landlord-Friendly · R+3
- County
- — inherits STATE
- City
- — inherits STATE
ZIP-level market 32209
- Home prices YoY
- -22.1%
- Rents YoY
- 1.8%
- Active inventory
- 399
- Price-to-rent
- 5.7×
Monthly cashflow live
- Estimated rent
- $1,239 high interval (Pro) →
- Mortgage (P&I)
- −$446
- Tax from tax record
- −$121 /mo · $1,451/yr
- Insurance
- −$35
- HOA
- −$0
- Vacancy / Maint / Mgmt
- −$260
- Net cashflow
- $377
Break-even live
Sensitivity live
| Price | -10% $425 | -5% $401 | +0% $377 | +5% $353 | +10% $329 |
|---|---|---|---|---|---|
| Rent | -10% $279 | -5% $328 | +0% $377 | +5% $426 | +10% $475 |
| Rate | -1.0pp $420 | -0.5pp $398 | base $377 | +0.5pp $355 | +1.0pp $332 |
UW: 25.0% down · 7.5% · 30yr · 1.5% tax · 5.0% vac · 8.0% maint · 8.0% mgmt
Financing live
Cash to close
- Down payment
- $21,250
- Closing costs
- $2,550
- Reserves months
- —
- Total cash needed
- —
Loan-product check · same deal, 3 products live
Conventional
25% down · 7.5% · 30yr
- Down + closing
- —
- Monthly P&I
- —
- Monthly cashflow
- —
- DSCR
- —
- Eligible?
- —
Personal DTI + credit; lowest rate.
DSCR
20% down · 8.5% · 30yr
- Down + closing
- —
- Monthly P&I
- —
- Monthly cashflow
- —
- DSCR
- —
- Eligible?
- —
No personal income docs; deal must DSCR.
Hard money
10% down · 12.0% · 12mo
- Down + closing
- —
- Monthly P&I
- —
- Monthly cashflow
- —
- DSCR
- —
- Eligible?
- —
Short-term bridge; refi at stabilization.
Rent comps 40 comps
| Address | Beds | Baths | Sqft | Rent | $/sqft | DOM | Units | Dist |
|---|---|---|---|---|---|---|---|---|
| 2325 Westbrook Cir N Jacksonville, FL | 3.0 | 2.0 | 812 | $1,200 | $1.48 | 25d | 1 | 0.05mi |
| 1213 Moat St Jacksonville, FL | 2.0 | 2.5 | 1022 | $1,283 | $1.26 | 18d | 1 | 0.21mi |
| 2154 Placeda St Jacksonville, FL | 4.0 | 1.5 | 1124 | $1,500 | $1.33 | 22d | 1 | 0.26mi |
| 2128 Woodside St Jacksonville, FL | 2.0 | 1.0 | 776 | $895 | $1.15 | 25d | 1 | 0.41mi |
| 2587 Orchard St Jacksonville, FL | 2.0 | 2.0 | 992 | $1,295 | $1.31 | 9d | 1 | 0.42mi |
| 1979 Yulee St Jacksonville, FL | 3.0 | 2.0 | 1050 | $1,500 | $1.43 | 25d | 1 | 0.57mi |
| 841 Ontario St Jacksonville, FL | 2.0 | 1.0 | 1000 | $1,285 | $1.28 | 25d | 1 | 0.59mi |
| 2011 W 5th St Jacksonville, FL | 3.0 | 1.0 | 988 | $1,150 | $1.16 | 25d | 1 | 0.59mi |
| 912 Huron St Jacksonville, FL | 2.0 | 1.0 | 900 | $1,100 | $1.22 | 16d | 1 | 0.70mi |
| 2851 Sophia St Jacksonville, FL | 2.0 | 1.0 | 846 | $1,000 | $1.18 | 25d | 3 | 0.76mi |
| 2852 W 1st St Jacksonville, FL | 2.0 | 1.0 | 800 | $895 | $1.12 | 9d | 1 | 0.77mi |
| 2862 W 1st St Unit 1 Jacksonville, FL | 2.0 | 1.0 | 800 | $895 | $1.12 | 16d | 1 | 0.79mi |
| 2862 W 1st St Jacksonville, FL | 2.0 | 1.0 | 800 | $895 | $1.12 | 5d | 1 | 0.79mi |
| 1934 W 6th St Jacksonville, FL | 3.0 | 1.0 | 948 | $1,125 | $1.19 | 25d | 1 | 0.80mi |
| 1911 W 3rd St Jacksonville, FL | 3.0 | 1.0 | 912 | $1,050 | $1.15 | 5d | 1 | 0.80mi |
| 1721 Campus St Jacksonville, FL | 3.0 | 2.0 | 909 | $1,400 | $1.54 | 25d | 1 | 0.80mi |
| 2913 W 2nd St Jacksonville, FL | 2.0 | 1.0 | 720 | $1,000 | $1.39 | 3d | 1 | 0.84mi |
| 3035 Fitzgerald St Jacksonville, FL | 2.0 | 1.0 | 900 | $1,021 | $1.13 | 4d | 1 | 0.84mi |
| 1866 W 6th St Jacksonville, FL | 3.0 | 1.0 | 1064 | $1,120 | $1.05 | 5d | 1 | 0.90mi |
| 1319 Woods St Jacksonville, FL | 3.0 | 2.0 | 1103 | $1,221 | $1.11 | 25d | 1 | 0.91mi |
| 1751 Broadway Ave Jacksonville, FL | 2.0 | 1.0 | 1000 | $1,525 | $1.52 | 5d | 1 | 0.91mi |
| 1037 Detroit St Jacksonville, FL | 3.0 | 2.0 | 912 | $1,250 | $1.37 | 3d | 1 | 0.91mi |
| 2008 Palafox St Jacksonville, FL | 2.0 | 1.0 | 750 | $950 | $1.27 | 22d | 1 | 0.91mi |
| 2012 Palafox St Jacksonville, FL | 2.0 | 1.0 | 750 | $950 | $1.27 | 21d | 1 | 0.92mi |
| 3118 Dignan St Jacksonville, FL | 4.0 | 2.0 | 1103 | $1,148 | $1.04 | 3d | 1 | 0.94mi |
| 2965 Sunset St Jacksonville, FL | 3.0 | 2.0 | 1056 | $1,375 | $1.30 | 5d | 1 | 0.97mi |
| 2965 Sunset St Jacksonville, FL | 3.0 | 1.5 | 1056 | $1,375 | $1.30 | 9d | 1 | 0.97mi |
| 2000 Palafox St Jacksonville, FL | 2.0 | 1.0 | 750 | $950 | $1.27 | 25d | 1 | 0.98mi |
| 2002 Palafox St Jacksonville, FL | 2.0 | 1.0 | 750 | $950 | $1.27 | 22d | 2 | 0.98mi |
| 2004 Palafox St Jacksonville, FL | 2.0 | 1.0 | 750 | $950 | $1.27 | 22d | 1 | 0.98mi |
| 371 Smith St Jacksonville, FL | 3.0 | 2.0 | 1050 | $1,325 | $1.26 | 5d | 1 | 0.99mi |
| 3012 Imperial St Jacksonville, FL | 3.0 | 1.0 | 1089 | $1,395 | $1.28 | 25d | 1 | 0.99mi |
| 1227 Dena St Jacksonville, FL | 3.0 | 1.0 | 1033 | $1,325 | $1.28 | 25d | 1 | 0.99mi |
| 2020 Palafox St Jacksonville, FL | 2.0 | 1.0 | 750 | $950 | $1.27 | 25d | 1 | 1.00mi |
| 2134 Danson St Jacksonville, FL | 3.0 | 1.5 | 1080 | $995 | $0.92 | 4d | 1 | 1.00mi |
| 2134 Danson St Jacksonville, FL | 3.0 | 1.5 | 1080 | $995 | $0.92 | 5d | 1 | 1.00mi |
| 420 Sunshine St Jacksonville, FL | 3.0 | 2.0 | 1050 | $1,350 | $1.29 | 3d | 1 | 1.01mi |
| 2036 W 11th St Jacksonville, FL | 2.0 | 2.5 | 698 | $1,250 | $1.79 | 22d | 1 | 1.02mi |
| 2549 Calvin St Jacksonville, FL | 2.0 | 1.0 | 658 | $600 | $0.91 | 18d | 1 | 1.02mi |
| 2100 Palafox St Jacksonville, FL | 2.0 | 1.0 | 750 | $975 | $1.30 | 25d | 1 | 1.02mi |
Listing history 14 events
-
2026-06-21statusdays on market $85,000 Active 47 DOM
-
2026-06-13statusdays on market $85,000 Pending 46 DOM
-
2026-06-10days on market $85,000 Active 43 DOM
-
2026-06-08days on market $85,000 Active 42 DOM
-
2026-06-07days on market $85,000 Active 41 DOM
-
2026-06-05days on market $85,000 Active 38 DOM
-
2026-06-03days on market $85,000 Active 37 DOM
-
2026-06-02days on market $85,000 Active 36 DOM
-
2026-06-01days on market $85,000 Active 35 DOM
-
2026-05-31days on market $85,000 Active 34 DOM
-
2026-05-22price $85,000
-
2026-04-27$107,000 Active
-
2026-04-27soldstatus $55,000
-
1975-10-31soldstatus $8,500
ⓘ Source: listings_history table (triggers on properties + properties_extension) + one-shot
backfill from property_details.listing_events for pre-trigger history.
Tax reassessment forecast FL · Resets to sale price
- Current annual tax
- $1,451 · $121/mo
- Projected year-2 tax
- $1,451 · $121/mo
- Expected delta
- $0/yr ($0/mo · 0.0%)
ⓘ Screening estimate from a state-policy table — verify with the county assessor before closing.
Climate risk First Street
- Flood 1/10 Low FEMA zone X (unshaded) · 0% chance over 30 yrs
- Wildfire 1/10 Low
- Heat 9/10 Extreme 6 d/yr ≥107°F today · 17 d/yr by 30 yrs out
- Wind 9/10 Extreme 99% chance of damaging wind over 30 yrs
- Air quality 5/10 Major 7 unhealthy d/yr today · 7 by 30 yrs out
Nearby sold comps map
Loading sold comps map…
Walkable amenities ~0.75 mi
Loading nearby amenities…
Taxation est. · year 1
- Rental income
- $14,870
- − Mortgage interest
- −$4,761
- − Property taxes
- −$1,451
- − Insurance
- −$425
- − Repairs & maintenance
- −$1,190
- − Management
- −$1,190
- − Depreciation
- −$2,473
- Taxable income
- $3,381
- Est. tax owed @ 24.0%
- −$811
- After-tax cash flow
- $3,711/yr
For passive investors: Depreciation is non-cash, so a rental often shows a tax loss while cash-flowing — sheltering income. Rental losses are passive: they offset passive income freely, and up to $25,000/yr can offset ordinary (W-2) income if you actively participate and your MAGI is under $100k (phasing out to $0 by $150k); unused losses carry forward. On sale, claimed depreciation is recaptured at up to 25%, and gains may owe capital-gains tax (a 1031 exchange can defer both). Figures are a year-1 estimate at your 24.0% rate — not tax advice; consult a CPA.
Schools (NCES district)
- District
- Duval
- NCES district ID
- 1200480
- Math proficiency
- 46% ▼ -11.00%
- Reading proficiency
- 45% ▼ -4.00%
- Median HH income
- $48,987
- Composite
- 38.97/100
- National rank
- #4076
- State rank
- #48 of 73 in FL
Livability — Jacksonville
- Score
- 83/100
- State rank
- #50
- US rank
- #911
Category grades
Schools grade is shown separately in the Schools card above.
Census & demographics
- Census place
- Jacksonville, FL
- County
- Duval County · 1,015,274 people
- City population
- 979,034
- Metro
- Jacksonville, FL
- Population (ZIP)
- 34,657
- Household income
- $30,514
- Rent vs Own
- Severe rent burden
- 2921.0
Population outlook (Duval County) Hauer SSP2
- Today (2025)
- 1,013,010 people
- By 2030
- 1,059,228 · +4.6%
- By 2040
- 1,141,439 · +12.7%
- By 2050
- 1,205,258 · +19.0%
- By 2075
- 1,324,282 · +30.7%
- By 2100
- 1,319,620 · +30.3%
Race, ethnicity, and origin ACS 2023
- Neighborhood character
- Predominantly Black (88%)
- Race & ethnicity
- Black 88% White 5% Hispanic / Latino 5% Two or more races 2%
- Hispanic origin (detail)
- Puerto Rican 3%
- Common ancestry
- Hispanic 1% Romanian 1%
- Foreign-born
- 3% · Canada
- Languages at home
- 95% English-only · Spanish 4% French/Haitian/Cajun 1%
Political lean MEDSL · Duval
- 2024 margin
- Toss-up / Even · D 48.7% · R 50.1% · Other 1.2%
- 2008→2024 swing
- +0.4pp no change · 2008: -1.9pp · 2024: -1.5pp
- All cycles
- 2024: R+1.5 2020: D+3.8 2016: R+1.5 2012: R+3.6 2008: R+1.9
Not yet ingested
- Civics
- —
Market trends
- HPI YoY
- ▼ -53.92%
- Current HPI
- 189.5977
- Rent YoY
- ▲ 1.81%
- Metro
- Jacksonville, FL
- State GDP YoY
- ▲ 3.28%
- F500 in state
- 36
Industry mix (Fortune 500 HQ in FL)
| Industry | F500 HQs | Revenue |
|---|---|---|
| Industrial Technology | 2 | $29B |
|
||
| Insurance | 2 | $17B |
|
||
| Retail | 1 | $60B |
|
||
| Technology Distribution | 1 | $58B |
|
||
| Homebuilding | 1 | $35B |
|
||
| Technology Manufacturing | 1 | $35B |
|
||
Price history
+900.0% since first listed4 events — show timeline
- 2026-05-22 Price Changed $85,000 realMLS
- 2026-04-27 Sold (Public Records) $55,000 Public Records
- 2026-04-27 Listed $107,000 realMLS
- 1975-10-31 Sold (Public Records) $8,500 Public Records
Property tax history
+15.5%/yrLatest (2025): $1,451 · +22.2% YoY. Source: county tax records.
Cash-flow waterfall
monthlySold comps — $/sqft
last 12 mo · ≤1 miLoading sold comps…