20843 Waalew · Apple Valley, CA
Flood risk 1/10 · Minimal
- FEMA flood zone
- X (unshaded)
- Chance of flooding over 30 yrs
- 0.0%
- Est. flood insurance / yr
- $507 – $1,088
Fire risk 6/10 · Moderate
- Est. fire insurance / yr
- $659 – $1,223
Heat risk 7/10 · Major
- Hot days now (above 100°F)
- 4 days/yr
- Hot days in 30 yrs
- 10 days/yr
Wind risk 1/10 · Minimal
- Chance of severe wind over 30 yrs
- —
Air-quality risk 9/10 · Severe
- Unhealthy air days now
- 21 days/yr
- Unhealthy air days in 30 yrs
- 26 days/yr
Risk factors via First Street. Map © Google.
Why this score? — see what drove the C+ grade
The composite is a weighted blend of 9 inputs, each scored 0–100. Each bar is that input's sub-score; the figure is the points it added to the 100-point composite (weight × sub-score).
- Cash flow +30.0/30.0
- 1% rule +10.0/10.0
- DSCR +10.0/10.0
- Rent growth +3.9/5.0
- Schools +3.1/10.0
- Livability +3.1/5.0
- Condition / age +2.5/5.0
- ARV discount +0.0/15.0
- Appreciation +0.0/10.0
$107,000
🖨 Deal sheet 📄 Offer letter ✓ Due diligence
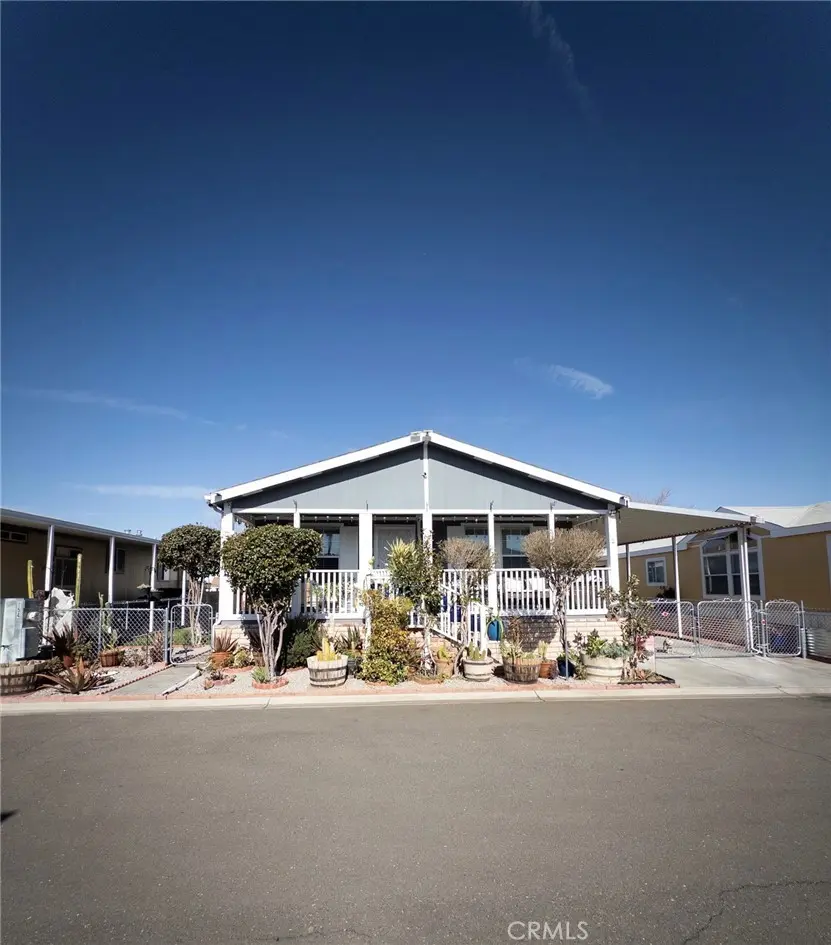
Listing remarks MLS
Wonderful 3 bedroom 2 bath situated in a wonderful park. This well kept mobile home shows extremely well. The park has clubhouse and pool very near the home.
Key facts
- Built 1990
- Listed 30 days
Neighborhood map
What this means for you Summary
Snapshot
- This is a 3-bed/2.0-bath land listed at $107k.
Deal economics
- At list price, monthly cash flow is $1k ($13k/yr) — positive.
- The deal already cash-flows at list — no discount required.
- Meets the 1% rule at list price ($2k rent vs $107k).
- Recommended offer: $104k (3.0% below list) — sets the bar for market timing.
- Cap rate 18.1% vs local median 3.5% in Apple Valley — top-decile yield for the area; either an underpriced asset or a hidden risk that comps aren't pricing in. Stress-test before assuming the spread holds.
Location & tenants
- Location reads 61/100 on livability (#532 in CA) — a middle-class / working-renter tenant base. Strengths: housing A+, commute B+; Watch: employment D+, schools F, crime D-.
- Apple Valley Unified (suburban): math 25% / reading 40% proficiency, ranked #955 of 1,400 in CA (top 68%) — families likely to look elsewhere, expect single-tenant / working-renter base with shorter leases; 60% free/reduced lunch — lower-income household profile, screen leases tightly.
- Market conditions: Rents rising fast (+5.5%/yr); 526 active listings in the ZIP; solid renter incomes; 5,458 units permitted in San Bernardino County in 2024 (1,500 in 5+ unit buildings).
- This rent runs 35% of the median local income ($77k/yr) — at the standard rent-burdened threshold; future hikes will face affordability resistance.
Forward outlook
- Local home prices are declining (-3.0%/yr); year-one equity from $740 of loan paydown is wiped out by about $3k of value loss. Plan a longer hold.
- San Bernardino County population projected at +15% by 2050 — modest demand growth; plan on rents tracking national, not racing it.
- At projected returns (-3.0% appreciation + 5.5% rent growth), your $30k cash investment doubles in ~3 years — after that, you're playing with house money.
Negotiation context
- It's been on market 31 days — a 3% lower offer ($104k) is reasonable based on typical stale-listing flexibility.
- 12 sale attempts since 19y ago with the ask held roughly flat each time — persistent listings suggest the price (not the market) is what's stuck; bring a comps-based counter.
Risks & watch-outs
- Climate carrying-cost: major wildfire risk; extreme-heat days projected 4→10/yr by 2055 (HVAC capex compounding) — expect insurance premiums to compound above CPI over the hold.
Questions for the listing agent
- It's been on market 31 days. Have you received any prior offers? Is the seller open to a 3% concession, seller financing, or rate buy-down credit?
- Is there a deadline driving the sale (1031 exchange, divorce, estate, relocation)? That informs how much negotiation room exists.
- Schools are F-rated, which usually means shorter tenancies and higher turnover. Who's the typical renter profile here, and what's been the actual vacancy rate?
- Crime grade is D in this area — have there been break-ins, vandalism, or insurance claims at this property in the last 3 years? What carrier currently insures it and at what premium?
- What's the average days-on-market for RENTAL listings here right now (not sales)? A rising rental-DOM trend means longer vacancies and softer asking-rent achievability than the comps imply.
- What's the recent tenant-quality profile in this submarket — average credit score on applications, eviction rate, late-payment / NSF rate, and stable-employment percentage? A property-management company in the area should have these aggregated.
- How much new for-sale + rental construction is in the pipeline within 1–3 miles? Heavy new supply typically softens prices + rents 12–24 months out; constrained supply supports both.
Investment metrics
- 1% rule
- 2.12% ✓
- Cap rate
- 18.13%
- Cash-on-cash
- 42.28%
- DSCR
- 2.88
- GRM
- 3.9
CMA / ARV
- ARV (median comp)
- $80,371
- List price
- $107,000
- Delta
- 80.29%
- Verdict
- OVERPRICED
- Comps
- 20 within 1.0 mi
Projected returns pro-forma
-3.0% appreciation · 5.48% rent growth · sell at horizon
- IRR
- 41.8%
- Equity multiple
- 2.86×
- Total profit
- $55,745
- Equity at exit
- $15,954
- IRR
- 49.1%
- Equity multiple
- 6.35×
- Total profit
- $160,348
- Equity at exit
- $9,251
Cash invested: $29,960 (down + closing). Projections, not guarantees.
Landlord ↔ Tenant lean methodology
- Overall (STATE)
- 18 Strongly Tenant-Friendly
- State California
- 18 Strongly Tenant-Friendly · D+13
- County
- — inherits STATE
- City
- — inherits STATE
ZIP-level market 92307
- Rents YoY
- 5.5%
- Active inventory
- 526
- Price-to-rent
- 3.9×
Monthly cashflow live
- Estimated rent
- $2,272 medium interval (Pro) →
- Mortgage (P&I)
- −$561
- Tax est. 1.5%
- −$134 /mo · $1,605/yr
- Insurance
- −$45
- HOA
- −$0
- Vacancy / Maint / Mgmt
- −$477
- Net cashflow
- $1,056
Break-even live
UW: 25.0% down · 7.5% · 30yr · 1.5% tax · 5.0% vac · 8.0% maint · 8.0% mgmt
Financing live
Cash to close
- Down payment
- $26,750
- Closing costs
- $3,210
- Reserves months
- —
- Total cash needed
- —
Loan-product check · same deal, 3 products live
Conventional
25% down · 7.5% · 30yr
- Down + closing
- —
- Monthly P&I
- —
- Monthly cashflow
- —
- DSCR
- —
- Eligible?
- —
Personal DTI + credit; lowest rate.
DSCR
20% down · 8.5% · 30yr
- Down + closing
- —
- Monthly P&I
- —
- Monthly cashflow
- —
- DSCR
- —
- Eligible?
- —
No personal income docs; deal must DSCR.
Hard money
10% down · 12.0% · 12mo
- Down + closing
- —
- Monthly P&I
- —
- Monthly cashflow
- —
- DSCR
- —
- Eligible?
- —
Short-term bridge; refi at stabilization.
Listing history 45 events
-
2026-06-18days on market $107,000 Active 31 DOM
-
2026-06-17days on market $107,000 Active 30 DOM
-
2026-06-16days on market $107,000 Active 29 DOM
-
2026-06-15days on market $107,000 Active 28 DOM
-
2026-06-13days on market $107,000 Active 26 DOM
-
2026-06-13pricedays on market $107,000 Active 25 DOM
-
2026-06-09days on market $110,000 Active 22 DOM
-
2026-06-08days on market $110,000 Active 21 DOM
-
2026-06-07days on market $110,000 Active 20 DOM
-
2026-06-04days on market $110,000 Active 17 DOM
-
2026-06-03days on market $110,000 Active 16 DOM
-
2026-06-02days on market $110,000 Active 15 DOM
-
2026-06-01days on market $110,000 Active 14 DOM
-
2026-05-31days on market $110,000 Active 13 DOM
-
2026-05-18$110,000 Active 157-char remark
Show marketing remark (157 chars)
Wonderful 3 bedroom 2 bath situated in a wonderful park. This well kept mobile home shows extremely well. The park has clubhouse and pool very near the home.
-
2026-03-22price $144,900 781-char remark
Show marketing remark (781 chars)
$10,000 Price improvement!! Don't Miss this opportunity to own this meticulously maintained manufactured home offers 3 bedrooms and 2bathrooms with approximately 1400 sq ft of comfortable living space. Pride of ownership shines throughout, making this home truly move-in ready for its next owner. The well-kept interior and exterior create a warm, inviting space. Perfect for a first-time buyer, downsizer, or anyone looking for affordable homeownership in a well-established community. Located in the desirable Los Ranchos Mobile Home Park in Apple Valley, with convenient access to shopping, dining, and everyday amenities. Land is leased; buyer to obtain park approval. Space rent and park rules to be verified directly with park management. Cash or mobile home financing only.
-
2026-02-05$155,000 Active 781-char remark
Show marketing remark (781 chars)
$10,000 Price improvement!! Don't Miss this opportunity to own this meticulously maintained manufactured home offers 3 bedrooms and 2bathrooms with approximately 1400 sq ft of comfortable living space. Pride of ownership shines throughout, making this home truly move-in ready for its next owner. The well-kept interior and exterior create a warm, inviting space. Perfect for a first-time buyer, downsizer, or anyone looking for affordable homeownership in a well-established community. Located in the desirable Los Ranchos Mobile Home Park in Apple Valley, with convenient access to shopping, dining, and everyday amenities. Land is leased; buyer to obtain park approval. Space rent and park rules to be verified directly with park management. Cash or mobile home financing only.
-
2025-12-22soldstatus $152,000 Closed Sale
-
2025-10-20historical
-
2025-10-20$152,000
-
2023-09-17historical
-
2023-09-01status Active
-
2023-06-30status Active
-
2022-12-11$70,000 Active
-
2022-07-22soldstatus $120,000 Closed Sale
-
2022-06-02status Pending Sale
-
2022-05-20price $125,000
-
2022-05-20$12,500 Active
-
2020-11-27soldstatus $25,000
-
2020-10-19$19,900
-
2017-07-14historical
-
2016-07-15$95,000
-
2014-03-21historical
-
2013-06-21$30,000
-
2013-05-03soldstatus $6,500
-
2013-04-08$7,950
-
2011-10-27soldstatus $5,398,500
-
2011-06-17soldstatus $25,000
-
2007-03-23historical
-
2007-01-01$103,000
-
2001-04-02soldstatus $29,900
-
2001-03-15soldstatus $27,000
-
1999-06-08soldstatus $10,500
-
1999-02-10soldstatus $17,000
-
1995-07-31soldstatus $1,300,000
ⓘ Source: listings_history table (triggers on properties + properties_extension) + one-shot
backfill from property_details.listing_events for pre-trigger history.
Climate risk First Street
- Flood 1/10 Low FEMA zone X (unshaded) · 0% chance over 30 yrs
- Wildfire 6/10 Major
- Heat 7/10 Severe 4 d/yr ≥100°F today · 10 d/yr by 30 yrs out
- Wind 1/10 Low
- Air quality 9/10 Extreme 21 unhealthy d/yr today · 26 by 30 yrs out
Nearby sold comps map
Loading sold comps map…
Walkable amenities ~0.75 mi
Loading nearby amenities…
Taxation est. · year 1
- Rental income
- $27,268
- − Mortgage interest
- −$5,994
- − Property taxes
- −$1,605
- − Insurance
- −$535
- − Repairs & maintenance
- −$2,181
- − Management
- −$2,181
- − Depreciation
- −$3,113
- Taxable income
- $11,659
- Est. tax owed @ 24.0%
- −$2,798
- After-tax cash flow
- $9,870/yr
For passive investors: Depreciation is non-cash, so a rental often shows a tax loss while cash-flowing — sheltering income. Rental losses are passive: they offset passive income freely, and up to $25,000/yr can offset ordinary (W-2) income if you actively participate and your MAGI is under $100k (phasing out to $0 by $150k); unused losses carry forward. On sale, claimed depreciation is recaptured at up to 25%, and gains may owe capital-gains tax (a 1031 exchange can defer both). Figures are a year-1 estimate at your 24.0% rate — not tax advice; consult a CPA.
Schools (NCES district)
- District
- Apple Valley Unified
- NCES district ID
- 0600017
- Math proficiency
- 25% ▬ 0.00%
- Reading proficiency
- 40% ▬ 0.00%
- Median HH income
- $49,264
- Composite
- 30.91/100
- National rank
- #11351
- State rank
- #955 of 1400 in CA
Livability — Apple Valley
- Score
- 61/100
- State rank
- #532
- US rank
- #17800
Category grades
Schools grade is shown separately in the Schools card above.
Census & demographics
- Census place
- Apple Valley, CA
- County
- San Bernardino County · 2,030,291 people
- City population
- 83,889
- Metro
- Riverside-San Bernardino-Ontario, CA
- Population (ZIP)
- 41,180
- Household income
- $77,106
- Rent vs Own
- Severe rent burden
- 1069.0
Population outlook (San Bernardino County) Hauer SSP2
- Today (2025)
- 2,300,329 people
- By 2030
- 2,378,907 · +3.4%
- By 2040
- 2,523,137 · +9.7%
- By 2050
- 2,642,388 · +14.9%
- By 2075
- 2,880,769 · +25.2%
- By 2100
- 2,909,436 · +26.5%
Race, ethnicity, and origin ACS 2023
- Neighborhood character
- Diverse neighborhood (Simpson 0.63)
- Race & ethnicity
- White 47% Hispanic / Latino 38% Two or more races 22% Black 5% Asian 3% Native American 2%
- Hispanic origin (detail)
- Mexican 34% Puerto Rican 1%
- Common ancestry
- Lithuanian 3% Italian 3% Slovak 2%
- Foreign-born
- 10% · Canada, China
- Languages at home
- 75% English-only · Spanish 20% Arabic 1% Other Indo-European 1%
Political lean MEDSL · San Bernardino
- 2024 margin
- Toss-up / Even · D 47.5% · R 49.7% · Other 2.8%
- 2008→2024 swing
- -8.5pp toward R · 2008: 6.3pp · 2024: -2.1pp
- All cycles
- 2024: R+2.1 2020: D+10.7 2016: D+9.8 2012: D+5.4 2008: D+6.3
Not yet ingested
- Civics
- —
Market trends
- HPI YoY
- ▼ -262.21%
- Current HPI
- 347.8498
- Rent YoY
- ▲ 5.48%
- Metro
- Riverside-San Bernardino-Ontario, CA
- State GDP YoY
- ▲ 3.21%
- F500 in state
- 116
Industry mix (Fortune 500 HQ in CA)
| Industry | F500 HQs | Revenue |
|---|---|---|
| Technology | 27 | $1,492B |
|
||
| Financial Services | 3 | $174B |
|
||
| Retail | 3 | $44B |
|
||
| Insurance | 3 | $26B |
|
||
| Media / Entertainment | 2 | $115B |
|
||
| Pharmaceuticals / Biotech | 2 | $62B |
|
||
Price history
-91.5% since first listed31 events — show timeline
- 2026-05-18 Listed $110,000 CRMLS
- 2026-03-22 Price Changed $144,900 CRMLS
- 2026-02-05 Listed $155,000 CRMLS
- 2025-12-22 Sold (MLS) $152,000 CRMLS
- 2025-10-20 Listing Removed — CRMLS
- 2025-10-20 Listed $152,000 CRMLS
- 2023-09-17 Listing Removed — CRMLS
- 2023-09-01 Relisted — CRMLS
- 2023-06-30 Relisted — CRMLS
- 2022-12-11 Listed $70,000 CRMLS
- 2022-07-22 Sold (MLS) $120,000 CRMLS
- 2022-06-02 Pending — CRMLS
- 2022-05-20 Price Changed $125,000 CRMLS
- 2022-05-20 Listed $12,500 CRMLS
- 2020-11-27 Sold (MLS) $25,000 CRMLS
- 2020-10-19 Listed $19,900 CRMLS
- 2017-07-14 Listing Removed — SDMLS
- 2016-07-15 Listed $95,000 SDMLS
- 2014-03-21 Listing Removed — CRMLS
- 2013-06-21 Listed $30,000 CRMLS
- 2013-05-03 Sold (MLS) $6,500 CRMLS
- 2013-04-08 Listed $7,950 CRMLS
- 2011-10-27 Sold (Public Records) $5,398,500 Public Records
- 2011-06-17 Sold (MLS) $25,000 CRMLS
- 2007-03-23 Listing Removed — CRMLS
- 2007-01-01 Listed $103,000 CRMLS
- 2001-04-02 Sold (MLS) $29,900 CRMLS
- 2001-03-15 Sold (MLS) $27,000 CRMLS
- 1999-06-08 Sold (MLS) $10,500 CRMLS
- 1999-02-10 Sold (MLS) $17,000 CRMLS
- 1995-07-31 Sold (Public Records) $1,300,000 Public Records
Property tax history
+1.9%/yrLatest (2025): $71,396 · +2.9% YoY. Source: county tax records.
Cash-flow waterfall
monthlySold comps — $/sqft
last 12 mo · ≤1 miLoading sold comps…