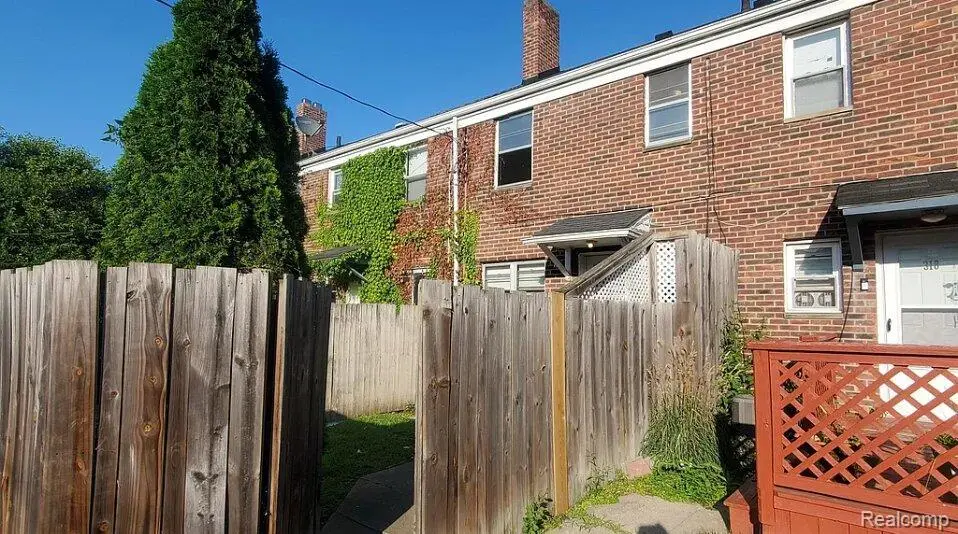
316 Sheffield Ave · Flint, MI
Flood risk 5/10 · Moderate
- FEMA flood zone
- X (unshaded)
- Chance of flooding over 30 yrs
- 0.3%
- Est. flood insurance / yr
- $473 – $860
Fire risk 1/10 · Minimal
- Est. fire insurance / yr
- $784 – $1,456
Heat risk 2/10 · Minimal
- Hot days now (above 96°F)
- 7 days/yr
- Hot days in 30 yrs
- 15 days/yr
Wind risk 2/10 · Minimal
- Chance of severe wind over 30 yrs
- —
Air-quality risk 3/10 · Minor
- Unhealthy air days now
- 3 days/yr
- Unhealthy air days in 30 yrs
- 4 days/yr
Risk factors via First Street. Map © Google.
Why this score? — see what drove the B- grade
The composite is a weighted blend of 9 inputs, each scored 0–100. Each bar is that input's sub-score; the figure is the points it added to the 100-point composite (weight × sub-score).
- Cash flow +30.0/30.0
- 1% rule +10.0/10.0
- DSCR +10.0/10.0
- Rent growth +5.0/5.0
- Livability +3.7/5.0
- ARV discount +3.2/15.0
- Condition / age +2.5/5.0
- Schools +1.1/10.0
- Appreciation +0.0/10.0
$52,999
🖨 Deal sheet (PDF) 📄 Offer letter ✓ Due diligence
Listing remarks MLS
Beautifully renovated townhouse offering a perfect blend of modern updates, low-maintenance living, and strong investment potential. Located in a stable, high-demand area, this property presents an excellent opportunity for both owner-occupants and investors looking for a turnkey asset. Significant capital has been invested into the renovation, resulting in a clean, updated interior with modern finishes throughout. The layout is efficient and functional, maximizing space while providing a comfortable and inviting living environment. From updated flooring and fresh paint to upgraded fixtures and overall condition, the home delivers a true move-in ready experience. Townhouse living adds an additional layer of convenience, with reduced exterior maintenance and long-term ease of ownership - making it especially attractive for tenants and first-time buyers alike. The property is well-suited for consistent rental demand, offering strong cash flow potential with minimal ongoing upkeep. Conveniently located near major roads, shopping, and everyday amenities, this location continues to attract quality tenants and buyers seeking both accessibility and value. Opportunities like this - fully renovated, low-maintenance properties in solid areas - are becoming increasingly limited, making this a smart addition to any portfolio or a great place to call home.
Key facts
- Renovated townhouse
- Fresh paint
- Modern updates
Tags
Property features AI
Finance
- Financial info: $894 annual tax amount
Exterior
- Parking: No garage
- Utilities: Public water; Public sewer
- Home design: Residential condominium; Two levels; Ground-level entry with steps
- Construction: Brick construction; Block foundation
- Exterior features: Paved road access; Pets allowed
Interior
- Bathrooms: One full bathroom
- Heating & cooling: Forced air heating (natural gas); No cooling
- Interior features: Six total rooms; Full, unfinished basement
Neighborhood map
What this means for you Summary
Snapshot
- This is a 2-bed/1.0-bath single-family listed at $53k.
Deal economics
- At list price, monthly cash flow is $466 ($6k/yr) — positive.
- The deal already cash-flows at list — no discount required.
- Meets the 1% rule at list price ($1k rent vs $53k).
- Recommended offer: $50k (6.0% below list) — sets the bar for market timing.
- Cap rate 16.8% vs local median 11.6% in Flint — top-decile yield for the area; either an underpriced asset or a hidden risk that comps aren't pricing in. Stress-test before assuming the spread holds.
Location & tenants
- Location reads 74/100 on livability (#196 in MI, #4,946 nationally) — a middle-class / working-renter tenant base. Strengths: commute A+, cost of living A+, housing A+; Watch: crime F, employment F.
- Flint School District (urban): math 7% / reading 13% proficiency, ranked #714 of 760 in MI (top 94%) — low school quality limits family demand, transient renter base, plan for 1-2y turnover; 83% free/reduced lunch — lower-income household profile, screen leases tightly.
- Zoned schools: Holmes Stem Middle School Academy (math 10% / reading 30%, grade F, #420 of 493 statewide, top 86%, 324 students, 90% FRL).
- Market conditions: Rents rising fast (+12.3%/yr); 137 active listings in the ZIP; 7 comparable units currently listed for rent nearby; rentals at typical pace (median 23d on market — plan ~3-4 weeks tenant-placement turnaround); lower-income renter base — watch delinquency; 419 units permitted in Genesee County in 2024 (68 in 5+ unit buildings).
Forward outlook
- Local home prices are declining (-3.0%/yr); year-one equity from $366 of loan paydown is wiped out by about $2k of value loss. Plan a longer hold.
- Genesee County population projected at -27% by 2050 — secular population decline; favor cash flow + early exit over multi-decade hold.
- At projected returns (-3.0% appreciation + 8.0% rent growth), your $15k cash investment doubles in ~3 years — after that, you're playing with house money.
Negotiation context
- It's been on market 63 days — a 6% lower offer ($50k) is reasonable based on typical stale-listing flexibility.
- 12 sale attempts since 32y ago; this cycle's ask has dropped $7k (12%) from the opening price — seller is motivated, your offer sets the floor, not the list.
- Current owner paid $12k; list at $53k implies a 342% gain — meaningful room to come down on a strong offer.
Risks & watch-outs
- Watch-outs: built in 1949 — expect roof / HVAC / electrical / plumbing capex.
- Climate carrying-cost: moderate flood risk — expect insurance premiums to compound above CPI over the hold.
Questions for the listing agent
- It's been on market 63 days. Have you received any prior offers? Is the seller open to a 6% concession, seller financing, or rate buy-down credit?
- Built in 1949 — when were the roof, HVAC, electrical panel, plumbing, and water heater last replaced?
- Why hasn't it sold? Are there any deal-killer items the seller is aware of (foundation, flood, title, zoning, code violations)?
- Is there a deadline driving the sale (1031 exchange, divorce, estate, relocation)? That informs how much negotiation room exists.
- Schools are F-rated, which usually means shorter tenancies and higher turnover. Who's the typical renter profile here, and what's been the actual vacancy rate?
- Crime grade is F in this area — have there been break-ins, vandalism, or insurance claims at this property in the last 3 years? What carrier currently insures it and at what premium?
- What's the average days-on-market for RENTAL listings here right now (not sales)? A rising rental-DOM trend means longer vacancies and softer asking-rent achievability than the comps imply.
- What's the recent tenant-quality profile in this submarket — average credit score on applications, eviction rate, late-payment / NSF rate, and stable-employment percentage? A property-management company in the area should have these aggregated.
- How much new for-sale + rental construction is in the pipeline within 1–3 miles? Heavy new supply typically softens prices + rents 12–24 months out; constrained supply supports both.
Investment metrics
- 1% rule
- 2.01% ✓
- Cap rate
- 16.84%
- Cash-on-cash
- 37.65%
- DSCR
- 2.68
- GRM
- 4.2
CMA / ARV
- ARV (on-the-fly)
- $48,384
- Comps found
- 12
Show comp detail 12 sales within ~0.75 mi
| Address | Dist | Beds/Ba | Sqft | Sold | Price | $/sf | Match |
|---|---|---|---|---|---|---|---|
| 2810 Gibson St | 0.56mi | 3/1.0 (+1) | 892 (-0%) | 1mo | $15,500 | $17 | 68 |
| 3705 Gratiot Ave | 0.37mi | 2/1.0 | 820 (-8%) | 5mo | $74,200 | $90 | 64 |
| 2448 Thomas St | 0.34mi | 3/1.0 (+1) | 956 (+7%) | 5mo | $107,000 | $112 | 64 |
| 1914 Monteith St | 0.49mi | 2/1.0 | 958 (+7%) | 4mo | $74,900 | $78 | 62 |
| 924 Hammond Ave | 0.43mi | 3/1.0 (+1) | 948 (+6%) | 5mo | $51,000 | $54 | 61 |
| 2023 Cadillac St | 0.59mi | 2/1.0 | 968 (+8%) | 1mo | $26,900 | $28 | 58 |
| 2540 Altoona St | 0.49mi | 2/1.0 | 768 (-14%) | 3mo | $50,000 | $65 | 51 |
| 913 Perry St | 0.59mi | 2/1.5 | 800 (-11%) | 3mo | $8,500 | $11 | 50 |
| 2513 Tiffin St | 0.56mi | 2/1.0 | 768 (-14%) | 0mo | $65,000 | $85 | 50 |
| 3018 Fielding St | 0.57mi | 3/1.0 (+1) | 993 (+11%) | 1mo | $21,000 | $21 | 50 |
| 1900 Cadillac St | 0.65mi | 2/1.0 | 994 (+11%) | 4mo | $49,900 | $50 | 48 |
| 1114 Clancy Ave | 0.70mi | 2/1.0 | 1,009 (+13%) | 3mo | $36,000 | $36 | 44 |
Match score weights: distance 35% · size 25% · config 20% · recency 20%. Top-matched comps best support the ARV.
Projected returns pro-forma
-3.0% appreciation · 8.0% rent growth · sell at horizon
- IRR
- 39.3%
- Equity multiple
- 2.80×
- Total profit
- $26,708
- Equity at exit
- $7,902
- IRR
- 48.1%
- Equity multiple
- 6.87×
- Total profit
- $87,107
- Equity at exit
- $4,582
Cash invested: $14,840 (down + closing). Projections, not guarantees.
Landlord ↔ Tenant lean methodology
- Overall (STATE)
- 62 Landlord-Friendly
- State Michigan
- 62 Landlord-Friendly · EVEN
- County
- — inherits STATE
- City
- — inherits STATE
ZIP-level market 48503
- Home prices YoY
- -27.7%
- Rents YoY
- 12.3%
- Active inventory
- 137
- Price-to-rent
- 4.2×
Monthly cashflow live
- Estimated rent
- $1,063 high interval (Pro) →
- Mortgage (P&I)
- −$278
- Tax from tax record
- −$74 /mo · $894/yr
- Insurance
- −$22
- HOA
- −$0
- Vacancy / Maint / Mgmt
- −$223
- Net cashflow
- $466
Break-even live
Sensitivity live
| Price | -10% $496 | -5% $481 | +0% $466 | +5% $451 | +10% $436 |
|---|---|---|---|---|---|
| Rent | -10% $382 | -5% $424 | +0% $466 | +5% $508 | +10% $550 |
| Rate | -1.0pp $492 | -0.5pp $479 | base $466 | +0.5pp $452 | +1.0pp $438 |
UW: 25.0% down · 7.5% · 30yr · 1.5% tax · 5.0% vac · 8.0% maint · 8.0% mgmt
Financing live
Cash to close
- Down payment
- $13,250
- Closing costs
- $1,590
- Reserves months
- —
- Total cash needed
- —
Loan-product check · same deal, 3 products live
Conventional
25% down · 7.5% · 30yr
- Down + closing
- —
- Monthly P&I
- —
- Monthly cashflow
- —
- DSCR
- —
- Eligible?
- —
Personal DTI + credit; lowest rate.
DSCR
20% down · 8.5% · 30yr
- Down + closing
- —
- Monthly P&I
- —
- Monthly cashflow
- —
- DSCR
- —
- Eligible?
- —
No personal income docs; deal must DSCR.
Hard money
10% down · 12.0% · 12mo
- Down + closing
- —
- Monthly P&I
- —
- Monthly cashflow
- —
- DSCR
- —
- Eligible?
- —
Short-term bridge; refi at stabilization.
Rent comps 7 comps
| Address | Beds | Baths | Sqft | Rent | $/sqft | DOM | Units | Dist |
|---|---|---|---|---|---|---|---|---|
| 314 Sheffield Ave Flint, MI | 2.0 | 1.0 | 896 | $1,250 | $1.40 | 22d | 1 | 0.03mi |
| 343 Sheffield Apt. C Ave heuristic Flint, MI | 1.0 | 1.0 | 564 | $900 | $1.60 | 26d | 1 | 0.04mi |
| 352 Bradley Ave Unit 343 Sheffield Ave-Apt C Flint, MI | 1.0 | 1.0 | 564 | $900 | $1.60 | 22d | 1 | 0.12mi |
| 806 Barney Ave Flint, MI | 2.0 | 1.0 | 1000 | $1,000 | $1.00 | 22d | 1 | 0.43mi |
| 3701 Whitney Ave Flint, MI | 2.0 | 1.0 | 850 | $900 | $1.06 | 15d | 1 | 0.95mi |
| 3901 Herrick St Flint, MI | 3.0 | 1.5 | 1100 | $1,300 | $1.18 | 15d | 1 | 1.11mi |
| 3929 Larchmont St Flint, MI | 2.0 | 1.0 | 900 | $1,100 | $1.22 | 15d | 1 | 1.23mi |
Listing history 49 events
-
2026-06-21pricedays on market $52,999 Active 63 DOM
-
2026-06-18days on market $54,999 Active 60 DOM
-
2026-06-17days on market $54,999 Active 59 DOM
-
2026-06-16days on market $54,999 Active 58 DOM
-
2026-06-15days on market $54,999 Active 57 DOM
-
2026-06-14days on market $54,999 Active 55 DOM
-
2026-06-13pricedays on market $54,999 Active 54 DOM
-
2026-06-10days on market $59,999 Active 52 DOM
-
2026-06-09days on market $59,999 Active 51 DOM
-
2026-06-08days on market $59,999 Active 50 DOM
-
2026-06-07days on market $59,999 Active 49 DOM
-
2026-06-05days on market $59,999 Active 46 DOM
-
2026-06-03days on market $59,999 Active 45 DOM
-
2026-06-02days on market $59,999 Active 44 DOM
-
2026-06-01days on market $59,999 Active 43 DOM
-
2026-05-31days on market $59,999 Active 42 DOM
-
2026-05-30days on market $59,999 Active 41 DOM
-
2026-04-18$59,999 Active
Show marketing remark (1365 chars)
Beautifully renovated townhouse offering a perfect blend of modern updates, low-maintenance living, and strong investment potential. Located in a stable, high-demand area, this property presents an excellent opportunity for both owner-occupants and investors looking for a turnkey asset. Significant capital has been invested into the renovation, resulting in a clean, updated interior with modern finishes throughout. The layout is efficient and functional, maximizing space while providing a comfortable and inviting living environment. From updated flooring and fresh paint to upgraded fixtures and overall condition, the home delivers a true move-in ready experience. Townhouse living adds an additional layer of convenience, with reduced exterior maintenance and long-term ease of ownership - making it especially attractive for tenants and first-time buyers alike. The property is well-suited for consistent rental demand, offering strong cash flow potential with minimal ongoing upkeep. Conveniently located near major roads, shopping, and everyday amenities, this location continues to attract quality tenants and buyers seeking both accessibility and value. Opportunities like this - fully renovated, low-maintenance properties in solid areas - are becoming increasingly limited, making this a smart addition to any portfolio or a great place to call home.
-
2026-04-18$59,999 Active 1365-char remark
Show marketing remark (1365 chars)
Beautifully renovated townhouse offering a perfect blend of modern updates, low-maintenance living, and strong investment potential. Located in a stable, high-demand area, this property presents an excellent opportunity for both owner-occupants and investors looking for a turnkey asset. Significant capital has been invested into the renovation, resulting in a clean, updated interior with modern finishes throughout. The layout is efficient and functional, maximizing space while providing a comfortable and inviting living environment. From updated flooring and fresh paint to upgraded fixtures and overall condition, the home delivers a true move-in ready experience. Townhouse living adds an additional layer of convenience, with reduced exterior maintenance and long-term ease of ownership - making it especially attractive for tenants and first-time buyers alike. The property is well-suited for consistent rental demand, offering strong cash flow potential with minimal ongoing upkeep. Conveniently located near major roads, shopping, and everyday amenities, this location continues to attract quality tenants and buyers seeking both accessibility and value. Opportunities like this - fully renovated, low-maintenance properties in solid areas - are becoming increasingly limited, making this a smart addition to any portfolio or a great place to call home.
-
2024-05-16historical
-
2024-05-16historical
-
2024-05-08price $50,000
-
2024-05-07price $50,000
-
2024-04-26$57,900 Active
-
2024-04-26$57,900 Active
-
2024-04-24historical
-
2024-04-24historical
-
2013-08-08soldstatus $12,000
-
2013-08-08soldstatus $12,000
-
2013-07-26historical
-
2013-07-26historical
-
2013-05-30$14,900
-
2013-05-30$14,900
-
2013-03-26soldstatus $7,250
-
2013-03-26soldstatus $7,250
-
2013-02-27historical
-
2013-01-24$7,900
-
2013-01-24$7,900
-
2003-05-07soldstatus $65,000
-
1997-11-26soldstatus $44,000
-
1997-11-26soldstatus $44,000
-
1997-10-27historical
-
1997-09-18$47,658
-
1997-09-18$47,658
-
1995-03-28soldstatus $36,000
-
1995-03-28soldstatus $36,000
-
1995-02-22historical
-
1994-11-14$39,600
-
1994-11-14$39,600
ⓘ Source: listings_history table (triggers on properties + properties_extension) + one-shot
backfill from property_details.listing_events for pre-trigger history.
Tax reassessment forecast MI · Partial reset (capped growth)
- Current annual tax
- $894 · $74/mo
- Projected year-2 tax
- $894 · $74/mo
- Expected delta
- $0/yr ($0/mo · 0.0%)
ⓘ Screening estimate from a state-policy table — verify with the county assessor before closing.
Climate risk First Street
- Flood 5/10 Major FEMA zone X (unshaded) · 30% chance over 30 yrs
- Wildfire 1/10 Low
- Heat 2/10 Low 7 d/yr ≥96°F today · 15 d/yr by 30 yrs out
- Wind 2/10 Low
- Air quality 3/10 Moderate 3 unhealthy d/yr today · 4 by 30 yrs out
Nearby sold comps map
Loading sold comps map…
Walkable amenities ~0.75 mi
Loading nearby amenities…
Taxation est. · year 1
- Rental income
- $12,761
- − Mortgage interest
- −$2,969
- − Property taxes
- −$894
- − Insurance
- −$265
- − Repairs & maintenance
- −$1,021
- − Management
- −$1,021
- − Depreciation
- −$1,542
- Taxable income
- $5,050
- Est. tax owed @ 24.0%
- −$1,212
- After-tax cash flow
- $4,375/yr
For passive investors: Depreciation is non-cash, so a rental often shows a tax loss while cash-flowing — sheltering income. Rental losses are passive: they offset passive income freely, and up to $25,000/yr can offset ordinary (W-2) income if you actively participate and your MAGI is under $100k (phasing out to $0 by $150k); unused losses carry forward. On sale, claimed depreciation is recaptured at up to 25%, and gains may owe capital-gains tax (a 1031 exchange can defer both). Figures are a year-1 estimate at your 24.0% rate — not tax advice; consult a CPA.
Schools (NCES district)
- District
- Flint School District
- NCES district ID
- 2614520
- Math proficiency
- 7% ▬ 0.00%
- Reading proficiency
- 13% ▲ 3.00%
- Median HH income
- $25,954
- Composite
- 10.97/100
- National rank
- #14642
- State rank
- #714 of 760 in MI
Livability — Flint
- Score
- 74/100
- State rank
- #196
- US rank
- #4946
Category grades
Schools grade is shown separately in the Schools card above.
Census & demographics
- Census place
- Flint, MI
- County
- Genesee County · 221,329 people
- City population
- 93,814
- Metro
- Flint, MI
- Population (ZIP)
- 22,347
- Household income
- $44,411
- Rent vs Own
- Severe rent burden
- 1293.0
Population outlook (Genesee County) Hauer SSP2
- Today (2025)
- 381,312 people
- By 2030
- 362,731 · -4.9%
- By 2040
- 321,550 · -15.7%
- By 2050
- 279,212 · -26.8%
- By 2075
- 193,336 · -49.3%
- By 2100
- 128,118 · -66.4%
Race, ethnicity, and origin ACS 2023
- Neighborhood character
- Diverse neighborhood (Simpson 0.56)
- Race & ethnicity
- Black 55% White 36% Two or more races 4% Hispanic / Latino 3%
- Common ancestry
- Romanian 2% Lithuanian 2% Slovak 1%
- Foreign-born
- 5% · China, Canada
- Languages at home
- 93% English-only · Arabic 4% Spanish 1% Chinese 1%
Political lean MEDSL · Genesee
- 2024 margin
- Toss-up / Even · D 51.4% · R 47.2% · Other 1.4%
- 2008→2024 swing
- -28.3pp toward R · 2008: 32.5pp · 2024: 4.2pp
- All cycles
- 2024: D+4.2 2020: D+9.3 2016: D+9.5 2012: D+28.2 2008: D+32.5
Not yet ingested
- Civics
- —
Market trends
- HPI YoY
- ▼ -49.84%
- Current HPI
- 130.1152
- Rent YoY
- ▲ 12.35%
- Metro
- Flint, MI
- State GDP YoY
- ▲ 1.37%
- F500 in state
- 28
Industry mix (Fortune 500 HQ in MI)
| Industry | F500 HQs | Revenue |
|---|---|---|
| Automotive Parts | 3 | $48B |
|
||
| Automotive | 2 | $372B |
|
||
| Chemicals | 1 | $45B |
|
||
| Automotive Retail | 1 | $29B |
|
||
| Healthcare / Medical Devices | 1 | $23B |
|
||
| Automotive Technology | 1 | $20B |
|
||
Price history
+51.5% since first listed32 events — show timeline
- 2026-04-18 Listed $59,999 MiRealSource-MiMLS
- 2026-04-18 Listed $59,999 REALCOMP
- 2024-05-16 Listing Removed — MiRealSource-MiMLS
- 2024-05-16 Listing Removed — REALCOMP
- 2024-05-08 Price Changed $50,000 MiRealSource-MiMLS
- 2024-05-07 Price Changed $50,000 REALCOMP
- 2024-04-26 Listed $57,900 MiRealSource-MiMLS
- 2024-04-26 Listed $57,900 REALCOMP
- 2024-04-24 Coming Soon — MiRealSource-MiMLS
- 2024-04-24 Coming Soon — REALCOMP
- 2013-08-08 Sold (MLS) $12,000 MiRealSource-MiMLS
- 2013-08-08 Sold (MLS) $12,000 REALCOMP
- 2013-07-26 Listing Removed — MiRealSource-MiMLS
- 2013-07-26 Listing Removed — REALCOMP
- 2013-05-30 Listed $14,900 MiRealSource-MiMLS
- 2013-05-30 Listed $14,900 REALCOMP
- 2013-03-26 Sold (MLS) $7,250 REALCOMP
- 2013-03-26 Sold (MLS) $7,250 MiRealSource-MiMLS
- 2013-02-27 Listing Removed — MiRealSource-MiMLS
- 2013-01-24 Listed $7,900 REALCOMP
- 2013-01-24 Listed $7,900 MiRealSource-MiMLS
- 2003-05-07 Sold (Public Records) $65,000 Public Records
- 1997-11-26 Sold (MLS) $44,000 MiRealSource-MiMLS
- 1997-11-26 Sold (MLS) $44,000 REALCOMP
- 1997-10-27 Listing Removed — MiRealSource-MiMLS
- 1997-09-18 Listed $47,658 MiRealSource-MiMLS
- 1997-09-18 Listed $47,658 REALCOMP
- 1995-03-28 Sold (MLS) $36,000 REALCOMP
- 1995-03-28 Sold (MLS) $36,000 MiRealSource-MiMLS
- 1995-02-22 Listing Removed — MiRealSource-MiMLS
- 1994-11-14 Listed $39,600 REALCOMP
- 1994-11-14 Listed $39,600 MiRealSource-MiMLS
Property tax history
+1.2%/yrLatest (2025): $894 · +1.6% YoY. Source: county tax records.
Cash-flow waterfall
monthlySold comps — $/sqft
last 12 mo · ≤1 miLoading sold comps…