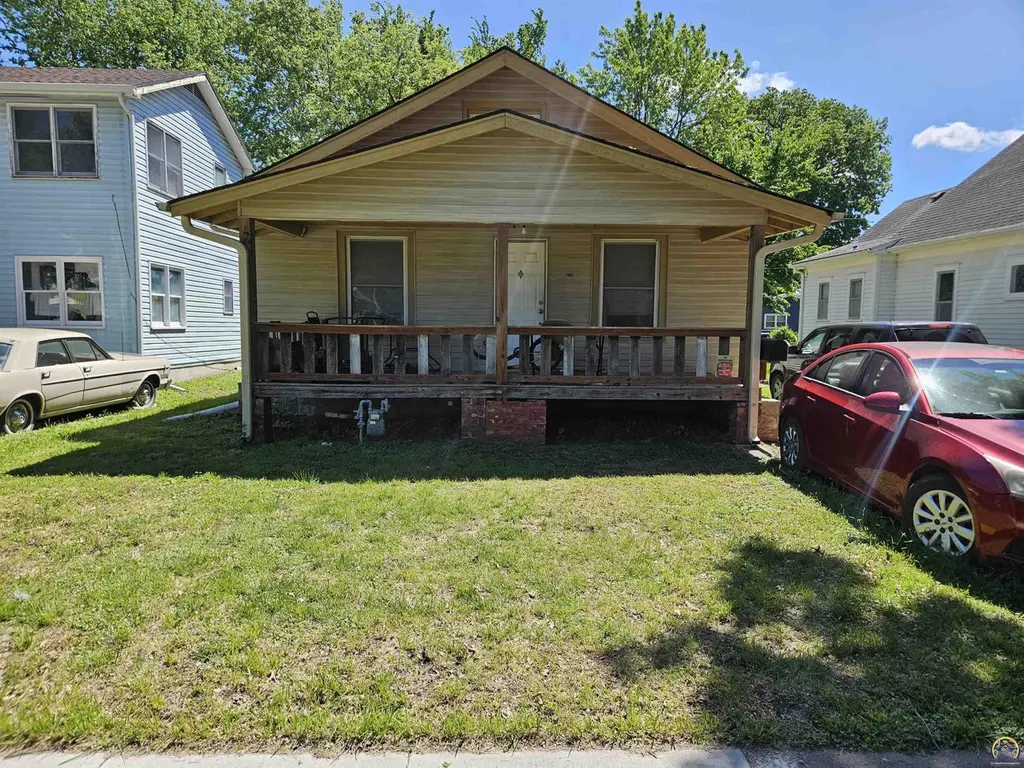
532 NE Ohio Ave · Topeka, KS
Flood risk 1/10 · Minimal
- FEMA flood zone
- X
- Chance of flooding over 30 yrs
- 0.0%
- Est. flood insurance / yr
- $473 – $860
Fire risk 3/10 · Minor
- Est. fire insurance / yr
- $1,154 – $2,142
Heat risk 4/10 · Minor
- Hot days now (above 107°F)
- 7 days/yr
- Hot days in 30 yrs
- 17 days/yr
Wind risk 2/10 · Minimal
- Chance of severe wind over 30 yrs
- —
Air-quality risk 2/10 · Minimal
- Unhealthy air days now
- 1 days/yr
- Unhealthy air days in 30 yrs
- 2 days/yr
Risk factors via First Street. Map © Google.
Why this score? — see what drove the C- grade
The composite is a weighted blend of 9 inputs, each scored 0–100. Each bar is that input's sub-score; the figure is the points it added to the 100-point composite (weight × sub-score).
- Cash flow +20.6/30.0
- ARV discount +7.5/15.0
- DSCR +6.5/10.0
- 1% rule +5.6/10.0
- Livability +3.5/5.0
- Rent growth +2.5/5.0
- Condition / age +2.5/5.0
- Schools +1.7/10.0
- Appreciation +0.0/10.0
$80,000
🖨 Deal sheet (PDF) 📄 Offer letter ✓ Due diligence
Listing remarks
This is a true investment package opportunity. 4 total properties available for one price. Turn key income with all tenants occupying the properties for 6+ years. Stable, great tenants that take care of the homes is hard to find. 611 SE 35th Ter, 2609 SW Buchanan St, 715 SW College Ave, 532 NE Ohio Ave.
Key facts
- 6,534 sq ft lot
- Built 1930
- Listed 6 days
Property features AI
Exterior
- Utilities: Public water; Public sewer
- Home design: Residential property; Package of properties (per listing)
- Construction: Frame construction; Built with block basement
- Exterior features: Lot approximately 50 x 127 (0.15 acre)
Interior
- Bathrooms: 1 full bathroom
- Heating & cooling: Central air conditioning
- Interior features: Gas water heater; Full basement with block construction
Neighborhood map
What this means for you Summary
Snapshot
- This is a 2-bed/1.0-bath single-family listed at $80k.
Deal economics
- At list price, monthly cash flow is $106 ($1k/yr) — positive.
- The deal already cash-flows at list — no discount required.
- Meets the 1% rule at list price ($850 rent vs $80k).
- Cap rate 7.9% vs local median 4.3% in Topeka — top-decile yield for the area; either an underpriced asset or a hidden risk that comps aren't pricing in. Stress-test before assuming the spread holds.
Location & tenants
- Location reads 69/100 on livability (#195 in KS) — a middle-class / working-renter tenant base. Strengths: cost of living A+, housing A+, health & safety A+; Watch: employment C-, crime F, commute F.
- Topeka Public Schools (urban): math 17% / reading 23% proficiency, ranked #158 of 169 in KS (top 94%) — low school quality limits family demand, transient renter base, plan for 1-2y turnover; 69% free/reduced lunch — lower-income household profile, screen leases tightly.
- Zoned schools: State Street Elem (math 23% / reading 21%, grade F, #569 of 684 statewide, top 85%, 456 students, 89% FRL); Chase Middle School (math 11% / reading 15%, grade F, #188 of 219 statewide, top 87%, 378 students, 93% FRL); Highland Park High (math 8% / reading 12%, grade F, #306 of 327 statewide, top 95%, 857 students, 85% FRL) — zoned schools average 89% FRL vs 69% district-wide (20 pts higher); higher-poverty schools than district average — tighter screening recommended.
- Market conditions: 27 active listings in the ZIP; 9 comparable units currently listed for rent nearby; rentals at typical pace (median 23d on market — plan ~3-4 weeks tenant-placement turnaround); 219 units permitted in Shawnee County in 2024 (25 in 5+ unit buildings).
Forward outlook
- Local home prices are declining (-3.0%/yr); year-one equity from $553 of loan paydown is wiped out by about $2k of value loss. Plan a longer hold.
- Shawnee County population projected to shrink 7% by 2050 — rents likely to lag national; underwrite the cash flow, not the appreciation.
Negotiation context
- Only 6 days on market — expect competitive offers; lowballing is unlikely to land.
- Current owner paid $40k; list at $80k implies a 103% gain — meaningful room to come down on a strong offer.
Risks & watch-outs
- Watch-outs: built in 1930 — expect roof / HVAC / electrical / plumbing capex.
Questions for the listing agent
- Built in 1930 — when were the roof, HVAC, electrical panel, plumbing, and water heater last replaced?
- Is there a deadline driving the sale (1031 exchange, divorce, estate, relocation)? That informs how much negotiation room exists.
- Schools are D-rated, which usually means shorter tenancies and higher turnover. Who's the typical renter profile here, and what's been the actual vacancy rate?
- Crime grade is F in this area — have there been break-ins, vandalism, or insurance claims at this property in the last 3 years? What carrier currently insures it and at what premium?
- What's the average days-on-market for RENTAL listings here right now (not sales)? A rising rental-DOM trend means longer vacancies and softer asking-rent achievability than the comps imply.
- What's the recent tenant-quality profile in this submarket — average credit score on applications, eviction rate, late-payment / NSF rate, and stable-employment percentage? A property-management company in the area should have these aggregated.
- How much new for-sale + rental construction is in the pipeline within 1–3 miles? Heavy new supply typically softens prices + rents 12–24 months out; constrained supply supports both.
Investment metrics
- 1% rule
- 1.06% ✓
- Cap rate
- 7.89%
- Cash-on-cash
- 5.69%
- DSCR
- 1.25
- GRM
- 7.8
CMA / ARV
- ARV (on-the-fly)
- $166,400
- Comps found
- 2
Show comp detail 2 sales within ~0.75 mi
| Address | Dist | Beds/Ba | Sqft | Sold | Price | $/sf | Match |
|---|---|---|---|---|---|---|---|
| 233 NE Grattan St | 0.40mi | 2/1.0 | 774 (-7%) | 14mo | $154,900 | $200 | 58 |
| 127 NE Lime St | 0.66mi | 2/1.0 | 919 (+10%) | 12mo | $99,000 | $108 | 42 |
Match score weights: distance 35% · size 25% · config 20% · recency 20%. Top-matched comps best support the ARV.
Projected returns pro-forma
-3.0% appreciation · 3.0% rent growth · sell at horizon
- IRR
- -7.5%
- Equity multiple
- 0.72×
- Total profit
- $-6,180
- Equity at exit
- $11,928
- IRR
- 2.1%
- Equity multiple
- 1.15×
- Total profit
- $3,409
- Equity at exit
- $6,917
Cash invested: $22,400 (down + closing). Projections, not guarantees.
Landlord ↔ Tenant lean methodology
- Overall (STATE)
- 83 Strongly Landlord-Friendly
- State Kansas
- 83 Strongly Landlord-Friendly · R+10
- County
- — inherits STATE
- City
- — inherits STATE
ZIP-level market 66616
- Home prices YoY
- -7.1%
- Active inventory
- 27
- Price-to-rent
- 7.8×
Monthly cashflow live
- Estimated rent
- $850 high interval (Pro) →
- Mortgage (P&I)
- −$420
- Tax from tax record
- −$112 /mo · $1,348/yr
- Insurance
- −$33
- HOA
- −$0
- Vacancy / Maint / Mgmt
- −$178
- Net cashflow
- $106
Break-even live
Sensitivity live
| Price | -10% $151 | -5% $129 | +0% $106 | +5% $84 | +10% $61 |
|---|---|---|---|---|---|
| Rent | -10% $39 | -5% $73 | +0% $106 | +5% $140 | +10% $173 |
| Rate | -1.0pp $146 | -0.5pp $127 | base $106 | +0.5pp $85 | +1.0pp $64 |
UW: 25.0% down · 7.5% · 30yr · 1.5% tax · 5.0% vac · 8.0% maint · 8.0% mgmt
Financing live
Cash to close
- Down payment
- $20,000
- Closing costs
- $2,400
- Reserves months
- —
- Total cash needed
- —
Loan-product check · same deal, 3 products live
Conventional
25% down · 7.5% · 30yr
- Down + closing
- —
- Monthly P&I
- —
- Monthly cashflow
- —
- DSCR
- —
- Eligible?
- —
Personal DTI + credit; lowest rate.
DSCR
20% down · 8.5% · 30yr
- Down + closing
- —
- Monthly P&I
- —
- Monthly cashflow
- —
- DSCR
- —
- Eligible?
- —
No personal income docs; deal must DSCR.
Hard money
10% down · 12.0% · 12mo
- Down + closing
- —
- Monthly P&I
- —
- Monthly cashflow
- —
- DSCR
- —
- Eligible?
- —
Short-term bridge; refi at stabilization.
Rent comps 9 comps
| Address | Beds | Baths | Sqft | Rent | $/sqft | DOM | Units | Dist |
|---|---|---|---|---|---|---|---|---|
| 502 NE Freeman Ave Topeka, KS | 2.0 | 1.0 | 750 | $875 | $1.17 | 22d | 1 | 0.14mi |
| 1001 NE Atchison Ave Topeka, KS | 2.0 | 1.0 | 689 | $809 | $1.17 | 22d | 19 | 0.76mi |
| 1141 NE Chester Ave Topeka, KS | 2.0 | 1.0 | 750 | $850 | $1.13 | 22d | 1 | 0.82mi |
| 423 SE Winfield Ave Unit 441 Topeka, KS | 2.0 | 1.0 | 675 | $682 | $1.01 | 22d | 1 | 1.14mi |
| 423 SE Winfield Ave Unit 421-23 Arter-423 Arter Topeka, KS | 3.0 | 1.0 | 775 | $910 | $1.17 | 22d | 1 | 1.14mi |
| 423 SE Winfield Ave Unit 440 Topeka, KS | 2.0 | 1.0 | 675 | $716 | $1.06 | 22d | 1 | 1.14mi |
| 423 SE Winfield Ave Unit 430 Topeka, KS | 2.0 | 1.0 | 675 | $728 | $1.08 | 22d | 1 | 1.14mi |
| 423 SE Winfield Ave Unit 426 Topeka, KS | 1.0 | 1.0 | 675 | $642 | $0.95 | 22d | 1 | 1.15mi |
| 101 N Kansas Ave Topeka, KS | 2.0 | 1.0 | 1009 | $1,325 | $1.31 | 22d | 3 | 1.39mi |
Listing history 4 events
-
2026-05-14status Pending
-
2026-05-08$80,000 Active
-
2017-10-17soldstatus
-
1998-03-01soldstatus $39,500
ⓘ Source: listings_history table (triggers on properties + properties_extension) + one-shot
backfill from property_details.listing_events for pre-trigger history.
Tax reassessment forecast KS · Resets to sale price
- Current annual tax
- $1,348 · $112/mo
- Projected year-2 tax
- $1,348 · $112/mo
- Expected delta
- $0/yr ($0/mo · 0.0%)
ⓘ Screening estimate from a state-policy table — verify with the county assessor before closing.
Climate risk First Street
- Flood 1/10 Low FEMA zone X · 0% chance over 30 yrs
- Wildfire 3/10 Moderate
- Heat 4/10 Moderate 7 d/yr ≥107°F today · 17 d/yr by 30 yrs out
- Wind 2/10 Low
- Air quality 2/10 Low 1 unhealthy d/yr today · 2 by 30 yrs out
Nearby sold comps map
Loading sold comps map…
Walkable amenities ~0.75 mi
Loading nearby amenities…
Taxation est. · year 1
- Rental income
- $10,198
- − Mortgage interest
- −$4,481
- − Property taxes
- −$1,348
- − Insurance
- −$400
- − Repairs & maintenance
- −$816
- − Management
- −$816
- − Depreciation
- −$2,327
- Taxable income
- $10
- Est. tax owed @ 24.0%
- −$2
- After-tax cash flow
- $1,272/yr
For passive investors: Depreciation is non-cash, so a rental often shows a tax loss while cash-flowing — sheltering income. Rental losses are passive: they offset passive income freely, and up to $25,000/yr can offset ordinary (W-2) income if you actively participate and your MAGI is under $100k (phasing out to $0 by $150k); unused losses carry forward. On sale, claimed depreciation is recaptured at up to 25%, and gains may owe capital-gains tax (a 1031 exchange can defer both). Figures are a year-1 estimate at your 24.0% rate — not tax advice; consult a CPA.
Schools (NCES district)
- District
- Topeka Public Schools
- NCES district ID
- 2012260
- Math proficiency
- 17% ▼ -8.00%
- Reading proficiency
- 23% ▼ -2.00%
- Median HH income
- $37,405
- Composite
- 16.69/100
- National rank
- #9167
- State rank
- #158 of 169 in KS
Livability — Topeka
- Score
- 69/100
- State rank
- #195
- US rank
- #8848
Category grades
Schools grade is shown separately in the Schools card above.
Census & demographics
- Census place
- Topeka, KS
- City population
- 118,130
- Population (ZIP)
- 6,065
Population outlook (Shawnee County) Hauer SSP2
- Today (2025)
- 179,277 people
- By 2030
- 177,762 · -0.8%
- By 2040
- 172,341 · -3.9%
- By 2050
- 166,330 · -7.2%
- By 2075
- 152,417 · -15.0%
- By 2100
- 134,782 · -24.8%
Race, ethnicity, and origin ACS 2023
- Neighborhood character
- Diverse neighborhood (Simpson 0.59)
- Race & ethnicity
- White 55% Hispanic / Latino 32% Two or more races 15% Black 6% Native American 3%
- Hispanic origin (detail)
- Mexican 31% Puerto Rican 2%
- Common ancestry
- Slovak 3% Italian 1% Iranian 1%
- Foreign-born
- 2% · Canada
- Languages at home
- 93% English-only · Spanish 7%
Political lean MEDSL · Shawnee
- 2024 margin
- Toss-up / Even · D 49.3% · R 48.8% · Other 2.0%
- 2008→2024 swing
- +0.8pp no change · 2008: -0.3pp · 2024: 0.5pp
- All cycles
- 2024: D+0.5 2020: D+3.0 2016: R+2.8 2012: R+1.7 2008: R+0.3
Not yet ingested
- Civics
- —
Market trends
- HPI YoY
- ▼ -16.11%
- Current HPI
- 211.4386
- Rent YoY
- —
- Metro
- —
- State GDP YoY
- —
- F500 in state
- 0
Price history
+102.5% since first listed4 events — show timeline
- 2026-05-14 Pending — Sunflower MLS as distributed by MLS GRID
- 2026-05-08 Listed $80,000 Sunflower MLS as distributed by MLS GRID
- 2017-10-17 Sold (Public Records) — Public Records
- 1998-03-01 Sold (Public Records) $39,500 Public Records
Property tax history
+2.5%/yrLatest (2025): $1,348 · +5.2% YoY. Source: county tax records.
Cash-flow waterfall
monthlySold comps — $/sqft
last 12 mo · ≤1 miLoading sold comps…