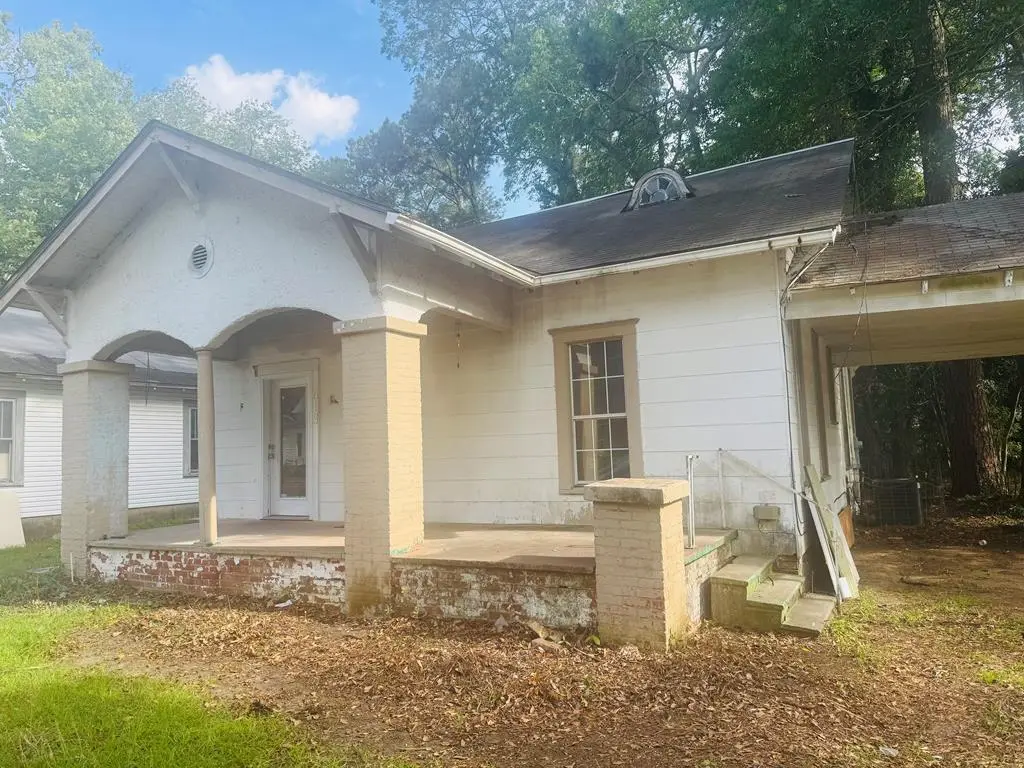
613 Catalpa Ave · Dothan, AL
Flood risk 1/10 · Minimal
- FEMA flood zone
- X (unshaded)
- Chance of flooding over 30 yrs
- 0.0%
- Est. flood insurance / yr
- $507 – $1,088
Fire risk 1/10 · Minimal
- Est. fire insurance / yr
- $916 – $1,700
Heat risk 8/10 · Major
- Hot days now (above 107°F)
- 7 days/yr
- Hot days in 30 yrs
- 18 days/yr
Wind risk 8/10 · Major
- Chance of severe wind over 30 yrs
- 99.0%
Air-quality risk 4/10 · Minor
- Unhealthy air days now
- 5 days/yr
- Unhealthy air days in 30 yrs
- 6 days/yr
Risk factors via First Street. Map © Google.
Why this score? — see what drove the B grade
The composite is a weighted blend of 9 inputs, each scored 0–100. Each bar is that input's sub-score; the figure is the points it added to the 100-point composite (weight × sub-score).
- Cash flow +30.0/30.0
- ARV discount +15.0/15.0
- DSCR +10.0/10.0
- 1% rule +7.4/10.0
- Livability +3.2/5.0
- Rent growth +2.5/5.0
- Schools +2.5/10.0
- Condition / age +2.5/5.0
- Appreciation +0.0/10.0
$73,500
🖨 Deal sheet (PDF) 📄 Offer letter ✓ Due diligence
Listing remarks MLS
Calling all Investors!!! This 1162 sqft. 3 bed, 1 bath home is a great rental opportunity with a long-term tenant. Central HVAC, Refinished hardwood floor. Crawl space. Rent is $600 per month. Property is part of a larger investment portfolio with a total of 8 properties.
Key facts
- Covered front porch
- Backyard
- Hardwood floors
Tags
Property features AI
Exterior
- Parking: No garage
- Utilities: Public water; Public sewer
- Home design: Single-family residence; One level
- Construction: Wood siding
- Exterior features: Covered patio/porch; Waterfront property
Interior
- Kitchen: No listed built-in appliances
- Flooring: Vinyl flooring; Wood flooring
- Bathrooms: 1 full bathroom
- Interior features: Ceiling fans; Eat-in kitchen; Double-pane windows; Fireplace in the living room (1)
Neighborhood map
What this means for you Summary
Snapshot
- This is a 3-bed/1.0-bath single-family listed at $74k.
Deal economics
- At list price, monthly cash flow is $277 ($3k/yr) — positive.
- The deal already cash-flows at list — no discount required.
- Meets the 1% rule at list price ($915 rent vs $74k).
- Recommended offer: $72k (1.5% below list) — sets the bar for market timing.
- Cap rate 10.8% vs local median 4.4% in Dothan — top-decile yield for the area; either an underpriced asset or a hidden risk that comps aren't pricing in. Stress-test before assuming the spread holds.
Location & tenants
- Location reads 64/100 on livability (#146 in AL) — a middle-class / working-renter tenant base. Strengths: cost of living A+, housing A+, health & safety A+; Watch: employment D, crime F, amenities F.
- Dothan City (urban): math 19% / reading 39% proficiency, ranked #73 of 129 in AL (top 57%) — low school quality limits family demand, transient renter base, plan for 1-2y turnover.
- Zoned schools: Girard Intermediate School (math 2% / reading 20%, grade F, #560 of 627 statewide, top 90%, 321 students, 95% FRL); Dothan Preparatory Academy (math 12% / reading 38%, grade F, #163 of 257 statewide, top 64%, 1,133 students, 78% FRL); Dothan High School (math 16% / reading 24%, grade F, #163 of 305 statewide, top 54%, 1,454 students, 70% FRL) — zoned schools average 81% FRL vs 59% district-wide (22 pts higher); higher-poverty schools than district average — tighter screening recommended.
- Market conditions: 410 active listings in the ZIP; 10 comparable units currently listed for rent nearby; rentals lingering (median 45d on market — plan ~5-8 weeks vacancy on turnover, expect pricing pressure); 100% of comp listings sitting > 30 days — soft ceiling on asking rent; 463 units permitted in Houston County in 2024 (96 in 5+ unit buildings).
Forward outlook
- Local home prices are declining (-3.0%/yr); year-one equity from $508 of loan paydown is wiped out by about $2k of value loss. Plan a longer hold.
- Houston County population projected at +7% by 2050 — modest demand growth; plan on rents tracking national, not racing it.
- At projected returns (-3.0% appreciation + 3.0% rent growth), your $21k cash investment doubles in ~8 years — after that, you're playing with house money.
Negotiation context
- It's been on market 20 days — a 2% lower offer ($72k) is reasonable based on typical stale-listing flexibility.
- 2 sale attempts since 3y ago with the ask held roughly flat each time — persistent listings suggest the price (not the market) is what's stuck; bring a comps-based counter.
- Current owner paid $40k; list at $74k implies a 84% gain — meaningful room to come down on a strong offer.
Risks & watch-outs
- Watch-outs: built in 1942 — expect roof / HVAC / electrical / plumbing capex.
- Climate carrying-cost: severe wind risk, 99% chance of damaging wind over 30y; extreme-heat days projected 7→18/yr by 2055 (HVAC capex compounding) — expect insurance premiums to compound above CPI over the hold.
Questions for the listing agent
- Built in 1942 — when were the roof, HVAC, electrical panel, plumbing, and water heater last replaced?
- Is there a deadline driving the sale (1031 exchange, divorce, estate, relocation)? That informs how much negotiation room exists.
- Schools are D-rated, which usually means shorter tenancies and higher turnover. Who's the typical renter profile here, and what's been the actual vacancy rate?
- Crime grade is F in this area — have there been break-ins, vandalism, or insurance claims at this property in the last 3 years? What carrier currently insures it and at what premium?
- What's the average days-on-market for RENTAL listings here right now (not sales)? A rising rental-DOM trend means longer vacancies and softer asking-rent achievability than the comps imply.
- What's the recent tenant-quality profile in this submarket — average credit score on applications, eviction rate, late-payment / NSF rate, and stable-employment percentage? A property-management company in the area should have these aggregated.
- How much new for-sale + rental construction is in the pipeline within 1–3 miles? Heavy new supply typically softens prices + rents 12–24 months out; constrained supply supports both.
Investment metrics
- 1% rule
- 1.24% ✓
- Cap rate
- 10.82%
- Cash-on-cash
- 16.15%
- DSCR
- 1.72
- GRM
- 6.7
CMA / ARV
- ARV (on-the-fly)
- $90,636
- Comps found
- 12
Show comp detail 12 sales within ~0.75 mi
| Address | Dist | Beds/Ba | Sqft | Sold | Price | $/sf | Match |
|---|---|---|---|---|---|---|---|
| 706 Westmead St A & B St | 0.10mi | 2/2.0 (-1) | 1,102 (-5%) | 0mo | $20,000 | $18 | 77 |
| 607 Arlington Ave | 0.12mi | 4/1.0 (+1) | 1,278 (+10%) | 1mo | $55,000 | $43 | 72 |
| 610 Catalpa Ave | 0.03mi | 3/2.0 | 1,296 (+12%) | 21mo | $61,148 | $47 | 58 |
| 503 W Powell St | 0.52mi | 3/1.0 | 1,260 (+8%) | 5mo | $55,000 | $44 | 57 |
| 618 Langley Dr | 0.45mi | 2/1.0 (-1) | 1,100 (-5%) | 11mo | $90,000 | $82 | 56 |
| 803 Dogwood Trl | 0.56mi | 3/2.0 | 1,225 (+5%) | 6mo | $105,000 | $86 | 56 |
| 601 Langley Dr | 0.34mi | 2/1.0 (-1) | 1,035 (-11%) | 14mo | $74,500 | $72 | 50 |
| 613 Virginia Dr | 0.44mi | 3/1.0 | 1,053 (-9%) | 19mo | $129,900 | $123 | 48 |
| 303 Lakeview Dr | 0.66mi | 3/1.5 | 1,244 (+7%) | 10mo | $97,500 | $78 | 47 |
| 707 S Lena St | 0.70mi | 2/1.0 (-1) | 1,101 (-5%) | 14mo | $50,000 | $45 | 42 |
| 846 S Park Ave | 0.59mi | 3/1.0 | 1,295 (+11%) | 20mo | $140,000 | $108 | 36 |
| 1210 Decatur St | 0.70mi | 2/1.0 (-1) | 1,005 (-14%) | 10mo | $121,000 | $120 | 31 |
Match score weights: distance 35% · size 25% · config 20% · recency 20%. Top-matched comps best support the ARV.
Projected returns pro-forma
-3.0% appreciation · 3.0% rent growth · sell at horizon
- IRR
- 7.1%
- Equity multiple
- 1.28×
- Total profit
- $5,710
- Equity at exit
- $10,959
- IRR
- 16.4%
- Equity multiple
- 2.34×
- Total profit
- $27,592
- Equity at exit
- $6,355
Cash invested: $20,580 (down + closing). Projections, not guarantees.
Landlord ↔ Tenant lean methodology
- Overall (STATE)
- 90 Strongly Landlord-Friendly
- State Alabama
- 90 Strongly Landlord-Friendly · R+15
- County
- — inherits STATE
- City
- — inherits STATE
ZIP-level market 36301
- Home prices YoY
- -24.9%
- Active inventory
- 410
- Price-to-rent
- 6.7×
Monthly cashflow live
- Estimated rent
- $915 high interval (Pro) →
- Mortgage (P&I)
- −$385
- Tax from tax record
- −$29 /mo · $353/yr
- Insurance
- −$31
- HOA
- −$0
- Vacancy / Maint / Mgmt
- −$192
- Net cashflow
- $277
Break-even live
Sensitivity live
| Price | -10% $319 | -5% $298 | +0% $277 | +5% $256 | +10% $235 |
|---|---|---|---|---|---|
| Rent | -10% $205 | -5% $241 | +0% $277 | +5% $313 | +10% $349 |
| Rate | -1.0pp $314 | -0.5pp $296 | base $277 | +0.5pp $258 | +1.0pp $239 |
UW: 25.0% down · 7.5% · 30yr · 1.5% tax · 5.0% vac · 8.0% maint · 8.0% mgmt
Financing live
Cash to close
- Down payment
- $18,375
- Closing costs
- $2,205
- Reserves months
- —
- Total cash needed
- —
Loan-product check · same deal, 3 products live
Conventional
25% down · 7.5% · 30yr
- Down + closing
- —
- Monthly P&I
- —
- Monthly cashflow
- —
- DSCR
- —
- Eligible?
- —
Personal DTI + credit; lowest rate.
DSCR
20% down · 8.5% · 30yr
- Down + closing
- —
- Monthly P&I
- —
- Monthly cashflow
- —
- DSCR
- —
- Eligible?
- —
No personal income docs; deal must DSCR.
Hard money
10% down · 12.0% · 12mo
- Down + closing
- —
- Monthly P&I
- —
- Monthly cashflow
- —
- DSCR
- —
- Eligible?
- —
Short-term bridge; refi at stabilization.
Rent comps 10 comps
| Address | Beds | Baths | Sqft | Rent | $/sqft | DOM | Units | Dist |
|---|---|---|---|---|---|---|---|---|
| 500 Morgan St Unit C16 Dothan, AL | 3.0 | 2.0 | 800 | $750 | $0.94 | 44d | 1 | 0.14mi |
| 500 Morgan St Dothan, AL | 2.0 | 1.0 | 850 | $725 | $0.85 | 44d | 1 | 0.14mi |
| 403 Holly Ln Dothan, AL | 2.0 | 1.0–2.0 | 1175 | $1,350 | $1.15 | 44d | 4 | 0.26mi |
| 310 W Lafayette St Dothan, AL | 3.0 | 1.0 | 1459 | $995 | $0.68 | 44d | 1 | 0.43mi |
| 193 S Saint Andrews St Dothan, AL | 2.0 | 2.0 | 1100 | $2,100 | $1.91 | 44d | 1 | 0.70mi |
| 1658 W Main St Dothan, AL | 2.0 | 1.0 | 1000 | $875 | $0.88 | 44d | 1 | 0.79mi |
| 706 Chinook St Dothan, AL | 3.0 | 2.0 | 1214 | $850 | $0.70 | 44d | 1 | 0.89mi |
| 806 S Ussery St Dothan, AL | 3.0 | 1.0 | 934 | $895 | $0.96 | 44d | 1 | 1.05mi |
| 1308 Sioux St Dothan, AL | 2.0 | 2.0 | 1004 | $850 | $0.85 | 44d | 1 | 1.15mi |
| 1809 Haisten Dr Dothan, AL | 3.0 | 2.0 | 1345 | $1,300 | $0.97 | 44d | 1 | 1.36mi |
Listing history 16 events
-
2026-06-19days on market $73,500 Active 20 DOM
-
2026-06-18days on market $73,500 Active 19 DOM
-
2026-06-17days on market $73,500 Active 18 DOM
-
2026-06-16days on market $73,500 Active 17 DOM
-
2026-06-15days on market $73,500 Active 16 DOM
-
2026-06-14days on market $73,500 Active 14 DOM
-
2026-06-12days on market $73,500 Active 13 DOM
-
2026-06-09days on market $73,500 Active 10 DOM
-
2026-06-08days on market $73,500 Active 9 DOM
-
2026-06-07days on market $73,500 Active 8 DOM
-
2026-06-05days on market $73,500 Active 5 DOM
-
2026-06-03days on market $73,500 Active 4 DOM
-
2026-06-02days on market $73,500 Active 3 DOM
-
2026-06-01days on market $73,500 Active 2 DOM
-
2026-05-31remarks 391-char remark
-
2026-05-31$73,500 Active 1 DOM
ⓘ Source: listings_history table (triggers on properties + properties_extension) + one-shot
backfill from property_details.listing_events for pre-trigger history.
Tax reassessment forecast AL · Resets to sale price
- Current annual tax
- $353 · $29/mo
- Projected year-2 tax
- $353 · $29/mo
- Expected delta
- $0/yr ($0/mo · 0.0%)
ⓘ Screening estimate from a state-policy table — verify with the county assessor before closing.
Climate risk First Street
- Flood 1/10 Low FEMA zone X (unshaded) · 0% chance over 30 yrs
- Wildfire 1/10 Low
- Heat 8/10 Severe 7 d/yr ≥107°F today · 18 d/yr by 30 yrs out
- Wind 8/10 Severe 99% chance of damaging wind over 30 yrs
- Air quality 4/10 Moderate 5 unhealthy d/yr today · 6 by 30 yrs out
Nearby sold comps map
Loading sold comps map…
Walkable amenities ~0.75 mi
Loading nearby amenities…
Taxation est. · year 1
- Rental income
- $10,975
- − Mortgage interest
- −$4,117
- − Property taxes
- −$353
- − Insurance
- −$368
- − Repairs & maintenance
- −$878
- − Management
- −$878
- − Depreciation
- −$2,138
- Taxable income
- $2,243
- Est. tax owed @ 24.0%
- −$538
- After-tax cash flow
- $2,786/yr
For passive investors: Depreciation is non-cash, so a rental often shows a tax loss while cash-flowing — sheltering income. Rental losses are passive: they offset passive income freely, and up to $25,000/yr can offset ordinary (W-2) income if you actively participate and your MAGI is under $100k (phasing out to $0 by $150k); unused losses carry forward. On sale, claimed depreciation is recaptured at up to 25%, and gains may owe capital-gains tax (a 1031 exchange can defer both). Figures are a year-1 estimate at your 24.0% rate — not tax advice; consult a CPA.
Schools (NCES district)
- District
- Dothan City
- NCES district ID
- 0101230
- Math proficiency
- 19% ▼ -23.00%
- Reading proficiency
- 39% ▼ -3.00%
- Median HH income
- $42,279
- Composite
- 24.56/100
- National rank
- #7640
- State rank
- #73 of 129 in AL
Livability — Dothan
- Score
- 64/100
- State rank
- #146
- US rank
- #13662
Category grades
Schools grade is shown separately in the Schools card above.
Census & demographics
- Census place
- Dothan, AL
- City population
- 47,783
- Population (ZIP)
- 38,627
Population outlook (Houston County) Hauer SSP2
- Today (2025)
- 110,280 people
- By 2030
- 112,668 · +2.2%
- By 2040
- 116,149 · +5.3%
- By 2050
- 117,805 · +6.8%
- By 2075
- 118,577 · +7.5%
- By 2100
- 110,940 · +0.6%
Race, ethnicity, and origin ACS 2023
- Neighborhood character
- Diverse neighborhood (Simpson 0.55)
- Race & ethnicity
- White 59% Black 31% Hispanic / Latino 5% Two or more races 5%
- Hispanic origin (detail)
- Mexican 3%
- Common ancestry
- Slovak 1% Italian 1% Lithuanian 1%
- Foreign-born
- 3% · Canada
- Languages at home
- 95% English-only · Spanish 4%
Political lean MEDSL · Houston
- 2024 margin
- Solid R (+47.8) · D 25.7% · R 73.5%
- 2008→2024 swing
- -7.0pp toward R · 2008: -40.8pp · 2024: -47.8pp
- All cycles
- 2024: R+47.8 2020: R+42.7 2016: R+47.6 2012: R+40.3 2008: R+40.8
Not yet ingested
- Civics
- —
Market trends
- HPI YoY
- ▼ -53.46%
- Current HPI
- 161.1212
- Rent YoY
- —
- Metro
- —
- State GDP YoY
- ▲ 2.94%
- F500 in state
- 4
Industry mix (Fortune 500 HQ in AL)
| Industry | F500 HQs | Revenue |
|---|---|---|
| Financial Services | 1 | $8B |
|
||
| Healthcare | 1 | $5B |
|
||
Price history
+36.4% since first listed6 events — show timeline
- 2026-05-30 Listed $73,500 SAMLS
- 2024-01-26 Sold (MLS) $40,000 SAMLS
- 2023-12-11 Pending — SAMLS
- 2023-08-25 Contingent — SAMLS
- 2023-08-16 Delisted — SAMLS
- 2023-03-07 Listed $53,900 SAMLS
Property tax history
+6.0%/yrLatest (2025): $353 · +13.4% YoY. Source: county tax records.
Cash-flow waterfall
monthlySold comps — $/sqft
last 12 mo · ≤1 miLoading sold comps…