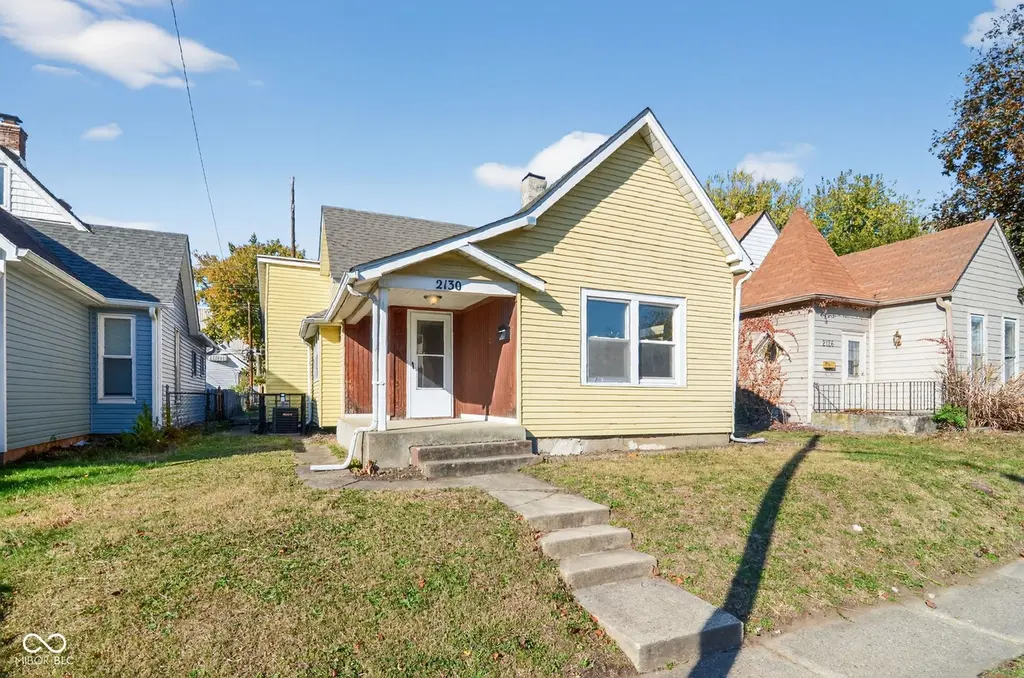
2130 Singleton St · Indianapolis city (balance), IN
Flood risk 1/10 · Minimal
- FEMA flood zone
- X (unshaded)
- Chance of flooding over 30 yrs
- 0.0%
- Est. flood insurance / yr
- $473 – $860
Fire risk 1/10 · Minimal
- Est. fire insurance / yr
- $717 – $1,331
Heat risk 4/10 · Minor
- Hot days now (above 101°F)
- 7 days/yr
- Hot days in 30 yrs
- 19 days/yr
Wind risk 2/10 · Minimal
- Chance of severe wind over 30 yrs
- 0.0%
Air-quality risk 3/10 · Minor
- Unhealthy air days now
- 2 days/yr
- Unhealthy air days in 30 yrs
- 3 days/yr
Risk factors via First Street. Map © Google.
Why this score? — see what drove the B- grade
The composite is a weighted blend of 9 inputs, each scored 0–100. Each bar is that input's sub-score; the figure is the points it added to the 100-point composite (weight × sub-score).
- Cash flow +25.3/30.0
- ARV discount +15.0/15.0
- DSCR +8.3/10.0
- 1% rule +7.2/10.0
- Rent growth +3.2/5.0
- Livability +2.5/5.0
- Condition / age +2.5/5.0
- Schools +1.4/10.0
- Appreciation +0.0/10.0
$99,900
🖨 Deal sheet 📄 Offer letter ✓ Due diligence
Listing remarks MLS
Discover the inviting home awaiting you at 2130 Singleton St. This single-family residence is ready to move in. With a porch, shed, and patio, this property offers features that enhance outdoor living and practical storage. This 852 square feet living area, one-story home, built in 1910, contains 2 bedrooms and 1 full bathroom. This residence offers a wonderful opportunity to embrace a comfortable lifestyle.
Key facts
- Porch
- Shed
- Patio
Tags
Neighborhood map
What this means for you Summary
Snapshot
- This is a 2-bed/1.0-bath single-family listed at $100k.
Deal economics
- At list price, monthly cash flow is $225 ($3k/yr) — positive.
- The deal already cash-flows at list — no discount required.
- Meets the 1% rule at list price ($1k rent vs $100k).
- Recommended offer: $88k (12.0% below list) — sets the bar for market timing.
- Cap rate 9.0% vs local median 4.4% in Indianapolis city (balance) — top-decile yield for the area; either an underpriced asset or a hidden risk that comps aren't pricing in. Stress-test before assuming the spread holds.
Location & tenants
- Location reads: area grade B — affects rentability + tenant quality, not the cash-flow math above.
- Indianapolis Public Schools (urban): math 14% / reading 20% proficiency, ranked #286 of 301 in IN (top 95%) — low school quality limits family demand, transient renter base, plan for 1-2y turnover; 77% free/reduced lunch — lower-income household profile, screen leases tightly.
- Market conditions: Rents rising (+2.9%/yr); 493 active listings in the ZIP; 40 comparable units currently listed for rent nearby; rentals at typical pace (median 24d on market — plan ~3-4 weeks tenant-placement turnaround); 45% of comp listings sitting > 30 days — soft ceiling on asking rent; 1,906 units permitted in Marion County in 2024 (621 in 5+ unit buildings).
Forward outlook
- Local home prices are declining (-3.0%/yr); year-one equity from $691 of loan paydown is wiped out by about $3k of value loss. Plan a longer hold.
- Marion County population projected at +18% by 2050 — long-run rental-demand tailwind backs the buy-and-hold thesis.
Negotiation context
- It's been on market 121 days — a 12% lower offer ($88k) is reasonable based on typical stale-listing flexibility.
- 3 sale attempts since 6y ago; this cycle's ask has dropped $45k (31%) from the opening price — seller is motivated, your offer sets the floor, not the list.
- Current owner paid $55k; list at $100k implies a 82% gain — meaningful room to come down on a strong offer.
Risks & watch-outs
- Watch-outs: built in 1910 — expect roof / HVAC / electrical / plumbing capex.
Questions for the listing agent
- It's been on market 121 days. Have you received any prior offers? Is the seller open to a 12% concession, seller financing, or rate buy-down credit?
- Built in 1910 — when were the roof, HVAC, electrical panel, plumbing, and water heater last replaced?
- Why hasn't it sold? Are there any deal-killer items the seller is aware of (foundation, flood, title, zoning, code violations)?
- Is there a deadline driving the sale (1031 exchange, divorce, estate, relocation)? That informs how much negotiation room exists.
- What's the average days-on-market for RENTAL listings here right now (not sales)? A rising rental-DOM trend means longer vacancies and softer asking-rent achievability than the comps imply.
- What's the recent tenant-quality profile in this submarket — average credit score on applications, eviction rate, late-payment / NSF rate, and stable-employment percentage? A property-management company in the area should have these aggregated.
- How much new for-sale + rental construction is in the pipeline within 1–3 miles? Heavy new supply typically softens prices + rents 12–24 months out; constrained supply supports both.
Investment metrics
- 1% rule
- 1.22% ✓
- Cap rate
- 9.00%
- Cash-on-cash
- 9.67%
- DSCR
- 1.43
- GRM
- 6.8
CMA / ARV
- ARV (median comp)
- $190,823
- List price
- $99,900
- Delta
- -47.65%
- Verdict
- UNDERPRICED
- Comps
- 20 within 1.0 mi
Show comp detail 12 sales within ~0.75 mi
| Address | Dist | Beds/Ba | Sqft | Sold | Price | $/sf | Match |
|---|---|---|---|---|---|---|---|
| 1610 Ringgold Ave | 0.59mi | 2/1.0 | 850 (-0%) | 1mo | $164,000 | $193 | 71 |
| 1805 Orleans St | 0.36mi | 2/1.0 | 781 (-8%) | 8mo | $78,000 | $100 | 62 |
| 1861 New St | 0.33mi | 2/1.0 | 768 (-10%) | 9mo | $120,000 | $156 | 60 |
| 1917 Union St | 0.51mi | 2/1.0 | 820 (-4%) | 12mo | $125,000 | $152 | 60 |
| 928 E Pleasant Run Parkway North Dr | 0.37mi | 2/1.0 | 775 (-9%) | 13mo | $220,000 | $284 | 56 |
| 2550 S Pennsylvania St | 0.74mi | 3/1.0 (+1) | 912 (+7%) | 1mo | $110,000 | $121 | 48 |
| 1829 New St | 0.37mi | 2/1.0 | 974 (+14%) | 13mo | $180,000 | $185 | 48 |
| 2245 Union St | 0.52mi | 2/1.0 | 724 (-15%) | 4mo | $129,900 | $179 | 48 |
| 1913 S Talbott St SE | 0.46mi | 3/1.0 (+1) | 946 (+11%) | 11mo | $95,000 | $100 | 46 |
| 1301 Lawton Ave | 0.72mi | 3/1.0 (+1) | 864 (+1%) | 17mo | $70,000 | $81 | 45 |
| 123 E Palmer St | 0.65mi | 2/1.0 | 800 (-6%) | 24mo | $150,000 | $188 | 40 |
| 1752 Linden St | 0.71mi | 3/1.0 (+1) | 940 (+10%) | 7mo | $95,000 | $101 | 39 |
Match score weights: distance 35% · size 25% · config 20% · recency 20%. Top-matched comps best support the ARV.
Projected returns pro-forma
-3.0% appreciation · 2.88% rent growth · sell at horizon
- IRR
- -1.8%
- Equity multiple
- 0.93×
- Total profit
- $-1,928
- Equity at exit
- $14,895
- IRR
- 7.8%
- Equity multiple
- 1.59×
- Total profit
- $16,403
- Equity at exit
- $8,638
Cash invested: $27,972 (down + closing). Projections, not guarantees.
Landlord ↔ Tenant lean methodology
- Overall (STATE)
- 90 Strongly Landlord-Friendly
- State Indiana
- 90 Strongly Landlord-Friendly · R+11
- County
- — inherits STATE
- City
- — inherits STATE
ZIP-level market 46203
- Home prices YoY
- -26.7%
- Rents YoY
- 2.9%
- Active inventory
- 493
- Price-to-rent
- 6.8×
Monthly cashflow live
- Estimated rent
- $1,219 high interval (Pro) →
- Mortgage (P&I)
- −$524
- Tax from tax record
- −$172 /mo · $2,061/yr
- Insurance
- −$42
- HOA
- −$0
- Vacancy / Maint / Mgmt
- −$256
- Net cashflow
- $225
Break-even live
UW: 25.0% down · 7.5% · 30yr · 1.5% tax · 5.0% vac · 8.0% maint · 8.0% mgmt
Financing live
Cash to close
- Down payment
- $24,975
- Closing costs
- $2,997
- Reserves months
- —
- Total cash needed
- —
Loan-product check · same deal, 3 products live
Conventional
25% down · 7.5% · 30yr
- Down + closing
- —
- Monthly P&I
- —
- Monthly cashflow
- —
- DSCR
- —
- Eligible?
- —
Personal DTI + credit; lowest rate.
DSCR
20% down · 8.5% · 30yr
- Down + closing
- —
- Monthly P&I
- —
- Monthly cashflow
- —
- DSCR
- —
- Eligible?
- —
No personal income docs; deal must DSCR.
Hard money
10% down · 12.0% · 12mo
- Down + closing
- —
- Monthly P&I
- —
- Monthly cashflow
- —
- DSCR
- —
- Eligible?
- —
Short-term bridge; refi at stabilization.
Rent comps 40 comps
| Address | Beds | Baths | Sqft | Rent | $/sqft | DOM | Units | Dist |
|---|---|---|---|---|---|---|---|---|
| 620 E Beecher St Indianapolis, IN | 3.0 | 2.0 | 1072 | $1,639 | $1.53 | 20d | 1 | 0.19mi |
| 1861 Orleans St Indianapolis, IN | 1.0 | 1.0 | 552 | $2,500 | $4.53 | 24d | 1 | 0.23mi |
| 2209 Ransdell St Indianapolis, IN | 2.0 | 1.0 | 710 | $900 | $1.27 | 44d | 1 | 0.24mi |
| 2103 Ringgold Ave Indianapolis, IN | 1.0 | 1.0 | 1090 | $775 | $0.71 | 14d | 1 | 0.30mi |
| 2236 Ransdell St Indianapolis, IN | 2.0 | 1.0 | 850 | $1,150 | $1.35 | 44d | 1 | 0.31mi |
| 1011 E Raymond St Indianapolis, IN | 2.0 | 2.0 | 1100 | $1,350 | $1.23 | 24d | 1 | 0.36mi |
| 823 Iowa St Indianapolis, IN | 2.0 | 1.0 | 812 | $1,100 | $1.35 | 44d | 1 | 0.36mi |
| 512 E Minnesota St Unit 203 Indianapolis, IN | 2.0 | 1.0 | 903 | $1,195 | $1.32 | 24d | 1 | 0.41mi |
| 1756 Delaware St Indianapolis, IN | 3.0 | 2.0 | 1014 | $1,300 | $1.28 | 44d | 1 | 0.49mi |
| 1756 S Delaware St Unit 1754 Indianapolis, IN | 3.0 | 2.0 | 1014 | $1,300 | $1.28 | 15d | 1 | 0.49mi |
| 944 E Minnesota St Indianapolis, IN | 2.0 | 2.0 | 944 | $1,299 | $1.38 | 44d | 1 | 0.49mi |
| 114 Adler St Indianapolis, IN | 2.0 | 1.0 | 688 | $795 | $1.16 | 44d | 1 | 0.53mi |
| 1819 Union St Unit 1817 Indianapolis, IN | 3.0 | 2.0 | 1020 | $1,199 | $1.18 | 44d | 1 | 0.54mi |
| 272 Hoefgen St Unit 1336809P Indianapolis, IN | 2.0 | 1.0 | 592 | $2,055 | $3.47 | 2d | 1 | 0.55mi |
| 1439 South East St Indianapolis, IN | 2.0 | 2.0 | 1114 | $1,425 | $1.28 | 20d | 1 | 0.56mi |
| 1437 S East St Indianapolis, IN | 2.0 | 2.0 | 1114 | $1,425 | $1.28 | 44d | 1 | 0.56mi |
| 1436 S New Jersey St Unit C Indianapolis, IN | 2.0 | 2.0 | 600 | $1,600 | $2.67 | 44d | 1 | 0.58mi |
| 1436 S New Jersey St Unit B Indianapolis, IN | 2.0 | 2.0 | 650 | $1,700 | $2.62 | 7d | 1 | 0.58mi |
| 2314 Union St Indianapolis, IN | 3.0 | 2.0 | 892 | $1,295 | $1.45 | 44d | 1 | 0.62mi |
| 1409 S Alabama St Indianapolis, IN | 2.0 | 1.0 | 949 | $1,245 | $1.31 | 44d | 1 | 0.65mi |
| 1407 S Alabama St Indianapolis, IN | 2.0 | 1.0 | 949 | $1,150 | $1.21 | 44d | 1 | 0.65mi |
| 1514 Ringgold Ave Indianapolis, IN | 3.0 | 1.0 | 1064 | $1,295 | $1.22 | 44d | 1 | 0.65mi |
| 118 E Palmer St Indianapolis, IN | 1.0 | 1.0 | 600 | $649 | $1.08 | 44d | 1 | 0.66mi |
| 118 E Palmer St #120 Indianapolis, IN | 1.0 | 1.0 | 600 | $825 | $1.38 | 18d | 1 | 0.66mi |
| 118 E Palmer St #122 Indianapolis, IN | 1.0 | 1.0 | 600 | $875 | $1.46 | 44d | 1 | 0.66mi |
| 2525 Shelby St Unit 4 Indianapolis, IN | 1.0 | 1.0 | 600 | $775 | $1.29 | 24d | 1 | 0.69mi |
| 2525 Shelby St Unit 1 Indianapolis, IN | 1.0 | 1.0 | 600 | $865 | $1.44 | 3d | 1 | 0.69mi |
| 1524 S Talbott St #3 Indianapolis, IN | 1.0 | 1.0 | 1011 | $725 | $0.72 | 7d | 1 | 0.69mi |
| 1409 E Tabor St Indianapolis, IN | 1.0 | 1.0 | 528 | $775 | $1.47 | 24d | 1 | 0.70mi |
| 265 E Southern Ave Indianapolis, IN | 1.0–2.0 | 1.0 | 800 | $1,150 | $1.44 | 2d | 2 | 0.72mi |
| 2555 Shelby St Unit 2559 Indianapolis, IN | 1.0 | 1.0 | 717 | $1,250 | $1.74 | 44d | 1 | 0.75mi |
| 1026 Orange St Indianapolis, IN | 2.0 | 2.0 | 1007 | $1,600 | $1.59 | 16d | 1 | 0.79mi |
| 1024 Orange St Indianapolis, IN | 2.0 | 2.0 | 1007 | $1,650 | $1.64 | 44d | 1 | 0.79mi |
| 1461 S Meridian St Unit A Indianapolis, IN | 1.0 | 1.0 | 800 | $950 | $1.19 | 44d | 1 | 0.82mi |
| 436 Sanders St Indianapolis, IN | 1.0 | 1.0 | 800 | $800 | $1.00 | 7d | 1 | 0.82mi |
| 1318 Shelby St Unit B 120% AMI Indianapolis, IN | 1.0 | 1.0 | 1116 | $1,350 | $1.21 | 24d | 1 | 0.85mi |
| 1604 E Kelly St Indianapolis, IN | 2.0 | 1.0 | 800 | $1,025 | $1.28 | 10d | 1 | 0.85mi |
| 1604 E Kelly St Indianapolis, IN | 2.0 | 1.0 | 750 | $1,025 | $1.37 | 18d | 1 | 0.85mi |
| 2760 S East St Indianapolis, IN | 2.0–3.0 | 2.0 | 1072 | $895 | $0.83 | 3d | 3 | 0.88mi |
| 355 E Morris St Indianapolis, IN | 2.0 | 1.0 | 648 | $1,800 | $2.78 | 24d | 1 | 0.88mi |
Listing history 13 events
-
2026-05-07status Pending 412-char remark
Show marketing remark (412 chars)
Discover the inviting home awaiting you at 2130 Singleton St. This single-family residence is ready to move in. With a porch, shed, and patio, this property offers features that enhance outdoor living and practical storage. This 852 square feet living area, one-story home, built in 1910, contains 2 bedrooms and 1 full bathroom. This residence offers a wonderful opportunity to embrace a comfortable lifestyle.
-
2026-04-20price $99,900 412-char remark
Show marketing remark (412 chars)
Discover the inviting home awaiting you at 2130 Singleton St. This single-family residence is ready to move in. With a porch, shed, and patio, this property offers features that enhance outdoor living and practical storage. This 852 square feet living area, one-story home, built in 1910, contains 2 bedrooms and 1 full bathroom. This residence offers a wonderful opportunity to embrace a comfortable lifestyle.
-
2026-04-10price $107,900 412-char remark
Show marketing remark (412 chars)
Discover the inviting home awaiting you at 2130 Singleton St. This single-family residence is ready to move in. With a porch, shed, and patio, this property offers features that enhance outdoor living and practical storage. This 852 square feet living area, one-story home, built in 1910, contains 2 bedrooms and 1 full bathroom. This residence offers a wonderful opportunity to embrace a comfortable lifestyle.
-
2026-03-31status Active 412-char remark
Show marketing remark (412 chars)
Discover the inviting home awaiting you at 2130 Singleton St. This single-family residence is ready to move in. With a porch, shed, and patio, this property offers features that enhance outdoor living and practical storage. This 852 square feet living area, one-story home, built in 1910, contains 2 bedrooms and 1 full bathroom. This residence offers a wonderful opportunity to embrace a comfortable lifestyle.
-
2026-02-27status Pending 412-char remark
Show marketing remark (412 chars)
Discover the inviting home awaiting you at 2130 Singleton St. This single-family residence is ready to move in. With a porch, shed, and patio, this property offers features that enhance outdoor living and practical storage. This 852 square feet living area, one-story home, built in 1910, contains 2 bedrooms and 1 full bathroom. This residence offers a wonderful opportunity to embrace a comfortable lifestyle.
-
2026-01-30price $109,900 412-char remark
Show marketing remark (412 chars)
Discover the inviting home awaiting you at 2130 Singleton St. This single-family residence is ready to move in. With a porch, shed, and patio, this property offers features that enhance outdoor living and practical storage. This 852 square feet living area, one-story home, built in 1910, contains 2 bedrooms and 1 full bathroom. This residence offers a wonderful opportunity to embrace a comfortable lifestyle.
-
2026-01-22price $119,900 412-char remark
Show marketing remark (412 chars)
Discover the inviting home awaiting you at 2130 Singleton St. This single-family residence is ready to move in. With a porch, shed, and patio, this property offers features that enhance outdoor living and practical storage. This 852 square feet living area, one-story home, built in 1910, contains 2 bedrooms and 1 full bathroom. This residence offers a wonderful opportunity to embrace a comfortable lifestyle.
-
2026-01-09price $129,900 412-char remark
Show marketing remark (412 chars)
Discover the inviting home awaiting you at 2130 Singleton St. This single-family residence is ready to move in. With a porch, shed, and patio, this property offers features that enhance outdoor living and practical storage. This 852 square feet living area, one-story home, built in 1910, contains 2 bedrooms and 1 full bathroom. This residence offers a wonderful opportunity to embrace a comfortable lifestyle.
-
2025-12-16price $134,900 412-char remark
Show marketing remark (412 chars)
Discover the inviting home awaiting you at 2130 Singleton St. This single-family residence is ready to move in. With a porch, shed, and patio, this property offers features that enhance outdoor living and practical storage. This 852 square feet living area, one-story home, built in 1910, contains 2 bedrooms and 1 full bathroom. This residence offers a wonderful opportunity to embrace a comfortable lifestyle.
-
2025-12-05$145,000 Active 412-char remark
Show marketing remark (412 chars)
Discover the inviting home awaiting you at 2130 Singleton St. This single-family residence is ready to move in. With a porch, shed, and patio, this property offers features that enhance outdoor living and practical storage. This 852 square feet living area, one-story home, built in 1910, contains 2 bedrooms and 1 full bathroom. This residence offers a wonderful opportunity to embrace a comfortable lifestyle.
-
2020-05-06soldstatus $55,000 Sold 300-char remark
Show marketing remark (300 chars)
Southside house in the path of the revitalization movement. 2 bedrooms with large common areas. Laminate flooring, replacement windows, and LOTS of natural light. Fenced rear yard with off-street parking and porch & patio to kick back and relax. Check 'er out-- will make someone a nice home.
-
2020-04-24status Pending 300-char remark
Show marketing remark (300 chars)
Southside house in the path of the revitalization movement. 2 bedrooms with large common areas. Laminate flooring, replacement windows, and LOTS of natural light. Fenced rear yard with off-street parking and porch & patio to kick back and relax. Check 'er out-- will make someone a nice home.
-
2020-04-20$60,000 Active 300-char remark
Show marketing remark (300 chars)
Southside house in the path of the revitalization movement. 2 bedrooms with large common areas. Laminate flooring, replacement windows, and LOTS of natural light. Fenced rear yard with off-street parking and porch & patio to kick back and relax. Check 'er out-- will make someone a nice home.
ⓘ Source: listings_history table (triggers on properties + properties_extension) + one-shot
backfill from property_details.listing_events for pre-trigger history.
Tax reassessment forecast IN · Partial reset (capped growth)
- Current annual tax
- $2,061 · $172/mo
- Projected year-2 tax
- $2,061 · $172/mo
- Expected delta
- $0/yr ($0/mo · 0.0%)
ⓘ Screening estimate from a state-policy table — verify with the county assessor before closing.
Climate risk First Street
- Flood 1/10 Low FEMA zone X (unshaded) · 0% chance over 30 yrs
- Wildfire 1/10 Low
- Heat 4/10 Moderate 7 d/yr ≥101°F today · 19 d/yr by 30 yrs out
- Wind 2/10 Low 0% chance of damaging wind over 30 yrs
- Air quality 3/10 Moderate 2 unhealthy d/yr today · 3 by 30 yrs out
Nearby sold comps map
Loading sold comps map…
Walkable amenities ~0.75 mi
Loading nearby amenities…
Taxation est. · year 1
- Rental income
- $14,624
- − Mortgage interest
- −$5,596
- − Property taxes
- −$2,061
- − Insurance
- −$500
- − Repairs & maintenance
- −$1,170
- − Management
- −$1,170
- − Depreciation
- −$2,906
- Taxable income
- $1,221
- Est. tax owed @ 24.0%
- −$293
- After-tax cash flow
- $2,412/yr
For passive investors: Depreciation is non-cash, so a rental often shows a tax loss while cash-flowing — sheltering income. Rental losses are passive: they offset passive income freely, and up to $25,000/yr can offset ordinary (W-2) income if you actively participate and your MAGI is under $100k (phasing out to $0 by $150k); unused losses carry forward. On sale, claimed depreciation is recaptured at up to 25%, and gains may owe capital-gains tax (a 1031 exchange can defer both). Figures are a year-1 estimate at your 24.0% rate — not tax advice; consult a CPA.
Schools (NCES district)
- District
- Indianapolis Public Schools
- NCES district ID
- 1804770
- Math proficiency
- 14% ▼ -7.00%
- Reading proficiency
- 20% ▼ -3.00%
- Median HH income
- $32,034
- Composite
- 13.69/100
- National rank
- #9499
- State rank
- #286 of 301 in IN
Livability — Indianapolis city (balance)
No livability data for this city. (Only ~50 U.S. cities are tracked.)
Census & demographics
- Census place
- Indianapolis city (balance), IN
- County
- Marion County · 998,460 people
- City population
- 881,119
- Metro
- Indianapolis-Carmel-Anderson, IN
- Population (ZIP)
- 37,758
- Household income
- $57,393
- Rent vs Own
- Severe rent burden
- 1499.0
Population outlook (Marion County) Hauer SSP2
- Today (2025)
- 1,025,572 people
- By 2030
- 1,065,727 · +3.9%
- By 2040
- 1,141,577 · +11.3%
- By 2050
- 1,208,920 · +17.9%
- By 2075
- 1,367,288 · +33.3%
- By 2100
- 1,438,201 · +40.2%
Race, ethnicity, and origin ACS 2023
- Neighborhood character
- Predominantly White (69%)
- Race & ethnicity
- White 69% Hispanic / Latino 14% Black 12% Two or more races 8% Asian 2% Native American 1%
- Hispanic origin (detail)
- Mexican 12% Puerto Rican 1%
- Common ancestry
- Slovak 2% Lithuanian 2% Italian 1%
- Foreign-born
- 8% · Canada
- Languages at home
- 88% English-only · Spanish 10% Other Indo-European 1%
Political lean MEDSL · Marion
- 2024 margin
- Strong D (+27.7) · D 63.0% · R 35.3% · Other 1.7%
- 2008→2024 swing
- -0.7pp no change · 2008: 28.4pp · 2024: 27.7pp
- All cycles
- 2024: D+27.7 2020: D+29.1 2016: D+22.8 2012: D+22.2 2008: D+28.4
Not yet ingested
- Civics
- —
Market trends
- HPI YoY
- ▼ -127.37%
- Current HPI
- 349.579
- Rent YoY
- ▲ 2.88%
- Metro
- Indianapolis-Carmel-Anderson, IN
- State GDP YoY
- ▲ 2.90%
- F500 in state
- 18
Industry mix (Fortune 500 HQ in IN)
| Industry | F500 HQs | Revenue |
|---|---|---|
| Industrial Machinery | 2 | $37B |
|
||
| Healthcare | 1 | $177B |
|
||
| Pharmaceuticals | 1 | $45B |
|
||
| Metals / Steel | 1 | $18B |
|
||
| Agriculture | 1 | $17B |
|
||
| Packaging | 1 | $12B |
|
||
Price history
+66.5% since first listed13 events — show timeline
- 2026-05-07 Pending — MIBOR as Distributed by MLS Grid
- 2026-04-20 Price Changed $99,900 MIBOR as Distributed by MLS Grid
- 2026-04-10 Price Changed $107,900 MIBOR as Distributed by MLS Grid
- 2026-03-31 Relisted — MIBOR as Distributed by MLS Grid
- 2026-02-27 Pending — MIBOR as Distributed by MLS Grid
- 2026-01-30 Price Changed $109,900 MIBOR as Distributed by MLS Grid
- 2026-01-22 Price Changed $119,900 MIBOR as Distributed by MLS Grid
- 2026-01-09 Price Changed $129,900 MIBOR as Distributed by MLS Grid
- 2025-12-16 Price Changed $134,900 MIBOR as Distributed by MLS Grid
- 2025-12-05 Listed $145,000 MIBOR as Distributed by MLS Grid
- 2020-05-06 Sold (MLS) $55,000 MIBOR as Distributed by MLS Grid
- 2020-04-24 Pending — MIBOR as Distributed by MLS Grid
- 2020-04-20 Listed $60,000 MIBOR as Distributed by MLS Grid
Property tax history
+9.2%/yrLatest (2025): $2,061 · +13.6% YoY. Source: county tax records.
Cash-flow waterfall
monthlySold comps — $/sqft
last 12 mo · ≤1 miLoading sold comps…