7715 W 105th Ave · St. John, IN
Flood risk No data
- FEMA flood zone
- —
- Chance of flooding over 30 yrs
- —
- Est. flood insurance / yr
- —
Fire risk No data
- Est. fire insurance / yr
- —
Heat risk No data
- Hot days now (above threshold)
- —
- Hot days in 30 yrs
- —
Wind risk No data
- Chance of severe wind over 30 yrs
- —
Air-quality risk No data
- Unhealthy air days now
- —
- Unhealthy air days in 30 yrs
- —
Risk factors via First Street. Map © Google.
Why this score? — see what drove the D+ grade
The composite is a weighted blend of 9 inputs, each scored 0–100. Each bar is that input's sub-score; the figure is the points it added to the 100-point composite (weight × sub-score).
- ARV discount +15.0/15.0
- Cash flow +11.7/30.0
- Schools +4.5/10.0
- 1% rule +3.5/10.0
- DSCR +3.4/10.0
- Rent growth +2.5/5.0
- Livability +2.5/5.0
- Condition / age +2.5/5.0
- Appreciation +0.0/10.0
$348,740
🖨 Deal sheet 📄 Offer letter ✓ Due diligence
Listing remarks
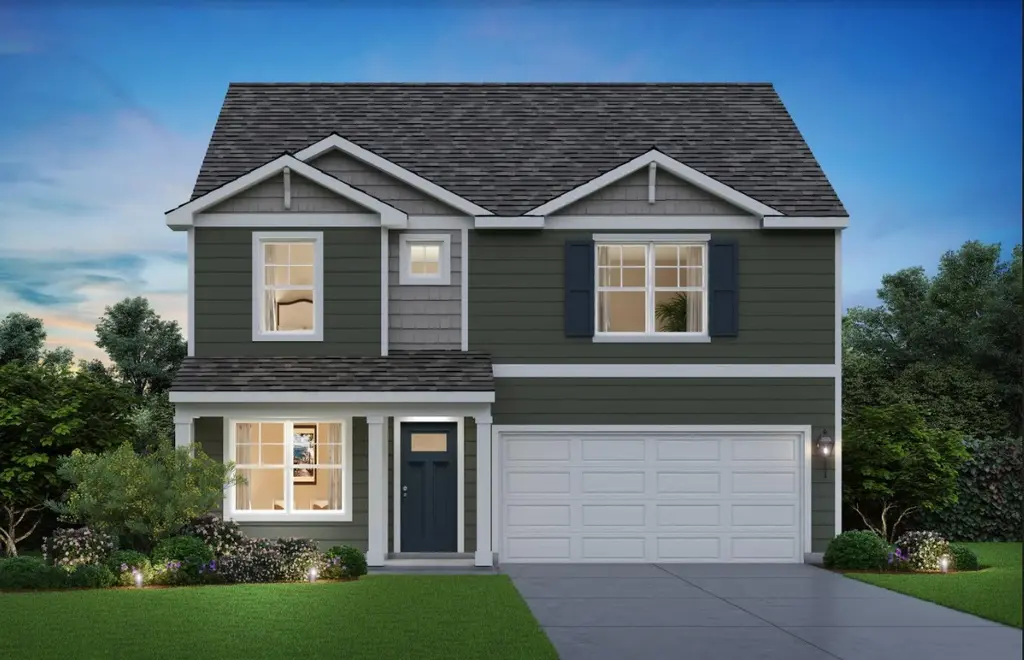
UNDER CONSTRUCTION. To be completed September 2021 This Stunning Two Story Home is located in The Gates of St. John Indiana!! DR Horton, America's Builder presents the Holcombe, an impressive 2356 sq. ft. two story with four generously sized bedrooms & 2.5 baths w/ 9-foot ceilings on the first floor. Imagine all the possibilities in the front study/flex space, a home office. This open concept plan features a beautiful kitchen w/ quartz countertops, undermount sink, stainless-steel appliances, and walk-in corner pantry. You will never be away from the action while overlooking the generously sized open concept entertaining space. Upper Level w/ wide open hallway leads to 4 expansive bed
Key facts
- 9,000 sq ft lot
- 2 garage spots
- Built 2021
Neighborhood map
What this means for you Summary
Snapshot
- This is a 4-bed/2.5-bath single-family listed at $349k.
Deal economics
- At list price, monthly cash flow is $-101 ($-1k/yr) — negative.
- To cash-flow at today's rent, offer at most $334k (4.2% below list).
- To meet the 1% rule (rent ≥ 1% of price), the offer needs to be $298k (14.7% below list).
- Recommended offer: $298k (14.7% below list) — sets the bar for 1% rule.
- Cap rate 5.9% vs local median 3.6% in St. John — top-decile yield for the area; either an underpriced asset or a hidden risk that comps aren't pricing in. Stress-test before assuming the spread holds.
Location & tenants
- Location reads: area grade D — affects rentability + tenant quality, not the cash-flow math above.
- Hanover Community School Corporation (suburban): math 49% / reading 53% proficiency, ranked #38 of 301 in IN (top 13%) — acceptable for families but not a draw, mixed tenant base, ~2y average lease; only 20% free/reduced lunch — higher-income household profile.
- Market conditions: 260 active listings in the ZIP; 8 comparable units currently listed for rent nearby; rentals leasing fast (median 2d on market — plan ~1-2 weeks tenant-placement turnaround); 1,642 units permitted in Lake County in 2024 (14 in 5+ unit buildings).
Forward outlook
- Local home prices are declining (-3.0%/yr); year-one equity from $2k of loan paydown is wiped out by about $10k of value loss. Plan a longer hold.
- Lake County population projected to shrink 7% by 2050 — rents likely to lag national; underwrite the cash flow, not the appreciation.
Negotiation context
- Only 0 days on market — expect competitive offers; lowballing is unlikely to land.
- 4 sale attempts since 5y ago with the ask held roughly flat each time — persistent listings suggest the price (not the market) is what's stuck; bring a comps-based counter.
Questions for the listing agent
- What do current leases actually rent for vs. the listed asking? Can we see a recent rent roll and the last 12 months of T-12 income?
- What does the HOA fee cover, when was the last increase, and are there any pending special assessments or reserve-fund shortfalls?
- Is there a deadline driving the sale (1031 exchange, divorce, estate, relocation)? That informs how much negotiation room exists.
- The area grade is low — what's the realistic commute time and amenity access for the typical tenant pool here? Any planned neighborhood developments (good or bad) we should know about?
- What's the average days-on-market for RENTAL listings here right now (not sales)? A rising rental-DOM trend means longer vacancies and softer asking-rent achievability than the comps imply.
- What's the recent tenant-quality profile in this submarket — average credit score on applications, eviction rate, late-payment / NSF rate, and stable-employment percentage? A property-management company in the area should have these aggregated.
- How much new for-sale + rental construction is in the pipeline within 1–3 miles? Heavy new supply typically softens prices + rents 12–24 months out; constrained supply supports both.
Investment metrics
- 1% rule
- 0.85% ✗
- Cap rate
- 5.95%
- Cash-on-cash
- -1.24%
- DSCR
- 0.94
- GRM
- 9.8
CMA / ARV
- ARV (on-the-fly)
- $468,844
- Comps found
- 12
Show comp detail 12 sales within ~0.75 mi
| Address | Dist | Beds/Ba | Sqft | Sold | Price | $/sf | Match |
|---|---|---|---|---|---|---|---|
| 10365 Blaine St | 0.73mi | 4/2.5 | 2,356 (0%) | 1mo | $442,990 | $188 | 66 |
| 10173 Red Oak Dr | 0.56mi | 4/2.5 | 2,448 (+4%) | 3mo | $486,335 | $199 | 65 |
| 7848 W 106th Pl | 0.54mi | 4/2.5 | 2,521 (+7%) | 0mo | $434,000 | $172 | 63 |
| 10384 Redwood Dr | 0.22mi | 3/2.0 (-1) | 2,108 (-10%) | 3mo | $435,000 | $206 | 63 |
| 9460 101st Pl | 0.66mi | 4/2.5 | 2,448 (+4%) | 0mo | $486,535 | $199 | 62 |
| 7884 W 106th Pl | 0.52mi | 4/2.5 | 2,521 (+7%) | 3mo | $444,990 | $177 | 62 |
| 9400 101st Pl | 0.62mi | 3/2.0 (-1) | 2,369 (+1%) | 3mo | $499,855 | $211 | 61 |
| 10411 Douglas Dr | 0.47mi | 4/2.5 | 2,614 (+11%) | 2mo | $511,000 | $195 | 58 |
| 7770 W 106th Pl | 0.58mi | 3/2.5 (-1) | 2,251 (-4%) | 3mo | $378,990 | $168 | 58 |
| 9227 W 103rd Pl | 0.37mi | 3/2.0 (-1) | 2,034 (-14%) | 3mo | $455,000 | $224 | 50 |
| 7787 W 105th Pl | 0.56mi | 3/2.0 (-1) | 2,106 (-11%) | 2mo | $429,000 | $204 | 48 |
| 9405 101st Pl | 0.61mi | 3/2.5 (-1) | 2,612 (+11%) | 1mo | $489,990 | $188 | 48 |
Match score weights: distance 35% · size 25% · config 20% · recency 20%. Top-matched comps best support the ARV.
Projected returns pro-forma
-3.0% appreciation · 3.0% rent growth · sell at horizon
- IRR
- -18.3%
- Equity multiple
- 0.36×
- Total profit
- $-62,865
- Equity at exit
- $51,998
- IRR
- -10.6%
- Equity multiple
- 0.36×
- Total profit
- $-62,728
- Equity at exit
- $30,153
Cash invested: $97,647 (down + closing). Projections, not guarantees.
Landlord ↔ Tenant lean methodology
- Overall (STATE)
- 90 Strongly Landlord-Friendly
- State Indiana
- 90 Strongly Landlord-Friendly · R+11
- County
- — inherits STATE
- City
- — inherits STATE
ZIP-level market 46373
- Home prices YoY
- -23.8%
- Active inventory
- 260
- Price-to-rent
- 9.8×
Monthly cashflow live
- Estimated rent
- $2,976 high interval (Pro) →
- Mortgage (P&I)
- −$1,829
- Tax est. 1.5%
- −$436 /mo · $5,231/yr
- Insurance
- −$145
- HOA
- −$42
- Vacancy / Maint / Mgmt
- −$625
- Net cashflow
- $-101
Break-even live
UW: 25.0% down · 7.5% · 30yr · 1.5% tax · 5.0% vac · 8.0% maint · 8.0% mgmt
Financing live
Cash to close
- Down payment
- $87,185
- Closing costs
- $10,462
- Reserves months
- —
- Total cash needed
- —
Loan-product check · same deal, 3 products live
Conventional
25% down · 7.5% · 30yr
- Down + closing
- —
- Monthly P&I
- —
- Monthly cashflow
- —
- DSCR
- —
- Eligible?
- —
Personal DTI + credit; lowest rate.
DSCR
20% down · 8.5% · 30yr
- Down + closing
- —
- Monthly P&I
- —
- Monthly cashflow
- —
- DSCR
- —
- Eligible?
- —
No personal income docs; deal must DSCR.
Hard money
10% down · 12.0% · 12mo
- Down + closing
- —
- Monthly P&I
- —
- Monthly cashflow
- —
- DSCR
- —
- Eligible?
- —
Short-term bridge; refi at stabilization.
Rent comps 8 comps
| Address | Beds | Baths | Sqft | Rent | $/sqft | DOM | Units | Dist |
|---|---|---|---|---|---|---|---|---|
| 10342 Adler Cv Saint John, IN | 3.0 | 2.0 | 1944 | $3,000 | $1.54 | 1d | 1 | 0.16mi |
| 8688 Larkspur Ln Saint John, IN | 3.0 | 2.5 | 1758 | $3,000 | $1.71 | 1d | 1 | 0.33mi |
| 8726 Orchid Dr Saint John, IN | 3.0 | 2.5 | 1756 | $2,725 | $1.55 | 43d | 1 | 0.38mi |
| 8754 Clover Ln Saint John, IN | 3.0 | 2.5 | 1756 | $2,675 | $1.52 | 43d | 1 | 0.42mi |
| 8769 W 108th Ln Saint John, IN | 3.0 | 2.5 | 1758 | $2,775 | $1.58 | 43d | 1 | 0.45mi |
| 7828 W 105th Pl Crown Point, IN | 4.0 | 2.5 | 2521 | $3,200 | $1.27 | 1d | 1 | 0.53mi |
| 7750 W 105th Pl Crown Point, IN | 3.0 | 2.5 | 2251 | $3,350 | $1.49 | 1d | 1 | 0.57mi |
| 10173 Joliet St Saint John, IN | 4.0 | 2.0 | 2413 | $3,200 | $1.33 | 2d | 1 | 1.33mi |
HOA detail
- Monthly dues
- $42 · $504/yr
Listing history 9 events
-
2024-01-08historical
-
2023-08-24status Active
-
2021-04-16historical
-
2021-04-16historical
-
2021-04-16historical
-
2021-04-15historical
-
2021-04-07$348,740
-
2021-04-02$348,740
-
2021-04-02
ⓘ Source: listings_history table (triggers on properties + properties_extension) + one-shot
backfill from property_details.listing_events for pre-trigger history.
Nearby sold comps map
Loading sold comps map…
Walkable amenities ~0.75 mi
Loading nearby amenities…
Taxation est. · year 1
- Rental income
- $35,714
- − Mortgage interest
- −$19,535
- − Property taxes
- −$5,231
- − Insurance
- −$1,744
- − Repairs & maintenance
- −$2,857
- − Management
- −$2,857
- − HOA
- −$504
- − Depreciation
- −$10,145
- Taxable loss
- −$7,159
- Est. tax savings @ 24.0%
- +$1,718
- After-tax cash flow
- $508/yr
For passive investors: Depreciation is non-cash, so a rental often shows a tax loss while cash-flowing — sheltering income. Rental losses are passive: they offset passive income freely, and up to $25,000/yr can offset ordinary (W-2) income if you actively participate and your MAGI is under $100k (phasing out to $0 by $150k); unused losses carry forward. On sale, claimed depreciation is recaptured at up to 25%, and gains may owe capital-gains tax (a 1031 exchange can defer both). Figures are a year-1 estimate at your 24.0% rate — not tax advice; consult a CPA.
Schools (NCES district)
- District
- Hanover Community School Corporation
- NCES district ID
- 1804350
- Math proficiency
- 49% ▼ -11.00%
- Reading proficiency
- 53% ▼ -7.00%
- Median HH income
- $68,151
- Composite
- 45.34/100
- National rank
- #2637
- State rank
- #38 of 301 in IN
Livability — St. John
No livability data for this city. (Only ~50 U.S. cities are tracked.)
Census & demographics
- Census place
- St. John, IN
- City population
- 18,509
- Population (ZIP)
- 18,509
Population outlook (Lake County) Hauer SSP2
- Today (2025)
- 484,026 people
- By 2030
- 478,091 · -1.2%
- By 2040
- 462,974 · -4.3%
- By 2050
- 449,894 · -7.1%
- By 2075
- 436,169 · -9.9%
- By 2100
- 426,607 · -11.9%
Race, ethnicity, and origin ACS 2023
- Neighborhood character
- Predominantly White (82%)
- Race & ethnicity
- White 82% Hispanic / Latino 9% Two or more races 5% Black 3% Asian 2%
- Hispanic origin (detail)
- Mexican 7% Puerto Rican 1%
- Common ancestry
- Romanian 21% Iranian 6% Lithuanian 2%
- Foreign-born
- 6% · Canada
- Languages at home
- 89% English-only · Spanish 5% Russian/Polish/Slavic 4% Other Indo-European 1%
Political lean MEDSL · Lake
- 2024 margin
- Lean D (+5.6) · D 52.1% · R 46.5% · Other 1.5%
- 2008→2024 swing
- -28.6pp toward R · 2008: 34.3pp · 2024: 5.6pp
- All cycles
- 2024: D+5.6 2020: D+15.1 2016: D+20.6 2012: D+31.0 2008: D+34.3
Not yet ingested
- Civics
- —
Market trends
- HPI YoY
- ▼ -69.86%
- Current HPI
- 224.1176
- Rent YoY
- —
- Metro
- —
- State GDP YoY
- ▲ 2.90%
- F500 in state
- 18
Industry mix (Fortune 500 HQ in IN)
| Industry | F500 HQs | Revenue |
|---|---|---|
| Industrial Machinery | 2 | $37B |
|
||
| Healthcare | 1 | $177B |
|
||
| Pharmaceuticals | 1 | $45B |
|
||
| Metals / Steel | 1 | $18B |
|
||
| Agriculture | 1 | $17B |
|
||
| Packaging | 1 | $12B |
|
||
Price history
+0.0% since first listed9 events — show timeline
- 2024-01-08 Listing Removed — NIRA MLS as Distributed by MLS Grid
- 2023-08-24 Relisted — NIRA MLS as Distributed by MLS Grid
- 2021-04-16 Listing Removed — MRED as Distributed by MLS Grid
- 2021-04-16 Listing Removed — MRED as Distributed by MLS Grid
- 2021-04-16 Delisted — IRMLS
- 2021-04-15 Listing Removed — NIRA MLS as Distributed by MLS Grid
- 2021-04-07 Listed $348,740 IRMLS
- 2021-04-02 Listed — MRED as Distributed by MLS Grid
- 2021-04-02 Listed $348,740 NIRA MLS as Distributed by MLS Grid
Cash-flow waterfall
monthlySold comps — $/sqft
last 12 mo · ≤1 miLoading sold comps…