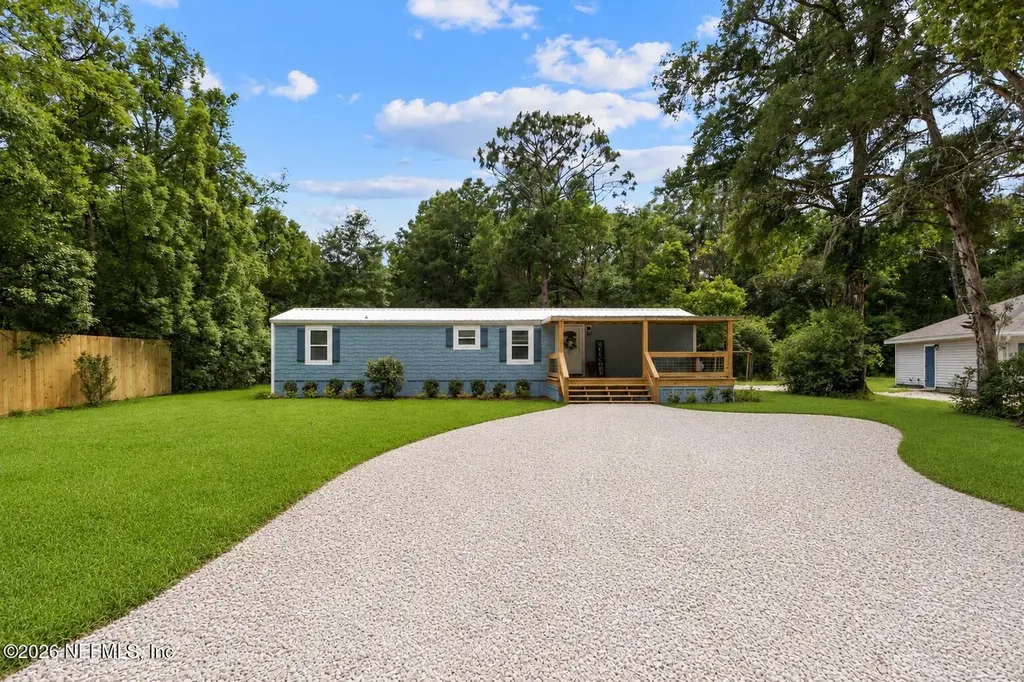
5162 Sweat Rd · Green Cove Springs, FL
Flood risk 1/10 · Minimal
- FEMA flood zone
- X (unshaded)
- Chance of flooding over 30 yrs
- 0.0%
- Est. flood insurance / yr
- $507 – $1,088
Fire risk 8/10 · Major
- Est. fire insurance / yr
- $947 – $1,759
Heat risk 8/10 · Major
- Hot days now (above 107°F)
- 7 days/yr
- Hot days in 30 yrs
- 20 days/yr
Wind risk 9/10 · Severe
- Chance of severe wind over 30 yrs
- 99.0%
Air-quality risk 3/10 · Minor
- Unhealthy air days now
- 2 days/yr
- Unhealthy air days in 30 yrs
- 3 days/yr
Risk factors via First Street. Map © Google.
Why this score? — see what drove the D+ grade
The composite is a weighted blend of 9 inputs, each scored 0–100. Each bar is that input's sub-score; the figure is the points it added to the 100-point composite (weight × sub-score).
- Cash flow +17.8/30.0
- ARV discount +7.5/15.0
- DSCR +5.6/10.0
- Schools +5.1/10.0
- 1% rule +4.8/10.0
- Livability +3.8/5.0
- Rent growth +2.6/5.0
- Condition / age +2.5/5.0
- Appreciation +0.0/10.0
$174,990
🖨 Deal sheet 📄 Offer letter ✓ Due diligence
Listing remarks MLS
Cleared & Ready-to-Build Lot in Green Cove Springs Don't miss this incredible opportunity to own .38 acres in the heart of Green Cove Springs! This property has already been prepped for your dream home—whether you're looking to build new construction or place a mobile/manufactured home, the hard work has been done for you. Brand new septic system Brand new well Cleared and ready for your plans Located in a peaceful setting while still just minutes to shopping, dining, schools, and the beautiful St. Johns River, this lot offers the perfect blend of convenience and country living. Bring your builder or your mobile home and make this property your own!
Key facts
- New metal roof
- Fresh paint
- New flooring
Tags
Property features AI
Finance
- HOA & community: Not a senior community
Exterior
- Parking: Additional parking
- Utilities: Septic tank; Electricity connected; Water connected
- Home design: Manufactured single-wide home; One level; Entry on level 1; Property is attached
- Construction: Fiber cement exterior; Metal roof
- Exterior features: Many trees; Wooded lot; County road frontage; Dirt road access
Interior
- Kitchen: Dishwasher; Electric oven; Electric range; Microwave; Refrigerator
- Bedrooms: 2 bedrooms
- Bathrooms: 2 full bathrooms
- Heating & cooling: Central heating; Central air
- Interior features: Central heating; Central air; Front porch
- Laundry & utility: Washer hookup in unit; Electric dryer hookup
Neighborhood map
What this means for you Summary
Snapshot
- This is a 2-bed/2.0-bath land listed at $175k.
Deal economics
- At list price, monthly cash flow is $145 ($2k/yr) — positive.
- The deal already cash-flows at list — no discount required.
- To meet the 1% rule (rent ≥ 1% of price), the offer needs to be $171k (2.1% below list).
- Recommended offer: $171k (2.1% below list) — sets the bar for 1% rule.
- Cap rate 7.3% vs local median 4.2% in Green Cove Springs — top-decile yield for the area; either an underpriced asset or a hidden risk that comps aren't pricing in. Stress-test before assuming the spread holds.
Location & tenants
- Location reads 75/100 on livability (#245 in FL, #3,868 nationally) — a middle-class / working-renter tenant base. Strengths: cost of living A+, housing A+, health & safety A+; Watch: schools C-, amenities F, commute F.
- Clay (suburban): math 58% / reading 59% proficiency, ranked #14 of 73 in FL (top 19%) — acceptable for families but not a draw, mixed tenant base, ~2y average lease.
- Market conditions: Rents flat; 885 active listings in the ZIP; solid renter incomes; 1,876 units permitted in Clay County in 2024 (14 in 5+ unit buildings).
Forward outlook
- Local home prices are declining (-3.0%/yr); year-one equity from $1k of loan paydown is wiped out by about $5k of value loss. Plan a longer hold.
- Clay County population projected at +19% by 2050 — long-run rental-demand tailwind backs the buy-and-hold thesis.
Negotiation context
- It's been on market 25 days — a 2% lower offer ($172k) is reasonable based on typical stale-listing flexibility.
- 2 sale attempts; this cycle's ask has dropped $10k (5%) from the opening price — seller is motivated, your offer sets the floor, not the list.
- Current owner paid $45k; list at $175k implies a 289% gain — meaningful room to come down on a strong offer.
Risks & watch-outs
- Climate carrying-cost: severe wind risk, 99% chance of damaging wind over 30y; severe wildfire risk; extreme-heat days projected 7→20/yr by 2055 (HVAC capex compounding) — expect insurance premiums to compound above CPI over the hold.
Questions for the listing agent
- Is there a deadline driving the sale (1031 exchange, divorce, estate, relocation)? That informs how much negotiation room exists.
- The area grade is low — what's the realistic commute time and amenity access for the typical tenant pool here? Any planned neighborhood developments (good or bad) we should know about?
- What's the average days-on-market for RENTAL listings here right now (not sales)? A rising rental-DOM trend means longer vacancies and softer asking-rent achievability than the comps imply.
- What's the recent tenant-quality profile in this submarket — average credit score on applications, eviction rate, late-payment / NSF rate, and stable-employment percentage? A property-management company in the area should have these aggregated.
- How much new for-sale + rental construction is in the pipeline within 1–3 miles? Heavy new supply typically softens prices + rents 12–24 months out; constrained supply supports both.
Investment metrics
- 1% rule
- 0.98% ✗
- Cap rate
- 7.28%
- Cash-on-cash
- 3.54%
- DSCR
- 1.16
- GRM
- 8.5
CMA / ARV
No comps found within radius.
Projected returns pro-forma
-3.0% appreciation · 0.46% rent growth · sell at horizon
- IRR
- -13.6%
- Equity multiple
- 0.52×
- Total profit
- $-23,391
- Equity at exit
- $26,092
- IRR
- -9.4%
- Equity multiple
- 0.49×
- Total profit
- $-25,063
- Equity at exit
- $15,130
Cash invested: $48,997 (down + closing). Projections, not guarantees.
Landlord ↔ Tenant lean methodology
- Overall (STATE)
- 87 Strongly Landlord-Friendly
- State Florida
- 87 Strongly Landlord-Friendly · R+3
- County
- — inherits STATE
- City
- — inherits STATE
ZIP-level market 32043
- Home prices YoY
- -26.3%
- Rents YoY
- 0.5%
- Active inventory
- 885
- Price-to-rent
- 8.5×
Monthly cashflow live
- Estimated rent
- $1,714 medium interval (Pro) →
- Mortgage (P&I)
- −$918
- Tax est. 1.5%
- −$219 /mo · $2,625/yr
- Insurance
- −$73
- HOA
- −$0
- Vacancy / Maint / Mgmt
- −$360
- Net cashflow
- $145
Break-even live
UW: 25.0% down · 7.5% · 30yr · 1.5% tax · 5.0% vac · 8.0% maint · 8.0% mgmt
Financing live
Cash to close
- Down payment
- $43,748
- Closing costs
- $5,250
- Reserves months
- —
- Total cash needed
- —
Loan-product check · same deal, 3 products live
Conventional
25% down · 7.5% · 30yr
- Down + closing
- —
- Monthly P&I
- —
- Monthly cashflow
- —
- DSCR
- —
- Eligible?
- —
Personal DTI + credit; lowest rate.
DSCR
20% down · 8.5% · 30yr
- Down + closing
- —
- Monthly P&I
- —
- Monthly cashflow
- —
- DSCR
- —
- Eligible?
- —
No personal income docs; deal must DSCR.
Hard money
10% down · 12.0% · 12mo
- Down + closing
- —
- Monthly P&I
- —
- Monthly cashflow
- —
- DSCR
- —
- Eligible?
- —
Short-term bridge; refi at stabilization.
Listing history 19 events
-
2026-06-18days on market $174,990 Active 25 DOM
-
2026-06-17days on market $174,990 Active 24 DOM
-
2026-06-16days on market $174,990 Active 23 DOM
-
2026-06-15days on market $174,990 Active 22 DOM
-
2026-06-13days on market $174,990 Active 20 DOM
-
2026-06-13pricedays on market $174,990 Active 19 DOM
-
2026-06-09days on market $184,500 Active 16 DOM
-
2026-06-08days on market $184,500 Active 15 DOM
-
2026-06-07days on market $184,500 Active 14 DOM
-
2026-06-03days on market $184,500 Active 10 DOM
-
2026-06-02days on market $184,500 Active 9 DOM
-
2026-06-01days on market $184,500 Active 8 DOM
-
2026-05-31days on market $184,500 Active 7 DOM
-
2026-05-24$184,500 Active
-
2025-09-23soldstatus $45,000
-
2025-09-22soldstatus $45,000 Closed 685-char remark
Show marketing remark (685 chars)
Cleared & Ready-to-Build Lot in Green Cove Springs Don't miss this incredible opportunity to own .38 acres in the heart of Green Cove Springs! This property has already been prepped for your dream home—whether you're looking to build new construction or place a mobile/manufactured home, the hard work has been done for you. Brand new septic system Brand new well Cleared and ready for your plans Located in a peaceful setting while still just minutes to shopping, dining, schools, and the beautiful St. Johns River, this lot offers the perfect blend of convenience and country living. Bring your builder or your mobile home and make this property your own!
-
2025-08-26status Pending 685-char remark
Show marketing remark (685 chars)
Cleared & Ready-to-Build Lot in Green Cove Springs Don't miss this incredible opportunity to own .38 acres in the heart of Green Cove Springs! This property has already been prepped for your dream home—whether you're looking to build new construction or place a mobile/manufactured home, the hard work has been done for you. Brand new septic system Brand new well Cleared and ready for your plans Located in a peaceful setting while still just minutes to shopping, dining, schools, and the beautiful St. Johns River, this lot offers the perfect blend of convenience and country living. Bring your builder or your mobile home and make this property your own!
-
2025-08-20price $50,000 685-char remark
Show marketing remark (685 chars)
Cleared & Ready-to-Build Lot in Green Cove Springs Don't miss this incredible opportunity to own .38 acres in the heart of Green Cove Springs! This property has already been prepped for your dream home—whether you're looking to build new construction or place a mobile/manufactured home, the hard work has been done for you. Brand new septic system Brand new well Cleared and ready for your plans Located in a peaceful setting while still just minutes to shopping, dining, schools, and the beautiful St. Johns River, this lot offers the perfect blend of convenience and country living. Bring your builder or your mobile home and make this property your own!
-
2025-08-19$80,000 Active 685-char remark
Show marketing remark (685 chars)
Cleared & Ready-to-Build Lot in Green Cove Springs Don't miss this incredible opportunity to own .38 acres in the heart of Green Cove Springs! This property has already been prepped for your dream home—whether you're looking to build new construction or place a mobile/manufactured home, the hard work has been done for you. Brand new septic system Brand new well Cleared and ready for your plans Located in a peaceful setting while still just minutes to shopping, dining, schools, and the beautiful St. Johns River, this lot offers the perfect blend of convenience and country living. Bring your builder or your mobile home and make this property your own!
ⓘ Source: listings_history table (triggers on properties + properties_extension) + one-shot
backfill from property_details.listing_events for pre-trigger history.
Climate risk First Street
- Flood 1/10 Low FEMA zone X (unshaded) · 0% chance over 30 yrs
- Wildfire 8/10 Severe
- Heat 8/10 Severe 7 d/yr ≥107°F today · 20 d/yr by 30 yrs out
- Wind 9/10 Extreme 99% chance of damaging wind over 30 yrs
- Air quality 3/10 Moderate 2 unhealthy d/yr today · 3 by 30 yrs out
Nearby sold comps map
Loading sold comps map…
Walkable amenities ~0.75 mi
Loading nearby amenities…
Taxation est. · year 1
- Rental income
- $20,566
- − Mortgage interest
- −$9,802
- − Property taxes
- −$2,625
- − Insurance
- −$875
- − Repairs & maintenance
- −$1,645
- − Management
- −$1,645
- − Depreciation
- −$5,091
- Taxable loss
- −$1,117
- Est. tax savings @ 24.0%
- +$268
- After-tax cash flow
- $2,004/yr
For passive investors: Depreciation is non-cash, so a rental often shows a tax loss while cash-flowing — sheltering income. Rental losses are passive: they offset passive income freely, and up to $25,000/yr can offset ordinary (W-2) income if you actively participate and your MAGI is under $100k (phasing out to $0 by $150k); unused losses carry forward. On sale, claimed depreciation is recaptured at up to 25%, and gains may owe capital-gains tax (a 1031 exchange can defer both). Figures are a year-1 estimate at your 24.0% rate — not tax advice; consult a CPA.
Schools (NCES district)
- District
- Clay
- NCES district ID
- 1200300
- Math proficiency
- 58% ▼ -8.00%
- Reading proficiency
- 59% ▼ -3.00%
- Median HH income
- $59,379
- Composite
- 50.73/100
- National rank
- #1815
- State rank
- #14 of 73 in FL
Livability — Green Cove Springs
- Score
- 75/100
- State rank
- #245
- US rank
- #3868
Category grades
Schools grade is shown separately in the Schools card above.
Census & demographics
- County
- Clay County · 208,450 people
- City population
- 34,562
- Metro
- Jacksonville, FL
- Population (ZIP)
- 34,562
- Household income
- $84,145
- Rent vs Own
- Severe rent burden
- 449.0
Population outlook (Clay County) Hauer SSP2
- Today (2025)
- 230,495 people
- By 2030
- 242,427 · +5.2%
- By 2040
- 262,244 · +13.8%
- By 2050
- 275,148 · +19.4%
- By 2075
- 295,397 · +28.2%
- By 2100
- 287,592 · +24.8%
Race, ethnicity, and origin ACS 2023
- Neighborhood character
- Predominantly White (77%)
- Race & ethnicity
- White 77% Black 10% Two or more races 7% Hispanic / Latino 6% Asian 2%
- Hispanic origin (detail)
- Mexican 2% Puerto Rican 1%
- Common ancestry
- Slovak 3% Romanian 2% Lithuanian 2%
- Foreign-born
- 5% · Canada
- Languages at home
- 92% English-only · Spanish 5% French/Haitian/Cajun 1% Other Indo-European 1%
Political lean MEDSL · Clay
- 2024 margin
- Solid R (+39.3) · D 29.9% · R 69.2%
- 2008→2024 swing
- +3.6pp toward D · 2008: -42.8pp · 2024: -39.3pp
- All cycles
- 2024: R+39.3 2020: R+37.1 2016: R+44.3 2012: R+45.8 2008: R+42.8
Not yet ingested
- Civics
- —
Market trends
- HPI YoY
- ▼ -107.34%
- Current HPI
- 301.3212
- Rent YoY
- ▲ 0.46%
- Metro
- Jacksonville, FL
- State GDP YoY
- ▲ 3.28%
- F500 in state
- 36
Industry mix (Fortune 500 HQ in FL)
| Industry | F500 HQs | Revenue |
|---|---|---|
| Industrial Technology | 2 | $29B |
|
||
| Insurance | 2 | $17B |
|
||
| Retail | 1 | $60B |
|
||
| Technology Distribution | 1 | $58B |
|
||
| Homebuilding | 1 | $35B |
|
||
| Technology Manufacturing | 1 | $35B |
|
||
Price history
+130.6% since first listed6 events — show timeline
- 2026-05-24 Listed $184,500 realMLS
- 2025-09-23 Sold (Public Records) $45,000 Public Records
- 2025-09-22 Sold (MLS) $45,000 realMLS
- 2025-08-26 Pending — realMLS
- 2025-08-20 Price Changed $50,000 realMLS
- 2025-08-19 Listed $80,000 realMLS
Property tax history
+3.6%/yrLatest (2025): $305 · +1.6% YoY. Source: county tax records.
Cash-flow waterfall
monthlySold comps — $/sqft
last 12 mo · ≤1 miLoading sold comps…