 🏷️ Likely Rental
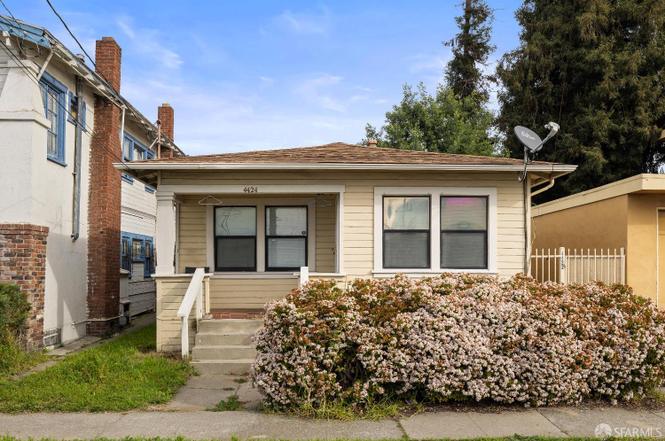
4422 Ygnacio Ave · Oakland, CA
Flood risk 1/10 · Minimal
- FEMA flood zone
- X (shaded)
- Chance of flooding over 30 yrs
- 0.0%
- Est. flood insurance / yr
- $507 – $1,088
Fire risk 1/10 · Minimal
- Est. fire insurance / yr
- $659 – $1,223
Heat risk 4/10 · Minor
- Hot days now (above 84°F)
- 7 days/yr
- Hot days in 30 yrs
- 15 days/yr
Wind risk 1/10 · Minimal
- Chance of severe wind over 30 yrs
- —
Air-quality risk 8/10 · Major
- Unhealthy air days now
- 14 days/yr
- Unhealthy air days in 30 yrs
- 14 days/yr
Risk factors via First Street. Map © Google.
Why this score? — see what drove the B grade
The composite is a weighted blend of 9 inputs, each scored 0–100. Each bar is that input's sub-score; the figure is the points it added to the 100-point composite (weight × sub-score).
- Cash flow +28.1/30.0
- ARV discount +15.0/15.0
- DSCR +10.0/10.0
- 1% rule +7.1/10.0
- Livability +3.6/5.0
- Rent growth +3.5/5.0
- Schools +3.0/10.0
- Condition / age +2.5/5.0
- Appreciation +0.0/10.0
$550,000
🖨 Deal sheet (PDF) 📄 Offer letter ✓ Due diligence
Multi-family units
County records classify this as Multi-Family (2-4 Unit). Listing-text estimate: 1 unit. estimate disagrees with records
Listing remarks
An exceptional opportunity to acquire a fully occupied four-unit investment property in the highly sought after Laurel District in Oakland, offering a compelling mix of unit types and rare owner-like amenities. This well-configured property consists of two duplexes on one large parcel of over 7,000/SF: One (2-bedroom) unit with its own separate address, private driveway, and dedicated two-car garage. Two (1-bedroom) units and One studio unit. The standout two-bedroom residence lives like a single-family home, providing privacy and separation that enhances tenant appeal and long-term rental stability. The remaining units are efficiently laid out and well-suited for consistent demand in the O
Key facts
- Private driveway
- Turnkey investment
- Private parking
Tags
Property features AI
Finance
- Other: Living area reported as 1,911 (source: not verified); Four total units; all four units are leased
- HOA & community: No association fee
Exterior
- Parking: Two covered parking spaces; Two total parking spaces; Private driveway and separate two-car garage serving Unit 1
- Security: Carbon monoxide detector(s); Double-strapped water heater
- Utilities: City utilities available; Electricity available (separate meters); Gas on separate meter; Public sewer (sewer connected); Water from water district with separate meter; Electric on property
- Home design: Residential income property — quadruplex; Built in 1921
- Construction: Composition roof; Concrete foundation
- Exterior features: Garden; Secluded lot
Interior
- Bedrooms: Four total bedrooms across units (unit breakdown below); Unit 1: Two-bedroom (with private driveway and separate two-car garage); Unit 2: Studio (with garden area); Unit 3: One-bedroom (street facing); Unit 4: One-bedroom
- Bathrooms: Four full bathrooms (total for the property)
- Interior features: Garden and secluded outdoor area; Carbon monoxide detector(s); Double-strapped water heater
Neighborhood map
What this means for you Summary
Snapshot
- This is a 5-bed/4.0-bath multifamily listed at $550k.
Deal economics
- At list price, monthly cash flow is $2k ($21k/yr) — positive.
- The deal already cash-flows at list — no discount required.
- Meets the 1% rule at list price ($7k rent vs $550k).
- Recommended offer: $517k (6.0% below list) — sets the bar for market timing.
- Cap rate 10.1% vs local median 2.5% in Oakland — top-decile yield for the area; either an underpriced asset or a hidden risk that comps aren't pricing in. Stress-test before assuming the spread holds.
Location & tenants
- Location reads 71/100 on livability (#224 in CA) — a middle-class / working-renter tenant base. Strengths: amenities A+, commute A+, employment A+; Watch: schools C-, crime F, cost of living F.
- Oakland Unified (urban): math 27% / reading 33% proficiency, ranked #1,007 of 1,400 in CA (top 72%) — families likely to look elsewhere, expect single-tenant / working-renter base with shorter leases; 68% free/reduced lunch — lower-income household profile, screen leases tightly.
- Market conditions: Rents rising (+3.9%/yr); 118 active listings in the ZIP; 3 comparable units currently listed for rent nearby; rentals lingering (median 45d on market — plan ~5-8 weeks vacancy on turnover, expect pricing pressure); 67% of comp listings sitting > 30 days — soft ceiling on asking rent; 1,742 units permitted in Alameda County in 2024 (856 in 5+ unit buildings).
- At $6,657/mo this rent would consume 110% of the median local household income ($72k/yr) (locally 3603% of renters already pay >50% of income on rent) — very limited rent-growth headroom before tenants either downsize or default.
Forward outlook
- Local home prices are declining (-3.0%/yr); year-one equity from $4k of loan paydown is wiped out by about $16k of value loss. Plan a longer hold.
- Alameda County population projected at +34% by 2050 — long-run rental-demand tailwind backs the buy-and-hold thesis.
- At projected returns (-3.0% appreciation + 3.9% rent growth), your $154k cash investment doubles in ~8 years — after that, you're playing with house money.
Negotiation context
- It's been on market 66 days — a 6% lower offer ($517k) is reasonable based on typical stale-listing flexibility.
- 2 sale attempts; this cycle's ask has dropped $49k (8%) from the opening price — seller is motivated, your offer sets the floor, not the list.
- Current owner paid $30k; list at $550k implies a 1733% gain — meaningful room to come down on a strong offer.
Risks & watch-outs
- Watch-outs: built in 1921 — expect roof / HVAC / electrical / plumbing capex.
Questions for the listing agent
- It's been on market 66 days. Have you received any prior offers? Is the seller open to a 6% concession, seller financing, or rate buy-down credit?
- Built in 1921 — when were the roof, HVAC, electrical panel, plumbing, and water heater last replaced?
- Why hasn't it sold? Are there any deal-killer items the seller is aware of (foundation, flood, title, zoning, code violations)?
- Is there a deadline driving the sale (1031 exchange, divorce, estate, relocation)? That informs how much negotiation room exists.
- Crime grade is F in this area — have there been break-ins, vandalism, or insurance claims at this property in the last 3 years? What carrier currently insures it and at what premium?
- What's the average days-on-market for RENTAL listings here right now (not sales)? A rising rental-DOM trend means longer vacancies and softer asking-rent achievability than the comps imply.
- What's the recent tenant-quality profile in this submarket — average credit score on applications, eviction rate, late-payment / NSF rate, and stable-employment percentage? A property-management company in the area should have these aggregated.
- How much new apartment / multifamily construction is in the pipeline within 1–3 miles? Heavy new supply (>2% of stock underway) typically softens rents 12–24 months out; light construction supports rent growth.
Investment metrics
- 1% rule
- 1.21% ✓
- Cap rate
- 10.06%
- Cash-on-cash
- 13.46%
- DSCR
- 1.60
- GRM
- 6.9
CMA / ARV
- ARV (on-the-fly)
- $749,112
- Comps found
- 4
Show comp detail 4 sales within ~0.75 mi
| Address | Dist | Beds/Ba | Sqft | Sold | Price | $/sf | Match |
|---|---|---|---|---|---|---|---|
| 4422 Ygnacio Ave | 0.00mi | 4/4.0 (-1) | 1,911 (0%) | 0mo | $550,000 | $288 | 95 |
| 3829 Brookdale Ave | 0.66mi | 5/3.0 | 1,922 (+1%) | 6mo | $815,000 | $424 | 59 |
| 1983 38th Ave | 0.44mi | 5/4.0 | 2,139 (+12%) | 2mo | $838,000 | $392 | 58 |
| 5431 Bancroft Ave | 0.63mi | 6/4.0 (+1) | 2,039 (+7%) | 22mo | $750,000 | $368 | 36 |
Match score weights: distance 35% · size 25% · config 20% · recency 20%. Top-matched comps best support the ARV.
Projected returns pro-forma
-3.0% appreciation · 3.89% rent growth · sell at horizon
- IRR
- 4.5%
- Equity multiple
- 1.17×
- Total profit
- $26,863
- Equity at exit
- $82,007
- IRR
- 14.7%
- Equity multiple
- 2.23×
- Total profit
- $189,948
- Equity at exit
- $47,554
Cash invested: $154,000 (down + closing). Projections, not guarantees.
Landlord ↔ Tenant lean methodology
- Overall (CITY)
- 0 Strongly Tenant-Friendly
- State California
- 18 Strongly Tenant-Friendly · D+13
- County
- — inherits STATE
- City Oakland
- 0 Strongly Tenant-Friendly · D+62
ZIP-level market 94601
- Rents YoY
- 3.9%
- Active inventory
- 118
- Price-to-rent
- 23.4×
Monthly cashflow live
- Estimated rent
- $6,657 medium interval (Pro) →
- Mortgage (P&I)
- −$2,884
- Tax from tax record
- −$418 /mo · $5,015/yr
- Insurance
- −$229
- HOA
- −$0
- Vacancy / Maint / Mgmt
- −$1,398
- Net cashflow
- $1,728
Break-even live
Sensitivity live
| Price | -10% $2,039 | -5% $1,883 | +0% $1,728 | +5% $1,572 | +10% $1,416 |
|---|---|---|---|---|---|
| Rent | -10% $1,202 | -5% $1,465 | +0% $1,728 | +5% $1,991 | +10% $2,254 |
| Rate | -1.0pp $2,005 | -0.5pp $1,868 | base $1,728 | +0.5pp $1,585 | +1.0pp $1,440 |
4-unit breakdown (identical units grouped — click to expand)
| Units | Beds | Baths | Est. rent |
|---|---|---|---|
| 1× unit | 2 | 2 | $1,957 |
| 3× units | 1 | 1 | $4,701 |
| #2 | 1 | 1 | $1,567 |
| #3 | 1 | 1 | $1,567 |
| #4 | 1 | 1 | $1,567 |
| Total (4 units) | $6,657 | ||
UW: 25.0% down · 7.5% · 30yr · 1.5% tax · 5.0% vac · 8.0% maint · 8.0% mgmt
Financing live
Cash to close
- Down payment
- $137,500
- Closing costs
- $16,500
- Reserves months
- —
- Total cash needed
- —
Loan-product check · same deal, 3 products live
Conventional
25% down · 7.5% · 30yr
- Down + closing
- —
- Monthly P&I
- —
- Monthly cashflow
- —
- DSCR
- —
- Eligible?
- —
Personal DTI + credit; lowest rate.
DSCR
20% down · 8.5% · 30yr
- Down + closing
- —
- Monthly P&I
- —
- Monthly cashflow
- —
- DSCR
- —
- Eligible?
- —
No personal income docs; deal must DSCR.
Hard money
10% down · 12.0% · 12mo
- Down + closing
- —
- Monthly P&I
- —
- Monthly cashflow
- —
- DSCR
- —
- Eligible?
- —
Short-term bridge; refi at stabilization.
Rent comps 3 comps
| Address | Beds | Baths | Sqft | Rent | $/sqft | DOM | Units | Dist |
|---|---|---|---|---|---|---|---|---|
| 5875 Picardy Dr Oakland, CA | 4.0 | 2.5 | 1906 | $5,200 | $2.73 | 45d | 1 | 1.19mi |
| 2422 E 24th St Unit 1 Oakland, CA | 5.0 | 1.0 | 2364 | $3,500 | $1.48 | 45d | 1 | 1.30mi |
| 2900 Sheffield Ave Oakland, CA | 4.0 | 2.0 | 1692 | $7,000 | $4.14 | 5d | 1 | 1.46mi |
Listing history 5 events
-
2026-04-08status Pending
-
2026-04-07status Active
-
2026-03-05price $550,000
-
2026-01-23$599,000 Active
-
1980-06-30soldstatus $30,000
ⓘ Source: listings_history table (triggers on properties + properties_extension) + one-shot
backfill from property_details.listing_events for pre-trigger history.
Tax reassessment forecast CA · Resets to sale price
- Current annual tax
- $5,015 · $418/mo
- Projected year-2 tax
- $5,015 · $418/mo
- Expected delta
- $0/yr ($0/mo · 0.0%)
ⓘ Screening estimate from a state-policy table — verify with the county assessor before closing.
Climate risk First Street
- Flood 1/10 Low FEMA zone X (shaded) · 0% chance over 30 yrs
- Wildfire 1/10 Low
- Heat 4/10 Moderate 7 d/yr ≥84°F today · 15 d/yr by 30 yrs out
- Wind 1/10 Low
- Air quality 8/10 Severe 14 unhealthy d/yr today · 14 by 30 yrs out
Nearby sold comps map
Loading sold comps map…
Walkable amenities ~0.75 mi
Loading nearby amenities…
Taxation est. · year 1
- Rental income
- $79,884
- − Mortgage interest
- −$30,809
- − Property taxes
- −$5,015
- − Insurance
- −$2,750
- − Repairs & maintenance
- −$6,391
- − Management
- −$6,391
- − Depreciation
- −$16,000
- Taxable income
- $12,529
- Est. tax owed @ 24.0%
- −$3,007
- After-tax cash flow
- $17,725/yr
For passive investors: Depreciation is non-cash, so a rental often shows a tax loss while cash-flowing — sheltering income. Rental losses are passive: they offset passive income freely, and up to $25,000/yr can offset ordinary (W-2) income if you actively participate and your MAGI is under $100k (phasing out to $0 by $150k); unused losses carry forward. On sale, claimed depreciation is recaptured at up to 25%, and gains may owe capital-gains tax (a 1031 exchange can defer both). Figures are a year-1 estimate at your 24.0% rate — not tax advice; consult a CPA.
Schools (NCES district)
- District
- Oakland Unified
- NCES district ID
- 0628050
- Math proficiency
- 27% ▬ 0.00%
- Reading proficiency
- 33% ▬ 0.00%
- Median HH income
- $55,194
- Composite
- 29.52/100
- National rank
- #11769
- State rank
- #1007 of 1400 in CA
Livability — Oakland
- Score
- 71/100
- State rank
- #224
- US rank
- #7245
Category grades
Schools grade is shown separately in the Schools card above.
Census & demographics
- Census place
- Oakland, CA
- County
- Alameda County · 1,614,355 people
- City population
- 385,993
- Metro
- San Francisco-Oakland-Berkeley, CA
- Population (ZIP)
- 53,259
- Household income
- $72,359
- Rent vs Own
- Severe rent burden
- 3603.0
Population outlook (Alameda County) Hauer SSP2
- Today (2025)
- 1,928,884 people
- By 2030
- 2,069,146 · +7.3%
- By 2040
- 2,338,405 · +21.2%
- By 2050
- 2,586,608 · +34.1%
- By 2075
- 3,061,911 · +58.7%
- By 2100
- 3,234,133 · +67.7%
Race, ethnicity, and origin ACS 2023
- Neighborhood character
- Diverse neighborhood (Simpson 0.66)
- Race & ethnicity
- Hispanic / Latino 53% Asian 18% Black 13% White 11% Two or more races 10% Native American 3%
- Hispanic origin (detail)
- Mexican 35%
- Common ancestry
- Italian 1% Scotch-Irish 1%
- Foreign-born
- 40% · Canada, Vietnam, China
- Languages at home
- 35% English-only · Spanish 46% Chinese 5% Vietnamese 4%
Political lean MEDSL · Alameda
- 2024 margin
- Solid D (+53.6) · D 74.6% · R 21.0% · Other 4.4%
- 2008→2024 swing
- -5.9pp toward R · 2008: 59.5pp · 2024: 53.6pp
- All cycles
- 2024: D+53.6 2020: D+62.5 2016: D+64.4 2012: D+59.8 2008: D+59.5
Not yet ingested
- Civics
- —
Market trends
- HPI YoY
- ▼ -1045.52%
- Current HPI
- 347.3256
- Rent YoY
- ▲ 3.89%
- Metro
- San Francisco-Oakland-Berkeley, CA
- State GDP YoY
- ▲ 3.21%
- F500 in state
- 116
Industry mix (Fortune 500 HQ in CA)
| Industry | F500 HQs | Revenue |
|---|---|---|
| Technology | 27 | $1,492B |
|
||
| Financial Services | 3 | $174B |
|
||
| Retail | 3 | $44B |
|
||
| Insurance | 3 | $26B |
|
||
| Media / Entertainment | 2 | $115B |
|
||
| Pharmaceuticals / Biotech | 2 | $62B |
|
||
Price history
+1733.3% since first listed5 events — show timeline
- 2026-04-08 Pending — San Francisco MLS
- 2026-04-07 Relisted — San Francisco MLS
- 2026-03-05 Price Changed $550,000 San Francisco MLS
- 2026-01-23 Listed $599,000 San Francisco MLS
- 1980-06-30 Sold (Public Records) $30,000 Public Records
Property tax history
+5.1%/yrLatest (2025): $5,015 · +6.2% YoY. Source: county tax records.
Cash-flow waterfall
monthlySold comps — $/sqft
last 12 mo · ≤1 miLoading sold comps…