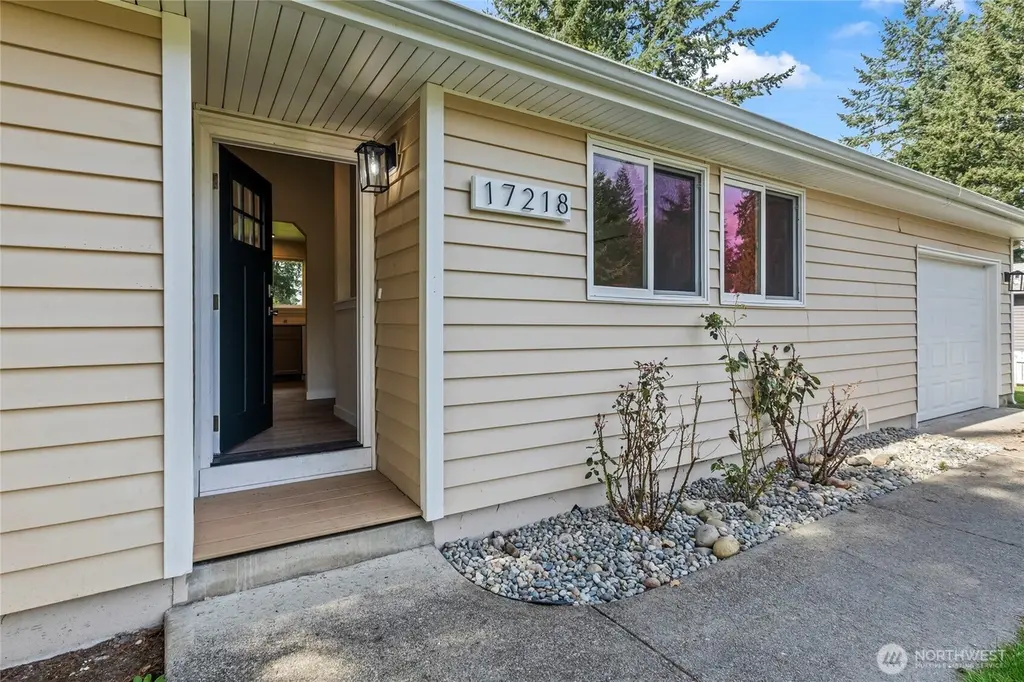
17218 12th Ave E · Spanaway, WA
Flood risk 1/10 · Minimal
- FEMA flood zone
- X (unshaded)
- Chance of flooding over 30 yrs
- 0.0%
- Est. flood insurance / yr
- $507 – $1,088
Fire risk 1/10 · Minimal
- Est. fire insurance / yr
- $604 – $1,122
Heat risk 3/10 · Minor
- Hot days now (above 87°F)
- 7 days/yr
- Hot days in 30 yrs
- 15 days/yr
Wind risk 1/10 · Minimal
- Chance of severe wind over 30 yrs
- —
Air-quality risk 7/10 · Major
- Unhealthy air days now
- 9 days/yr
- Unhealthy air days in 30 yrs
- 10 days/yr
Risk factors via First Street. Map © Google.
Why this score? — see what drove the C+ grade
The composite is a weighted blend of 9 inputs, each scored 0–100. Each bar is that input's sub-score; the figure is the points it added to the 100-point composite (weight × sub-score).
- Cash flow +19.3/30.0
- ARV discount +15.0/15.0
- DSCR +6.1/10.0
- 1% rule +5.1/10.0
- Schools +4.9/10.0
- Livability +3.7/5.0
- Rent growth +3.6/5.0
- Condition / age +2.5/5.0
- Appreciation +0.0/10.0
$270,000
🖨 Deal sheet 📄 Offer letter ✓ Due diligence
Listing remarks
Permanent affordability – that's the goal of Tacoma/Pierce County Habitat For Humanity with their new ground lease model. Interested? You must be an income-qualified, first-time home buyer and work with a Washington State Housing Finance Commission – approved lender. Up to $65,000 down payment assistance available for qualified buyers. All potential buyers must complete & agree to Habitat’s pre-submittal checklist (including a housing counseling appointment) before submitting an offer. If you thought home ownership was out of reach, this program may be the opportunity you've been waiting for. This home has been extensively renovated with new flooring, a new roof, mod
Key facts
- Modern kitchen
- New roof
- New windows
Tags
Neighborhood map
What this means for you Summary
Snapshot
- This is a 3-bed/1.0-bath single-family listed at $270k.
Deal economics
- At list price, monthly cash flow is $294 ($4k/yr) — positive.
- The deal already cash-flows at list — no discount required.
- Meets the 1% rule at list price ($3k rent vs $270k).
- Recommended offer: $262k (3.0% below list) — sets the bar for market timing.
- Cap rate 7.6% vs local median 3.5% in Spanaway — top-decile yield for the area; either an underpriced asset or a hidden risk that comps aren't pricing in. Stress-test before assuming the spread holds.
Location & tenants
- Location reads 74/100 on livability (#184 in WA, #4,891 nationally) — a middle-class / working-renter tenant base. Strengths: housing A+, employment A, commute A-; Watch: cost of living C-, health & safety C-, crime D-.
- Bethel School District (suburban): math 47% / reading 59% proficiency, ranked #103 of 291 in WA (top 35%) — acceptable for families but not a draw, mixed tenant base, ~2y average lease.
- Zoned schools: Evergreen Elementary (539 students, 64% FRL); Spanaway Lake High School (1,817 students, 64% FRL) — zoned schools average 64% FRL vs 36% district-wide (27 pts higher); higher-poverty schools than district average — tighter screening recommended.
- Market conditions: Rents rising fast (+4.2%/yr); 383 active listings in the ZIP; 11 comparable units currently listed for rent nearby; rentals at typical pace (median 22d on market — plan ~3-4 weeks tenant-placement turnaround); solid renter incomes; 3,209 units permitted in Pierce County in 2024 (1,269 in 5+ unit buildings).
- This rent runs 31% of the median local income ($107k/yr) — at the standard rent-burdened threshold; future hikes will face affordability resistance.
Forward outlook
- Local home prices are declining (-3.0%/yr); year-one equity from $2k of loan paydown is wiped out by about $8k of value loss. Plan a longer hold.
- Pierce County population projected at +26% by 2050 — long-run rental-demand tailwind backs the buy-and-hold thesis.
Negotiation context
- It's been on market 35 days — a 3% lower offer ($262k) is reasonable based on typical stale-listing flexibility.
- 2 sale attempts since 2y ago with the ask held roughly flat each time — persistent listings suggest the price (not the market) is what's stuck; bring a comps-based counter.
Questions for the listing agent
- It's been on market 35 days. Have you received any prior offers? Is the seller open to a 3% concession, seller financing, or rate buy-down credit?
- Is there a deadline driving the sale (1031 exchange, divorce, estate, relocation)? That informs how much negotiation room exists.
- Schools are B-rated — typically a magnet for longer-tenancy family renters. What's the average tenant stay here, and is there a school-zone premium baked into asking?
- Crime grade is D in this area — have there been break-ins, vandalism, or insurance claims at this property in the last 3 years? What carrier currently insures it and at what premium?
- What's the average days-on-market for RENTAL listings here right now (not sales)? A rising rental-DOM trend means longer vacancies and softer asking-rent achievability than the comps imply.
- What's the recent tenant-quality profile in this submarket — average credit score on applications, eviction rate, late-payment / NSF rate, and stable-employment percentage? A property-management company in the area should have these aggregated.
- How much new for-sale + rental construction is in the pipeline within 1–3 miles? Heavy new supply typically softens prices + rents 12–24 months out; constrained supply supports both.
Investment metrics
- 1% rule
- 1.01% ✓
- Cap rate
- 7.60%
- Cash-on-cash
- 4.67%
- DSCR
- 1.21
- GRM
- 8.2
CMA / ARV
- ARV (on-the-fly)
- $395,784
- Comps found
- 12
Show comp detail 12 sales within ~0.75 mi
| Address | Dist | Beds/Ba | Sqft | Sold | Price | $/sf | Match |
|---|---|---|---|---|---|---|---|
| 17218 12th Ave E | 0.00mi | 3/1.0 | 956 (0%) | 1mo | $270,000 | $282 | 99 |
| 16805 9th Ave E | 0.33mi | 3/1.0 | 936 (-2%) | 0mo | $350,000 | $374 | 81 |
| 17224 E 10th Ave | 0.19mi | 3/1.0 | 1,032 (+8%) | 2mo | $435,000 | $422 | 76 |
| 17220 13th Ave E | 0.09mi | 3/1.0 | 1,067 (+12%) | 5mo | $350,000 | $328 | 73 |
| 17415 6th Ave E | 0.45mi | 3/1.0 | 1,016 (+6%) | 0mo | $429,950 | $423 | 68 |
| 16716 16th Avenue Ct E | 0.44mi | 2/1.0 (-1) | 920 (-4%) | 1mo | $410,000 | $446 | 68 |
| 17008 E 21st Avenue Ct E | 0.63mi | 3/1.0 | 965 (+1%) | 3mo | $415,000 | $430 | 67 |
| 17526 6th Avenue Ct E | 0.45mi | 3/1.0 | 1,016 (+6%) | 3mo | $350,000 | $344 | 66 |
| 17513 6th Ave Ct E | 0.42mi | 3/1.0 | 1,024 (+7%) | 5mo | $397,000 | $388 | 65 |
| 17012 17th Avenue Ct E | 0.37mi | 3/1.0 | 1,056 (+10%) | 6mo | $437,500 | $414 | 61 |
| 16909 19th Ave E | 0.51mi | 3/1.0 | 1,055 (+10%) | 3mo | $365,000 | $346 | 56 |
| 17011 21st Ave E | 0.61mi | 3/1.0 | 1,056 (+10%) | 5mo | $445,000 | $421 | 50 |
Match score weights: distance 35% · size 25% · config 20% · recency 20%. Top-matched comps best support the ARV.
Projected returns pro-forma
-3.0% appreciation · 4.24% rent growth · sell at horizon
- IRR
- -7.6%
- Equity multiple
- 0.72×
- Total profit
- $-21,530
- Equity at exit
- $40,258
- IRR
- 3.5%
- Equity multiple
- 1.27×
- Total profit
- $20,067
- Equity at exit
- $23,345
Cash invested: $75,600 (down + closing). Projections, not guarantees.
Landlord ↔ Tenant lean methodology
- Overall (STATE)
- 28 Tenant-Leaning
- State Washington
- 28 Tenant-Leaning · D+8
- County
- — inherits STATE
- City
- — inherits STATE
ZIP-level market 98387
- Rents YoY
- 4.2%
- Active inventory
- 383
- Price-to-rent
- 8.2×
Monthly cashflow live
- Estimated rent
- $2,734 high interval (Pro) →
- Mortgage (P&I)
- −$1,416
- Tax est. 1.5%
- −$338 /mo · $4,050/yr
- Insurance
- −$112
- HOA
- −$0
- Vacancy / Maint / Mgmt
- −$574
- Net cashflow
- $294
Break-even live
UW: 25.0% down · 7.5% · 30yr · 1.5% tax · 5.0% vac · 8.0% maint · 8.0% mgmt
Financing live
Cash to close
- Down payment
- $67,500
- Closing costs
- $8,100
- Reserves months
- —
- Total cash needed
- —
Loan-product check · same deal, 3 products live
Conventional
25% down · 7.5% · 30yr
- Down + closing
- —
- Monthly P&I
- —
- Monthly cashflow
- —
- DSCR
- —
- Eligible?
- —
Personal DTI + credit; lowest rate.
DSCR
20% down · 8.5% · 30yr
- Down + closing
- —
- Monthly P&I
- —
- Monthly cashflow
- —
- DSCR
- —
- Eligible?
- —
No personal income docs; deal must DSCR.
Hard money
10% down · 12.0% · 12mo
- Down + closing
- —
- Monthly P&I
- —
- Monthly cashflow
- —
- DSCR
- —
- Eligible?
- —
Short-term bridge; refi at stabilization.
Rent comps 11 comps
| Address | Beds | Baths | Sqft | Rent | $/sqft | DOM | Units | Dist |
|---|---|---|---|---|---|---|---|---|
| 17211 13th Ave E Spanaway, WA | 4.0 | 1.0 | 924 | $2,995 | $3.24 | 18d | 1 | 0.10mi |
| 17121 B St E Spanaway, WA | 2.0 | 1.0 | 1000 | $2,400 | $2.40 | 24d | 1 | 0.71mi |
| 16912 B St E Spanaway, WA | 2.0 | 1.0 | 750 | $1,795 | $2.39 | 20d | 1 | 0.77mi |
| 302 163 St Ct E Unit 6 Tacoma, WA | 2.0 | 1.0 | 793 | $1,450 | $1.83 | 21d | 1 | 0.82mi |
| 15909 18th Avenue Ct E Tacoma, WA | 2.0 | 1.5 | 1050 | $2,050 | $1.95 | 24d | 1 | 0.97mi |
| 402 166th St S Unit NA Spanaway, WA | 2.0 | 1.0 | 815 | $2,275 | $2.79 | 24d | 1 | 1.21mi |
| 402 166th St S Spanaway, WA | 2.0 | 1.0 | 815 | $2,275 | $2.79 | 18d | 1 | 1.21mi |
| 1009 153rd St Ct E Tacoma, WA | 2.0 | 1.0 | 900 | $2,150 | $2.39 | 14d | 1 | 1.22mi |
| 19316 Twinkle Dr E Spanaway, WA | 3.0 | 1.0 | 975 | $1,975 | $2.03 | 24d | 1 | 1.32mi |
| 19012 B St E Spanaway, WA | 2.0 | 1.0 | 850 | $1,400 | $1.65 | 24d | 1 | 1.34mi |
| 15417 25th Ave E Tacoma, WA | 3.0 | 1.0 | 960 | $2,150 | $2.24 | 4d | 1 | 1.41mi |
Listing history 7 events
-
2026-04-17status Pending
-
2026-03-12$270,000 Active
-
2024-05-30soldstatus $375,000
-
2024-05-30$375,000
-
1993-12-08soldstatus $80,000
-
1988-04-01soldstatus $54,950
-
1986-09-22soldstatus $15,000
ⓘ Source: listings_history table (triggers on properties + properties_extension) + one-shot
backfill from property_details.listing_events for pre-trigger history.
Climate risk First Street
- Flood 1/10 Low FEMA zone X (unshaded) · 0% chance over 30 yrs
- Wildfire 1/10 Low
- Heat 3/10 Moderate 7 d/yr ≥87°F today · 15 d/yr by 30 yrs out
- Wind 1/10 Low
- Air quality 7/10 Severe 9 unhealthy d/yr today · 10 by 30 yrs out
Nearby sold comps map
Loading sold comps map…
Walkable amenities ~0.75 mi
Loading nearby amenities…
Taxation est. · year 1
- Rental income
- $32,809
- − Mortgage interest
- −$15,124
- − Property taxes
- −$4,050
- − Insurance
- −$1,350
- − Repairs & maintenance
- −$2,625
- − Management
- −$2,625
- − Depreciation
- −$7,855
- Taxable loss
- −$819
- Est. tax savings @ 24.0%
- +$197
- After-tax cash flow
- $3,725/yr
For passive investors: Depreciation is non-cash, so a rental often shows a tax loss while cash-flowing — sheltering income. Rental losses are passive: they offset passive income freely, and up to $25,000/yr can offset ordinary (W-2) income if you actively participate and your MAGI is under $100k (phasing out to $0 by $150k); unused losses carry forward. On sale, claimed depreciation is recaptured at up to 25%, and gains may owe capital-gains tax (a 1031 exchange can defer both). Figures are a year-1 estimate at your 24.0% rate — not tax advice; consult a CPA.
Schools (NCES district)
- District
- Bethel School District
- NCES district ID
- 5300480
- Math proficiency
- 47% ▬ 0.00%
- Reading proficiency
- 59% ▲ 2.00%
- Median HH income
- $65,872
- Composite
- 48.66/100
- National rank
- #4568
- State rank
- #103 of 291 in WA
Livability — Spanaway
- Score
- 74/100
- State rank
- #184
- US rank
- #4891
Category grades
Schools grade is shown separately in the Schools card above.
Census & demographics
- Census place
- Spanaway, WA
- County
- Pierce County · 788,257 people
- City population
- 50,774
- Metro
- Seattle-Tacoma-Bellevue, WA
- Population (ZIP)
- 50,774
- Household income
- $106,872
- Rent vs Own
- Severe rent burden
- 807.0
Population outlook (Pierce County) Hauer SSP2
- Today (2025)
- 956,648 people
- By 2030
- 1,010,862 · +5.7%
- By 2040
- 1,113,170 · +16.4%
- By 2050
- 1,206,524 · +26.1%
- By 2075
- 1,436,425 · +50.2%
- By 2100
- 1,563,654 · +63.5%
Race, ethnicity, and origin ACS 2023
- Neighborhood character
- Diverse neighborhood (Simpson 0.68)
- Race & ethnicity
- White 53% Two or more races 18% Hispanic / Latino 16% Black 10% Asian 6% Pacific Islander 4%
- Hispanic origin (detail)
- Mexican 10% Puerto Rican 2%
- Common ancestry
- Portuguese 3% Italian 3% Slovak 2%
- Foreign-born
- 11% · Canada, South Korea
- Languages at home
- 82% English-only · Spanish 7% Russian/Polish/Slavic 2% Other Asian/Pacific 2%
Political lean MEDSL · Pierce
- 2024 margin
- D (+10.8) · D 53.9% · R 43.1% · Other 3.0%
- 2008→2024 swing
- -1.4pp toward R · 2008: 12.2pp · 2024: 10.8pp
- All cycles
- 2024: D+10.8 2020: D+11.2 2016: D+7.5 2012: D+11.0 2008: D+12.2
Not yet ingested
- Civics
- —
Market trends
- HPI YoY
- ▼ -208.94%
- Current HPI
- 308.0462
- Rent YoY
- ▲ 4.24%
- Metro
- Seattle-Tacoma-Bellevue, WA
- State GDP YoY
- ▲ 4.65%
- F500 in state
- 22
Industry mix (Fortune 500 HQ in WA)
| Industry | F500 HQs | Revenue |
|---|---|---|
| Retail | 2 | $269B |
|
||
| Technology / Retail | 1 | $638B |
|
||
| Technology | 1 | $245B |
|
||
| Telecommunications | 1 | $38B |
|
||
| Food / Beverage | 1 | $36B |
|
||
| Automotive / Trucks | 1 | $34B |
|
||
Price history
+1700.0% since first listed7 events — show timeline
- 2026-04-17 Pending — NWMLS as Distributed by MLS Grid
- 2026-03-12 Listed $270,000 NWMLS as Distributed by MLS Grid
- 2024-05-30 Listed $375,000 NWMLS as Distributed by MLS Grid
- 2024-05-30 Sold (MLS) $375,000 NWMLS as Distributed by MLS Grid
- 1993-12-08 Sold (Public Records) $80,000 Public Records
- 1988-04-01 Sold (Public Records) $54,950 Public Records
- 1986-09-22 Sold (Public Records) $15,000 Public Records
Property tax history
-2.0%/yrLatest (2026): $168 · +7.2% YoY. Source: county tax records.
Cash-flow waterfall
monthlySold comps — $/sqft
last 12 mo · ≤1 miLoading sold comps…