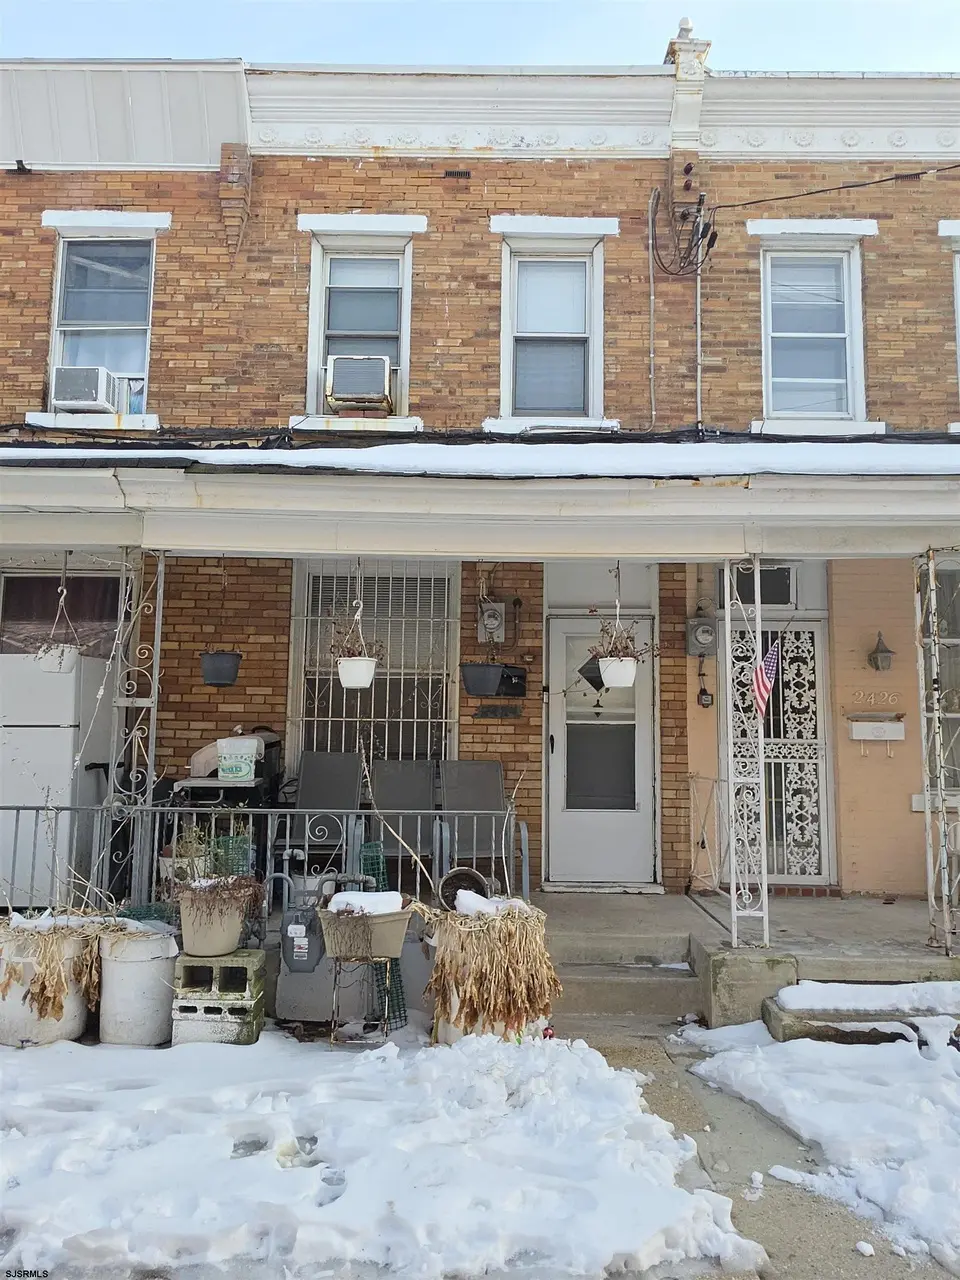
2424 Trenwith Ter · Atlantic City, NJ
Flood risk 6/10 · Moderate
- FEMA flood zone
- AE
- Chance of flooding over 30 yrs
- 0.57%
- Est. flood insurance / yr
- $1,737 – $8,500
Fire risk 1/10 · Minimal
- Est. fire insurance / yr
- $526 – $976
Heat risk 9/10 · Severe
- Hot days now (above 94°F)
- 7 days/yr
- Hot days in 30 yrs
- 17 days/yr
Wind risk 8/10 · Major
- Chance of severe wind over 30 yrs
- 80.0%
Air-quality risk 3/10 · Minor
- Unhealthy air days now
- 2 days/yr
- Unhealthy air days in 30 yrs
- 3 days/yr
Risk factors via First Street. Map © Google.
Why this score? — see what drove the B- grade
The composite is a weighted blend of 9 inputs, each scored 0–100. Each bar is that input's sub-score; the figure is the points it added to the 100-point composite (weight × sub-score).
- Cash flow +29.8/30.0
- DSCR +10.0/10.0
- 1% rule +8.2/10.0
- ARV discount +7.5/15.0
- Rent growth +3.9/5.0
- Livability +2.8/5.0
- Condition / age +2.5/5.0
- Schools +1.4/10.0
- Appreciation +0.0/10.0
$170,000
🖨 Deal sheet 📄 Offer letter ✓ Due diligence
Listing remarks MLS
Turnkey investment opportunity in Atlantic City with a long-term tenant paying $1,300/month ($15,600 annually). This 3-bedroom, 2 full bath home features a highly desirable first-floor bedroom and full bath, ideal for added convenience and rental appeal. Main level also offers a living room and eat-in kitchen, with two additional bedrooms and a second full bath upstairs. Includes front porch, rear patio, and basement storage. Low annual utilities (water $323, sewer $605) create strong cash flow with approximately $12,417 net income. Immediate income-producing property perfect for investors. Interior photos coming soon.
Key facts
- Living room
- Eat in kitchen
- Front porch
Tags
Neighborhood map
What this means for you Summary
Snapshot
- This is a 3-bed/2.0-bath single-family listed at $170k.
Deal economics
- At list price, monthly cash flow is $197 ($2k/yr) — positive.
- The deal already cash-flows at list — no discount required.
- Meets the 1% rule at list price ($2k rent vs $170k).
- Recommended offer: $150k (12.0% below list) — sets the bar for market timing.
- Cap rate 10.7% vs local median 3.7% in Atlantic City — top-decile yield for the area; either an underpriced asset or a hidden risk that comps aren't pricing in. Stress-test before assuming the spread holds.
Location & tenants
- Location reads 55/100 on livability (#525 in NJ) — a working-class tenant base; expect higher turnover. Strengths: health & safety A; Watch: commute D, schools F, crime F.
- Atlantic City School District (urban): math 9% / reading 26% proficiency, ranked #454 of 472 in NJ (top 96%) — low school quality limits family demand, transient renter base, plan for 1-2y turnover; 85% free/reduced lunch — lower-income household profile, screen leases tightly.
- Market conditions: Rents rising fast (+5.5%/yr); 482 active listings in the ZIP; 18 comparable units currently listed for rent nearby; rentals at typical pace (median 21d on market — plan ~3-4 weeks tenant-placement turnaround); lower-income renter base — watch delinquency; 672 units permitted in Atlantic County in 2024 (258 in 5+ unit buildings).
- At $2,245/mo this rent would consume 66% of the median local household income ($41k/yr) (locally 3414% of renters already pay >50% of income on rent) — very limited rent-growth headroom before tenants either downsize or default.
Forward outlook
- Local home prices are declining (-3.0%/yr); year-one equity from $1k of loan paydown is wiped out by about $5k of value loss. Plan a longer hold.
- Atlantic County population projected at -12% by 2050 — secular population decline; favor cash flow + early exit over multi-decade hold.
Negotiation context
- It's been on market 135 days — a 12% lower offer ($150k) is reasonable based on typical stale-listing flexibility.
- 2 sale attempts since 6y ago with the ask held roughly flat each time — persistent listings suggest the price (not the market) is what's stuck; bring a comps-based counter.
- Current owner paid $145k; 17% above their basis — modest negotiation headroom, anchor on the comps not their cost.
Risks & watch-outs
- Watch-outs: flood insurance adds $427/mo; built in 1910 — expect roof / HVAC / electrical / plumbing capex.
- Climate carrying-cost: in FEMA flood zone AE (mandatory federal flood insurance); severe wind risk, 80% chance of damaging wind over 30y; extreme-heat days projected 7→17/yr by 2055 (HVAC capex compounding) — expect insurance premiums to compound above CPI over the hold.
Questions for the listing agent
- It's been on market 135 days. Have you received any prior offers? Is the seller open to a 12% concession, seller financing, or rate buy-down credit?
- Built in 1910 — when were the roof, HVAC, electrical panel, plumbing, and water heater last replaced?
- What's the actual annual flood-insurance premium (NFIP or private), and is the property in a SFHA with mandatory coverage?
- Why hasn't it sold? Are there any deal-killer items the seller is aware of (foundation, flood, title, zoning, code violations)?
- Is there a deadline driving the sale (1031 exchange, divorce, estate, relocation)? That informs how much negotiation room exists.
- Schools are F-rated, which usually means shorter tenancies and higher turnover. Who's the typical renter profile here, and what's been the actual vacancy rate?
- Crime grade is F in this area — have there been break-ins, vandalism, or insurance claims at this property in the last 3 years? What carrier currently insures it and at what premium?
- What's the average days-on-market for RENTAL listings here right now (not sales)? A rising rental-DOM trend means longer vacancies and softer asking-rent achievability than the comps imply.
- What's the recent tenant-quality profile in this submarket — average credit score on applications, eviction rate, late-payment / NSF rate, and stable-employment percentage? A property-management company in the area should have these aggregated.
- How much new for-sale + rental construction is in the pipeline within 1–3 miles? Heavy new supply typically softens prices + rents 12–24 months out; constrained supply supports both.
Investment metrics
- 1% rule
- 1.32% ✓
- Cap rate
- 10.69%
- Cash-on-cash
- 15.72%
- DSCR
- 1.70
- GRM
- 6.3
CMA / ARV
- ARV (on-the-fly)
- $111,156
- Comps found
- 3
Show comp detail 3 sales within ~0.75 mi
| Address | Dist | Beds/Ba | Sqft | Sold | Price | $/sf | Match |
|---|---|---|---|---|---|---|---|
| 2403 Aliantro Ter | 0.03mi | 3/1.0 | 1,056 (+12%) | 20mo | $125,000 | $118 | 58 |
| 2522 Arctic #RR A Ave | 0.18mi | 3/1.0 | 810 (-14%) | 12mo | $150,000 | $185 | 54 |
| 1812 Bishop Richard Allen Ave Ave | 0.66mi | 3/1.0 | 1,064 (+13%) | 20mo | $99,000 | $93 | 28 |
Match score weights: distance 35% · size 25% · config 20% · recency 20%. Top-matched comps best support the ARV.
Projected returns pro-forma
-3.0% appreciation · 5.52% rent growth · sell at horizon
- IRR
- -4.8%
- Equity multiple
- 0.81×
- Total profit
- $-8,891
- Equity at exit
- $25,348
- IRR
- 8.3%
- Equity multiple
- 1.73×
- Total profit
- $34,763
- Equity at exit
- $14,698
Cash invested: $47,600 (down + closing). Projections, not guarantees.
Landlord ↔ Tenant lean methodology
- Overall (STATE)
- 21 Tenant-Leaning
- State New Jersey
- 21 Tenant-Leaning · D+6
- County
- — inherits STATE
- City
- — inherits STATE
ZIP-level market 08401
- Home prices YoY
- -7.0%
- Rents YoY
- 5.5%
- Active inventory
- 482
- Price-to-rent
- 6.3×
Monthly cashflow live
- Estimated rent
- $2,245 high interval (Pro) →
- Mortgage (P&I)
- −$891
- Tax from tax record
- −$188 /mo · $2,254/yr
- Insurance
- −$71
- Flood insurance flood zone
- −$427 /mo · $5,118/yr
- HOA
- −$0
- Vacancy / Maint / Mgmt
- −$471
- Net cashflow
- $197
Break-even live
UW: 25.0% down · 7.5% · 30yr · 1.5% tax · 5.0% vac · 8.0% maint · 8.0% mgmt
Financing live
Cash to close
- Down payment
- $42,500
- Closing costs
- $5,100
- Reserves months
- —
- Total cash needed
- —
Loan-product check · same deal, 3 products live
Conventional
25% down · 7.5% · 30yr
- Down + closing
- —
- Monthly P&I
- —
- Monthly cashflow
- —
- DSCR
- —
- Eligible?
- —
Personal DTI + credit; lowest rate.
DSCR
20% down · 8.5% · 30yr
- Down + closing
- —
- Monthly P&I
- —
- Monthly cashflow
- —
- DSCR
- —
- Eligible?
- —
No personal income docs; deal must DSCR.
Hard money
10% down · 12.0% · 12mo
- Down + closing
- —
- Monthly P&I
- —
- Monthly cashflow
- —
- DSCR
- —
- Eligible?
- —
Short-term bridge; refi at stabilization.
Rent comps 18 comps
| Address | Beds | Baths | Sqft | Rent | $/sqft | DOM | Units | Dist |
|---|---|---|---|---|---|---|---|---|
| 4 Italy Ter Atlantic City, NJ | 3.0 | 1.0 | 1000 | $2,300 | $2.30 | 21d | 1 | 0.24mi |
| 1724 Atlantic Ave Unit B2 Atlantic City, NJ | 2.0 | 1.0 | 750 | $1,495 | $1.99 | 21d | 1 | 0.54mi |
| 1724 Atlantic Ave Unit A1 Atlantic City, NJ | 3.0 | 1.0 | 950 | $2,300 | $2.42 | 21d | 1 | 0.54mi |
| 1710 Atlantic Ave Apt A Atlantic City, NJ | 2.0 | 1.0 | 600 | $4,500 | $7.50 | 21d | 1 | 0.56mi |
| 38 N Boston Ave Unit B Atlantic City, NJ | 2.0 | 2.0 | 800 | $2,400 | $3.00 | 13d | 1 | 0.65mi |
| 2021 Grant Ave Atlantic City, NJ | 3.0 | 1.0 | 1011 | $2,350 | $2.32 | 21d | 1 | 0.80mi |
| 2015 Grant Ave Atlantic City, NJ | 3.0 | 1.0 | 1056 | $2,325 | $2.20 | 21d | 1 | 0.80mi |
| 3636 Winchester Ave Atlantic City, NJ | 3.0 | 1.0 | 1094 | $1,995 | $1.82 | 21d | 1 | 0.81mi |
| 905 Keener Ave Atlantic City, NJ | 3.0 | 1.0 | 1059 | $1,900 | $1.79 | 21d | 1 | 0.82mi |
| 108 Lincoln Pl Apt A4 Atlantic City, NJ | 2.0 | 1.0 | 800 | $5,000 | $6.25 | 21d | 1 | 0.91mi |
| 3851 Boardwalk Atlantic City, NJ | 2.0 | 1.0–2.0 | 785 | $27,500 | $35.03 | 21d | 5 | 0.92mi |
| 21 S Windsor Ave Unit b1 Atlantic City, NJ | 2.0 | 1.0 | 640 | $1,650 | $2.58 | 13d | 1 | 1.08mi |
| 31 N Virginia Ave Atlantic City, NJ | 3.0 | 1.0 | 725 | $2,230 | $3.08 | 13d | 1 | 1.14mi |
| 101 S Raleigh Ave Atlantic City, NJ | 2.0 | 1.0 | 735 | $18,750 | $25.51 | 13d | 7 | 1.17mi |
| 1510 N Arkansas Ave Atlantic City, NJ | 3.0 | 2.0 | 1008 | $2,750 | $2.73 | 13d | 1 | 1.19mi |
| 1523 N Arkansas Ave Atlantic City, NJ | 3.0 | 2.0 | 984 | $2,500 | $2.54 | 21d | 1 | 1.23mi |
| 848 Pacific Ave Unit 1014254P Atlantic City, NJ | 1.0–2.0 | 2.0–3.0 | 1243 | $2,413 | $1.94 | 13d | 2 | 1.26mi |
| 1914 N Missouri Ave Atlantic City, NJ | 2.0 | 1.0 | 750 | $1,795 | $2.39 | 21d | 1 | 1.38mi |
Listing history 21 events
-
2026-06-19days on market $170,000 Active 135 DOM
-
2026-06-18days on market $170,000 Active 134 DOM
-
2026-06-17days on market $170,000 Active 133 DOM
-
2026-06-16days on market $170,000 Active 132 DOM
-
2026-06-15days on market $170,000 Active 131 DOM
-
2026-06-14days on market $170,000 Active 129 DOM
-
2026-06-13days on market $170,000 Active 128 DOM
-
2026-06-10days on market $170,000 Active 126 DOM
-
2026-06-09days on market $170,000 Active 125 DOM
-
2026-06-08days on market $170,000 Active 124 DOM
-
2026-06-07days on market $170,000 Active 123 DOM
-
2026-06-02days on market $170,000 Active 118 DOM
-
2026-06-01days on market $170,000 Active 117 DOM
-
2026-05-31days on market $170,000 Active 116 DOM
-
2026-05-30days on market $170,000 Active 115 DOM
-
2026-02-04$170,000 Active 626-char remark
Show marketing remark (626 chars)
Turnkey investment opportunity in Atlantic City with a long-term tenant paying $1,300/month ($15,600 annually). This 3-bedroom, 2 full bath home features a highly desirable first-floor bedroom and full bath, ideal for added convenience and rental appeal. Main level also offers a living room and eat-in kitchen, with two additional bedrooms and a second full bath upstairs. Includes front porch, rear patio, and basement storage. Low annual utilities (water $323, sewer $605) create strong cash flow with approximately $12,417 net income. Immediate income-producing property perfect for investors. Interior photos coming soon.
-
2020-10-31historical 554-char remark
Show marketing remark (554 chars)
* * * Investment opportunity * * * Long term tenant in place paying $1050 per month $12,600 per year. Beautiful 3 bedroom, 2 full bath home in Atlantic City. Home features a living room, eat-in kitchen with one full bath & bedroom on the main floor. Upstairs features 2 bedrooms and the second full bath. There is a cute patio area around back and a lovely front porch. You also have basement access for storage. Water: $262.44 a year Sewerage: $588.54 Check out the Video Tour below https://youtu. be/6UppmSqpLok Net income: $9,956.23
-
2020-09-14historical Under Contract - Continue to Show 554-char remark
Show marketing remark (554 chars)
* * * Investment opportunity * * * Long term tenant in place paying $1050 per month $12,600 per year. Beautiful 3 bedroom, 2 full bath home in Atlantic City. Home features a living room, eat-in kitchen with one full bath & bedroom on the main floor. Upstairs features 2 bedrooms and the second full bath. There is a cute patio area around back and a lovely front porch. You also have basement access for storage. Water: $262.44 a year Sewerage: $588.54 Check out the Video Tour below https://youtu. be/6UppmSqpLok Net income: $9,956.23
-
2020-08-10$79,900 Active 554-char remark
Show marketing remark (554 chars)
* * * Investment opportunity * * * Long term tenant in place paying $1050 per month $12,600 per year. Beautiful 3 bedroom, 2 full bath home in Atlantic City. Home features a living room, eat-in kitchen with one full bath & bedroom on the main floor. Upstairs features 2 bedrooms and the second full bath. There is a cute patio area around back and a lovely front porch. You also have basement access for storage. Water: $262.44 a year Sewerage: $588.54 Check out the Video Tour below https://youtu. be/6UppmSqpLok Net income: $9,956.23
-
2006-11-09soldstatus $145,000
-
1993-05-24soldstatus $48,000
ⓘ Source: listings_history table (triggers on properties + properties_extension) + one-shot
backfill from property_details.listing_events for pre-trigger history.
Tax reassessment forecast NJ · Partial reset (capped growth)
- Current annual tax
- $2,254 · $188/mo
- Projected year-2 tax
- $3,244 · $270/mo
- Expected delta
- +$989/yr (+$82/mo · 43.9%)
ⓘ Screening estimate from a state-policy table — verify with the county assessor before closing.
Climate risk First Street
- Flood 6/10 Major FEMA zone AE · 57% chance over 30 yrs
- Wildfire 1/10 Low
- Heat 9/10 Extreme 7 d/yr ≥94°F today · 17 d/yr by 30 yrs out
- Wind 8/10 Severe 80% chance of damaging wind over 30 yrs
- Air quality 3/10 Moderate 2 unhealthy d/yr today · 3 by 30 yrs out
Nearby sold comps map
Loading sold comps map…
Walkable amenities ~0.75 mi
Loading nearby amenities…
Taxation est. · year 1
- Rental income
- $26,941
- − Mortgage interest
- −$9,523
- − Property taxes
- −$2,254
- − Insurance
- −$5,968
- − Repairs & maintenance
- −$2,155
- − Management
- −$2,155
- − Depreciation
- −$4,945
- Taxable loss
- −$60
- Est. tax savings @ 24.0%
- +$14
- After-tax cash flow
- $2,377/yr
For passive investors: Depreciation is non-cash, so a rental often shows a tax loss while cash-flowing — sheltering income. Rental losses are passive: they offset passive income freely, and up to $25,000/yr can offset ordinary (W-2) income if you actively participate and your MAGI is under $100k (phasing out to $0 by $150k); unused losses carry forward. On sale, claimed depreciation is recaptured at up to 25%, and gains may owe capital-gains tax (a 1031 exchange can defer both). Figures are a year-1 estimate at your 24.0% rate — not tax advice; consult a CPA.
Schools (NCES district)
- District
- Atlantic City School District
- NCES district ID
- 3400960
- Math proficiency
- 9% ▼ -12.00%
- Reading proficiency
- 26% ▼ -6.00%
- Median HH income
- $27,842
- Composite
- 13.66/100
- National rank
- #9504
- State rank
- #454 of 472 in NJ
Livability — Atlantic City
- Score
- 55/100
- State rank
- #525
- US rank
- #23095
Category grades
Schools grade is shown separately in the Schools card above.
Census & demographics
- Census place
- Atlantic City, NJ
- County
- Atlantic County · 143,611 people
- City population
- 38,925
- Metro
- Atlantic City-Hammonton, NJ
- Population (ZIP)
- 38,925
- Household income
- $41,126
- Rent vs Own
- Severe rent burden
- 3414.0
Population outlook (Atlantic County) Hauer SSP2
- Today (2025)
- 268,948 people
- By 2030
- 264,497 · -1.7%
- By 2040
- 252,261 · -6.2%
- By 2050
- 237,846 · -11.6%
- By 2075
- 210,650 · -21.7%
- By 2100
- 180,234 · -33.0%
Race, ethnicity, and origin ACS 2023
- Neighborhood character
- Highly diverse neighborhood (Simpson 0.75)
- Race & ethnicity
- Hispanic / Latino 32% Black 32% Asian 16% White 16% Two or more races 11% Native American 2%
- Hispanic origin (detail)
- Mexican 10% Puerto Rican 8% Dominican 8%
- Common ancestry
- Romanian 1% Scotch-Irish 1%
- Foreign-born
- 29% · Canada, Vietnam, Jamaica
- Languages at home
- 52% English-only · Spanish 30% Other Indo-European 8% Vietnamese 3%
Political lean MEDSL · Atlantic
- 2024 margin
- Toss-up / Even · D 47.7% · R 50.7% · Other 1.6%
- 2008→2024 swing
- -18.1pp toward R · 2008: 15.1pp · 2024: -3.0pp
- All cycles
- 2024: R+3.0 2020: D+6.7 2016: D+6.2 2012: D+17.2 2008: D+15.1
Not yet ingested
- Civics
- —
Market trends
- HPI YoY
- ▼ -26.82%
- Current HPI
- 353.7827
- Rent YoY
- ▲ 5.52%
- Metro
- Atlantic City-Hammonton, NJ
- State GDP YoY
- ▲ 2.05%
- F500 in state
- 34
Industry mix (Fortune 500 HQ in NJ)
| Industry | F500 HQs | Revenue |
|---|---|---|
| Consumer Goods | 3 | $31B |
|
||
| Pharmaceuticals | 2 | $153B |
|
||
| Technology | 2 | $21B |
|
||
| Insurance | 2 | $20B |
|
||
| Healthcare | 2 | $19B |
|
||
| Financial Services | 1 | $70B |
|
||
Price history
+254.2% since first listed6 events — show timeline
- 2026-02-04 Listed $170,000 SJSRMLS
- 2020-10-31 Listing Removed — SJSRMLS
- 2020-09-14 Contingent — SJSRMLS
- 2020-08-10 Listed $79,900 SJSRMLS
- 2006-11-09 Sold (Public Records) $145,000 Public Records
- 1993-05-24 Sold (Public Records) $48,000 Public Records
Property tax history
-0.3%/yrLatest (2025): $2,254 · -2.1% YoY. Source: county tax records.
Cash-flow waterfall
monthlySold comps — $/sqft
last 12 mo · ≤1 miLoading sold comps…