1263 Old Kemper Rd · Lake View, SC
Flood risk No data
- FEMA flood zone
- —
- Chance of flooding over 30 yrs
- —
- Est. flood insurance / yr
- —
Fire risk No data
- Est. fire insurance / yr
- —
Heat risk No data
- Hot days now (above threshold)
- —
- Hot days in 30 yrs
- —
Wind risk No data
- Chance of severe wind over 30 yrs
- —
Air-quality risk No data
- Unhealthy air days now
- —
- Unhealthy air days in 30 yrs
- —
Risk factors via First Street. Map © Google.
Why this score? — see what drove the B- grade
The composite is a weighted blend of 9 inputs, each scored 0–100. Each bar is that input's sub-score; the figure is the points it added to the 100-point composite (weight × sub-score).
- Cash flow +25.3/30.0
- Appreciation +9.0/10.0
- DSCR +8.3/10.0
- ARV discount +7.5/15.0
- 1% rule +5.4/10.0
- Livability +3.4/5.0
- Rent growth +2.5/5.0
- Condition / age +2.5/5.0
- Schools +1.6/10.0
$121,600
🖨 Deal sheet 📄 Offer letter ✓ Due diligence
Listing remarks
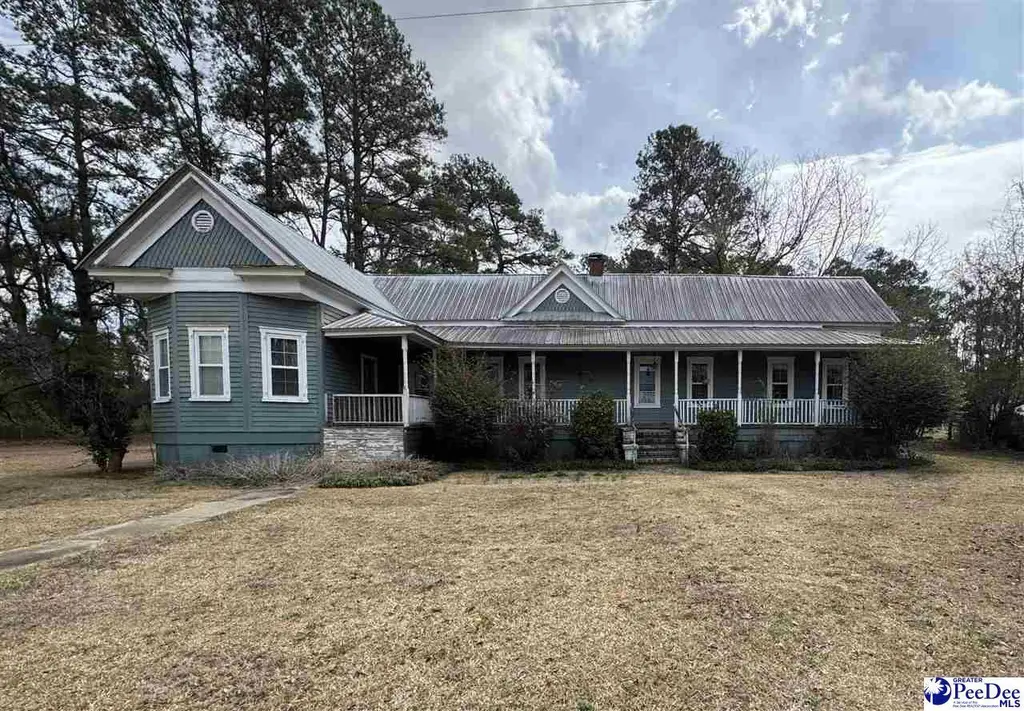
Welcome to this spacious 3-bedroom, 2-bath home full of character and comfort. From the moment you arrive, you’ll be drawn to the large covered front porch—perfect for relaxing mornings, evening conversations, or enjoying the outdoors year-round. Inside, the home offers generous living space ideal for both everyday living and entertaining. With three fireplaces throughout the home, you’ll enjoy warmth, charm, and cozy ambiance in multiple rooms. The property also features a detached shed, providing excellent additional storage or workspace options.
Key facts
- Three fireplaces
- Detached shed
- 1.12 acre lot
Tags
Property features AI
Finance
- Other: Approximately 1.12-acre lot; About 2,403 square feet above grade finished area
Exterior
- Utilities: Public water; Septic sewer
- Home design: Single family residence; Residential property
- Construction: Wood siding
- Exterior features: Front porch; Metal roof
Interior
- Flooring: Carpet; Vinyl
- Bathrooms: 2 full bathrooms
- Heating & cooling: Central heating; Central air conditioning; Ceiling fans
- Interior features: Two fireplaces; Crawl space
Neighborhood map
What this means for you Summary
Snapshot
- This is a 3-bed/2.0-bath other listed at $122k.
Deal economics
- At list price, monthly cash flow is $276 ($3k/yr) — positive.
- The deal already cash-flows at list — no discount required.
- Meets the 1% rule at list price ($1k rent vs $122k).
- Recommended offer: $114k (6.0% below list) — sets the bar for market timing.
Location & tenants
- Location reads 67/100 on livability (#92 in SC) — a middle-class / working-renter tenant base. Strengths: cost of living A+, health & safety A+, crime A-; Watch: amenities F, commute F, employment F.
- Dillon 04 (town): math 14% / reading 27% proficiency, ranked #72 of 80 in SC (top 90%) — low school quality limits family demand, transient renter base, plan for 1-2y turnover; 83% free/reduced lunch — lower-income household profile, screen leases tightly.
- Zoned schools: Lake View Elementary (math 27% / reading 32%, grade F, #399 of 597 statewide, top 69%, 365 students, 100% FRL); Lake View High (math 12% / reading 47%, grade F, #192 of 196 statewide, top 98%, 523 students, 100% FRL) — zoned schools average 100% FRL vs 83% district-wide (17 pts higher); higher-poverty schools than district average — tighter screening recommended.
- Market conditions: 11 active listings in the ZIP; 41 units permitted in Dillon County in 2024 (0 in 5+ unit buildings).
Forward outlook
- In year one you build about $11k of equity ($841 loan paydown + $10k appreciation (8.0% local appreciation)).
- Dillon County population projected at -25% by 2050 — secular population decline; favor cash flow + early exit over multi-decade hold.
- At projected returns (8.0% appreciation + 3.0% rent growth), your $34k cash investment doubles in ~3 years — after that, you're playing with house money.
- By year 4, paydown + projected appreciation supports a ~$37k cash-out refi (75% LTV) — recoverable capital for the next deal without selling this one.
Negotiation context
- It's been on market 77 days — a 6% lower offer ($114k) is reasonable based on typical stale-listing flexibility.
- Current owner paid $63k; list at $122k implies a 93% gain — meaningful room to come down on a strong offer.
Risks & watch-outs
- Watch-outs: built in 1904 — expect roof / HVAC / electrical / plumbing capex.
Questions for the listing agent
- It's been on market 77 days. Have you received any prior offers? Is the seller open to a 6% concession, seller financing, or rate buy-down credit?
- Built in 1904 — when were the roof, HVAC, electrical panel, plumbing, and water heater last replaced?
- Why hasn't it sold? Are there any deal-killer items the seller is aware of (foundation, flood, title, zoning, code violations)?
- Is there a deadline driving the sale (1031 exchange, divorce, estate, relocation)? That informs how much negotiation room exists.
- Schools are F-rated, which usually means shorter tenancies and higher turnover. Who's the typical renter profile here, and what's been the actual vacancy rate?
- What's the average days-on-market for RENTAL listings here right now (not sales)? A rising rental-DOM trend means longer vacancies and softer asking-rent achievability than the comps imply.
- What's the recent tenant-quality profile in this submarket — average credit score on applications, eviction rate, late-payment / NSF rate, and stable-employment percentage? A property-management company in the area should have these aggregated.
- How much new for-sale + rental construction is in the pipeline within 1–3 miles? Heavy new supply typically softens prices + rents 12–24 months out; constrained supply supports both.
Investment metrics
- 1% rule
- 1.04% ✓
- Cap rate
- 9.02%
- Cash-on-cash
- 9.74%
- DSCR
- 1.43
- GRM
- 8.0
CMA / ARV
No comps found within radius.
Projected returns pro-forma
8.01% appreciation · 3.0% rent growth · sell at horizon
- IRR
- 27.5%
- Equity multiple
- 2.99×
- Total profit
- $67,727
- Equity at exit
- $92,477
- IRR
- 24.7%
- Equity multiple
- 6.38×
- Total profit
- $183,313
- Equity at exit
- $183,655
Cash invested: $34,048 (down + closing). Projections, not guarantees.
Landlord ↔ Tenant lean methodology
- Overall (STATE)
- 90 Strongly Landlord-Friendly
- State South Carolina
- 90 Strongly Landlord-Friendly · R+6
- County
- — inherits STATE
- City
- — inherits STATE
ZIP-level market 29563
- Home prices YoY
- 7.2%
- Active inventory
- 11
- Price-to-rent
- 8.0×
Monthly cashflow live
- Estimated rent
- $1,260 medium interval (Pro) →
- Mortgage (P&I)
- −$638
- Tax from tax record
- −$31 /mo · $368/yr
- Insurance
- −$51
- HOA
- −$0
- Vacancy / Maint / Mgmt
- −$265
- Net cashflow
- $276
Break-even live
UW: 25.0% down · 7.5% · 30yr · 1.5% tax · 5.0% vac · 8.0% maint · 8.0% mgmt
Financing live
Cash to close
- Down payment
- $30,400
- Closing costs
- $3,648
- Reserves months
- —
- Total cash needed
- —
Loan-product check · same deal, 3 products live
Conventional
25% down · 7.5% · 30yr
- Down + closing
- —
- Monthly P&I
- —
- Monthly cashflow
- —
- DSCR
- —
- Eligible?
- —
Personal DTI + credit; lowest rate.
DSCR
20% down · 8.5% · 30yr
- Down + closing
- —
- Monthly P&I
- —
- Monthly cashflow
- —
- DSCR
- —
- Eligible?
- —
No personal income docs; deal must DSCR.
Hard money
10% down · 12.0% · 12mo
- Down + closing
- —
- Monthly P&I
- —
- Monthly cashflow
- —
- DSCR
- —
- Eligible?
- —
Short-term bridge; refi at stabilization.
Listing history 17 events
-
2026-06-18days on market $121,600 Active 77 DOM
-
2026-06-17days on market $121,600 Active 76 DOM
-
2026-06-16days on market $121,600 Active 75 DOM
-
2026-06-15days on market $121,600 Active 74 DOM
-
2026-06-13days on market $121,600 Active 72 DOM
-
2026-06-12days on market $121,600 Active 71 DOM
-
2026-06-09days on market $121,600 Active 68 DOM
-
2026-06-08days on market $121,600 Active 67 DOM
-
2026-06-08days on market $121,600 Active 66 DOM
-
2026-06-07days on market $121,600 Active 65 DOM
-
2026-06-04days on market $121,600 Active 62 DOM
-
2026-06-02days on market $121,600 Active 61 DOM
-
2026-06-01days on market $121,600 Active 60 DOM
-
2026-05-31days on market $121,600 Active 59 DOM
-
2026-05-04price $121,600
-
2026-04-02$130,000 Active
-
2004-06-29soldstatus $63,000
ⓘ Source: listings_history table (triggers on properties + properties_extension) + one-shot
backfill from property_details.listing_events for pre-trigger history.
Tax reassessment forecast SC · Resets to sale price
- Current annual tax
- $368 · $31/mo
- Projected year-2 tax
- $693 · $58/mo
- Expected delta
- +$325/yr (+$27/mo · 88.3%)
ⓘ Screening estimate from a state-policy table — verify with the county assessor before closing.
Nearby sold comps map
Loading sold comps map…
Walkable amenities ~0.75 mi
Loading nearby amenities…
Taxation est. · year 1
- Rental income
- $15,120
- − Mortgage interest
- −$6,811
- − Property taxes
- −$368
- − Insurance
- −$608
- − Repairs & maintenance
- −$1,210
- − Management
- −$1,210
- − Depreciation
- −$3,537
- Taxable income
- $1,376
- Est. tax owed @ 24.0%
- −$330
- After-tax cash flow
- $2,986/yr
For passive investors: Depreciation is non-cash, so a rental often shows a tax loss while cash-flowing — sheltering income. Rental losses are passive: they offset passive income freely, and up to $25,000/yr can offset ordinary (W-2) income if you actively participate and your MAGI is under $100k (phasing out to $0 by $150k); unused losses carry forward. On sale, claimed depreciation is recaptured at up to 25%, and gains may owe capital-gains tax (a 1031 exchange can defer both). Figures are a year-1 estimate at your 24.0% rate — not tax advice; consult a CPA.
Schools (NCES district)
- District
- Dillon 04
- NCES district ID
- 4501920
- Math proficiency
- 14% ▼ -15.00%
- Reading proficiency
- 27% ▼ -9.00%
- Median HH income
- $27,820
- Composite
- 16.16/100
- National rank
- #9230
- State rank
- #72 of 80 in SC
Livability — Lake View
- Score
- 67/100
- State rank
- #92
- US rank
- #10400
Category grades
Schools grade is shown separately in the Schools card above.
Census & demographics
- Population (ZIP)
- 2,016
Population outlook (Dillon County) Hauer SSP2
- Today (2025)
- 29,087 people
- By 2030
- 27,713 · -4.7%
- By 2040
- 24,772 · -14.8%
- By 2050
- 21,836 · -24.9%
- By 2075
- 15,165 · -47.9%
- By 2100
- 9,849 · -66.1%
Race, ethnicity, and origin ACS 2023
- Neighborhood character
- Majority White (57%)
- Race & ethnicity
- White 57% Black 37% Hispanic / Latino 5% Two or more races 3%
- Common ancestry
- Slovak 1%
- Foreign-born
- 1% · Canada
- Languages at home
- 99% English-only · Spanish 1%
Political lean MEDSL · Dillon
- 2024 margin
- R (+10.8) · D 44.2% · R 55.0%
- 2008→2024 swing
- -22.3pp toward R · 2008: 11.4pp · 2024: -10.8pp
- All cycles
- 2024: R+10.8 2020: R+1.1 2016: D+1.7 2012: D+16.3 2008: D+11.4
Not yet ingested
- Civics
- —
Market trends
- HPI YoY
- ▲ 8.01%
- Current HPI
- 118.9672
- Rent YoY
- —
- Metro
- —
- State GDP YoY
- ▲ 4.51%
- F500 in state
- 2
Industry mix (Fortune 500 HQ in SC)
| Industry | F500 HQs | Revenue |
|---|---|---|
| Packaging | 1 | $7B |
|
||
Price history
+93.0% since first listed3 events — show timeline
- 2026-05-04 Price Changed $121,600 RAGPD
- 2026-04-02 Listed $130,000 RAGPD
- 2004-06-29 Sold (Public Records) $63,000 Public Records
Property tax history
+1.8%/yrLatest (2025): $368 · +6.3% YoY. Source: county tax records.
Cash-flow waterfall
monthlySold comps — $/sqft
last 12 mo · ≤1 miLoading sold comps…