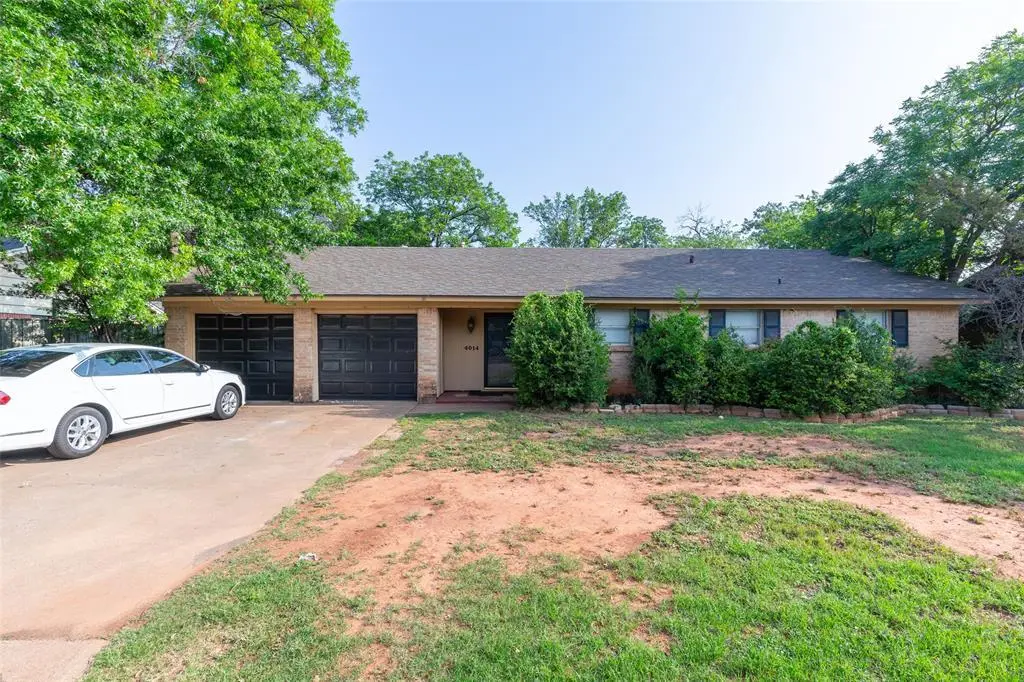
4014 Concord Dr · Abilene, TX
Flood risk 7/10 · Major
- FEMA flood zone
- X (unshaded)
- Chance of flooding over 30 yrs
- 0.98%
- Est. flood insurance / yr
- $507 – $1,088
Fire risk 7/10 · Major
- Est. fire insurance / yr
- $1,222 – $2,270
Heat risk 7/10 · Major
- Hot days now (above 104°F)
- 7 days/yr
- Hot days in 30 yrs
- 24 days/yr
Wind risk 4/10 · Minor
- Chance of severe wind over 30 yrs
- 11.0%
Air-quality risk 1/10 · Minimal
- Unhealthy air days now
- 0 days/yr
- Unhealthy air days in 30 yrs
- 0 days/yr
Risk factors via First Street. Map © Google.
Why this score? — see what drove the C grade
The composite is a weighted blend of 9 inputs, each scored 0–100. Each bar is that input's sub-score; the figure is the points it added to the 100-point composite (weight × sub-score).
- Cash flow +25.3/30.0
- DSCR +8.3/10.0
- 1% rule +6.9/10.0
- Rent growth +5.0/5.0
- Livability +3.8/5.0
- Schools +2.8/10.0
- Condition / age +2.5/5.0
- ARV discount +1.2/15.0
- Appreciation +0.0/10.0
$215,000
🖨 Deal sheet 📄 Offer letter ✓ Due diligence
Listing remarks MLS
Come see what this home has to offer! Great investment property or first time home buyer! This home offers 3 bedrooms, 2 bathrooms, large living area with cozy fireplace, bright cheerful kitchen, office, and fenced backyard. Bring your decorating ideas and tools and see this one today!
Key facts
- 0.24 acre lot
- 2 garage spots
- Built 1963
Property features AI
Finance
- Other: Subject to lease possession; Restrictions: deed and easement(s)
- HOA & community: No association
Exterior
- Parking: Driveway; Garage with 2-car capacity; 2-car garage with double doors facing front; Carport spaces: 0; Covered spaces: 0
- Security: Smoke detector(s)
- Utilities: City water; City sewer; Alley access; Curbs
- Home design: Single family residence; One story; Residential property; Not attached to another property; Year built 1963; Preowned
- Construction: Brick and siding exterior; Composition roof; Slab foundation
- Exterior features: Patio; Wood fencing; Shed(s); Few trees; Easement for utilities
Interior
- Kitchen: Dishwasher; Electric cooktop; Electric oven; Vented exhaust fan; Eat-in kitchen layout
- Bedrooms: Primary bedroom on main level (15 x 11); Bedroom on main level (10 x 11); Bedroom on main level (10 x 10)
- Flooring: Carpet; Laminate
- Bathrooms: 2 full bathrooms
- Heating & cooling: Central heating (natural gas); Fireplace heating; Central air; Ceiling fans
- Interior features: Open floorplan; Eat-in kitchen; Cable TV available; High-speed internet available; Window coverings; Built-in cabinets in living area; Fireplace (wood burning)
- Laundry & utility: Full-size washer/dryer area
Neighborhood map
What this means for you Summary
Snapshot
- This is a 3-bed/2.0-bath single-family listed at $215k.
Deal economics
- At list price, monthly cash flow is $420 ($5k/yr) — positive.
- The deal already cash-flows at list — no discount required.
- Meets the 1% rule at list price ($3k rent vs $215k).
- Recommended offer: $209k (3.0% below list) — sets the bar for market timing.
- Cap rate 9.0% vs local median 6.7% in Abilene — top-decile yield for the area; either an underpriced asset or a hidden risk that comps aren't pricing in. Stress-test before assuming the spread holds.
Location & tenants
- Location reads 75/100 on livability (#142 in TX, #4,037 nationally) — a middle-class / working-renter tenant base. Strengths: cost of living A+, housing A+, health & safety A+; Watch: schools D+, crime D, commute F.
- Abilene ISD (urban): math 32% / reading 34% proficiency, ranked #575 of 826 in TX (top 70%) — families likely to look elsewhere, expect single-tenant / working-renter base with shorter leases.
- Market conditions: Rents rising fast (+40.2%/yr); 86 active listings in the ZIP; 7 comparable units currently listed for rent nearby; rentals at typical pace (median 21d on market — plan ~3-4 weeks tenant-placement turnaround); 508 units permitted in Taylor County in 2024 (0 in 5+ unit buildings).
- At $2,567/mo this rent would consume 58% of the median local household income ($54k/yr) (locally 662% of renters already pay >50% of income on rent) — very limited rent-growth headroom before tenants either downsize or default.
Forward outlook
- Local home prices are declining (-3.0%/yr); year-one equity from $1k of loan paydown is wiped out by about $6k of value loss. Plan a longer hold.
- Taylor County population projected at +16% by 2050 — long-run rental-demand tailwind backs the buy-and-hold thesis.
- At projected returns (-3.0% appreciation + 8.0% rent growth), your $60k cash investment doubles in ~8 years — after that, you're playing with house money.
Negotiation context
- It's been on market 50 days — a 3% lower offer ($209k) is reasonable based on typical stale-listing flexibility.
- 2 sale attempts since 9y ago with the ask held roughly flat each time — persistent listings suggest the price (not the market) is what's stuck; bring a comps-based counter.
Risks & watch-outs
- Watch-outs: flood insurance adds $66/mo.
- Climate carrying-cost: major flood risk; major wildfire risk; extreme-heat days projected 7→24/yr by 2055 (HVAC capex compounding) — expect insurance premiums to compound above CPI over the hold.
Questions for the listing agent
- It's been on market 50 days. Have you received any prior offers? Is the seller open to a 3% concession, seller financing, or rate buy-down credit?
- Built in 1963 — when were the roof, HVAC, electrical panel, plumbing, and water heater last replaced?
- What's the actual annual flood-insurance premium (NFIP or private), and is the property in a SFHA with mandatory coverage?
- Is there a deadline driving the sale (1031 exchange, divorce, estate, relocation)? That informs how much negotiation room exists.
- Schools are D-rated, which usually means shorter tenancies and higher turnover. Who's the typical renter profile here, and what's been the actual vacancy rate?
- Crime grade is D in this area — have there been break-ins, vandalism, or insurance claims at this property in the last 3 years? What carrier currently insures it and at what premium?
- What's the average days-on-market for RENTAL listings here right now (not sales)? A rising rental-DOM trend means longer vacancies and softer asking-rent achievability than the comps imply.
- What's the recent tenant-quality profile in this submarket — average credit score on applications, eviction rate, late-payment / NSF rate, and stable-employment percentage? A property-management company in the area should have these aggregated.
- How much new for-sale + rental construction is in the pipeline within 1–3 miles? Heavy new supply typically softens prices + rents 12–24 months out; constrained supply supports both.
Investment metrics
- 1% rule
- 1.19% ✓
- Cap rate
- 9.01%
- Cash-on-cash
- 9.69%
- DSCR
- 1.43
- GRM
- 7.0
CMA / ARV
- ARV (median comp)
- $188,572
- List price
- $215,000
- Delta
- 14.02%
- Verdict
- OVERPRICED
- Comps
- 20 within 1.0 mi
Show comp detail 12 sales within ~0.75 mi
| Address | Dist | Beds/Ba | Sqft | Sold | Price | $/sf | Match |
|---|---|---|---|---|---|---|---|
| 3714 Concord Dr | 0.30mi | 3/2.0 | 1,679 (-0%) | 1mo | $165,000 | $98 | 85 |
| 1626 Glendale Dr | 0.50mi | 3/2.0 | 1,698 (+1%) | 5mo | $204,900 | $121 | 71 |
| 1737 Marsalis Dr | 0.54mi | 4/2.0 (+1) | 1,642 (-2%) | 1mo | $245,000 | $149 | 65 |
| 1426 Minter Ln | 0.52mi | 3/2.0 | 1,784 (+6%) | 1mo | $229,900 | $129 | 65 |
| 1918 Rosewood Dr | 0.60mi | 4/2.0 (+1) | 1,694 (+1%) | 3mo | $270,000 | $159 | 63 |
| 755 Crestwood Dr | 0.59mi | 3/2.0 | 1,586 (-6%) | 2mo | $259,900 | $164 | 61 |
| 1918 Marsalis Dr | 0.64mi | 3/2.0 | 1,797 (+7%) | 2mo | $240,000 | $134 | 58 |
| 1702 Rosewood Dr | 0.46mi | 3/2.0 | 1,468 (-13%) | 2mo | $201,000 | $137 | 55 |
| 1463 Beechwood Ln | 0.65mi | 4/1.5 (+1) | 1,624 (-3%) | 5mo | $198,500 | $122 | 53 |
| 858 N San Jose Dr | 0.55mi | 4/1.0 (+1) | 1,508 (-10%) | 4mo | $114,900 | $76 | 45 |
| 80 Harvard Pl | 0.73mi | 4/2.0 (+1) | 1,901 (+13%) | 3mo | $259,900 | $137 | 37 |
| 1301 Glenhaven Dr | 0.73mi | 4/1.5 (+1) | 1,896 (+13%) | 4mo | $187,500 | $99 | 35 |
Match score weights: distance 35% · size 25% · config 20% · recency 20%. Top-matched comps best support the ARV.
Projected returns pro-forma
-3.0% appreciation · 8.0% rent growth · sell at horizon
- IRR
- 2.3%
- Equity multiple
- 1.09×
- Total profit
- $5,569
- Equity at exit
- $32,057
- IRR
- 16.5%
- Equity multiple
- 2.69×
- Total profit
- $101,467
- Equity at exit
- $18,589
Cash invested: $60,200 (down + closing). Projections, not guarantees.
Landlord ↔ Tenant lean methodology
- Overall (STATE)
- 87 Strongly Landlord-Friendly
- State Texas
- 87 Strongly Landlord-Friendly · R+5
- County
- — inherits STATE
- City
- — inherits STATE
ZIP-level market 79603
- Home prices YoY
- -32.5%
- Rents YoY
- 40.2%
- Active inventory
- 86
- Price-to-rent
- 7.0×
Monthly cashflow live
- Estimated rent
- $2,567 high interval (Pro) →
- Mortgage (P&I)
- −$1,127
- Tax from tax record
- −$324 /mo · $3,892/yr
- Insurance
- −$90
- Flood insurance flood zone
- −$66 /mo · $798/yr
- HOA
- −$0
- Vacancy / Maint / Mgmt
- −$539
- Net cashflow
- $420
Break-even live
UW: 25.0% down · 7.5% · 30yr · 1.5% tax · 5.0% vac · 8.0% maint · 8.0% mgmt
Financing live
Cash to close
- Down payment
- $53,750
- Closing costs
- $6,450
- Reserves months
- —
- Total cash needed
- —
Loan-product check · same deal, 3 products live
Conventional
25% down · 7.5% · 30yr
- Down + closing
- —
- Monthly P&I
- —
- Monthly cashflow
- —
- DSCR
- —
- Eligible?
- —
Personal DTI + credit; lowest rate.
DSCR
20% down · 8.5% · 30yr
- Down + closing
- —
- Monthly P&I
- —
- Monthly cashflow
- —
- DSCR
- —
- Eligible?
- —
No personal income docs; deal must DSCR.
Hard money
10% down · 12.0% · 12mo
- Down + closing
- —
- Monthly P&I
- —
- Monthly cashflow
- —
- DSCR
- —
- Eligible?
- —
Short-term bridge; refi at stabilization.
Rent comps 7 comps
| Address | Beds | Baths | Sqft | Rent | $/sqft | DOM | Units | Dist |
|---|---|---|---|---|---|---|---|---|
| 4073 Concord Dr Abilene, TX | 3.0 | 2.0 | 2145 | $2,800 | $1.31 | 43d | 1 | 0.11mi |
| 1470 Beechwood Ln Abilene, TX | 3.0 | 2.0 | 1799 | $4,500 | $2.50 | 43d | 1 | 0.61mi |
| 1685 N Willis St Abilene, TX | 3.0 | 2.0 | 1349 | $1,800 | $1.33 | 21d | 1 | 0.77mi |
| 5441 N 10th St Abilene, TX | 3.0 | 2.0 | 1270 | $2,500 | $1.97 | 13d | 1 | 1.01mi |
| 2498 Yorktown Dr Abilene, TX | 3.0 | 1.5 | 1104 | $1,795 | $1.63 | 13d | 1 | 1.07mi |
| 3296 Sandefer St Abilene, TX | 4.0 | 1.0 | 1360 | $1,950 | $1.43 | 13d | 1 | 1.09mi |
| 1481 Burger St Abilene, TX | 3.0 | 2.0 | 1330 | $2,400 | $1.80 | 21d | 1 | 1.17mi |
Listing history 21 events
-
2026-06-19days on market $215,000 Active 50 DOM
-
2026-06-18days on market $215,000 Active 49 DOM
-
2026-06-17days on market $215,000 Active 48 DOM
-
2026-06-16days on market $215,000 Active 47 DOM
-
2026-06-15days on market $215,000 Active 46 DOM
-
2026-06-14days on market $215,000 Active 44 DOM
-
2026-06-13days on market $215,000 Active 43 DOM
-
2026-06-10days on market $215,000 Active 41 DOM
-
2026-06-09days on market $215,000 Active 40 DOM
-
2026-06-08days on market $215,000 Active 39 DOM
-
2026-06-07days on market $215,000 Active 38 DOM
-
2026-06-03days on market $215,000 Active 34 DOM
-
2026-06-02days on market $215,000 Active 33 DOM
-
2026-06-01days on market $215,000 Active 32 DOM
-
2026-05-31days on market $215,000 Active 31 DOM
-
2026-05-30days on market $215,000 Active 30 DOM
-
2026-04-10$215,000 Active 149-char remark
-
2017-10-13soldstatus Sold 287-char remark
Show marketing remark (287 chars)
Come see what this home has to offer! Great investment property or first time home buyer! This home offers 3 bedrooms, 2 bathrooms, large living area with cozy fireplace, bright cheerful kitchen, office, and fenced backyard. Bring your decorating ideas and tools and see this one today!
-
2017-09-21status Pending 287-char remark
Show marketing remark (287 chars)
Come see what this home has to offer! Great investment property or first time home buyer! This home offers 3 bedrooms, 2 bathrooms, large living area with cozy fireplace, bright cheerful kitchen, office, and fenced backyard. Bring your decorating ideas and tools and see this one today!
-
2017-09-14$91,000 Active 287-char remark
Show marketing remark (287 chars)
Come see what this home has to offer! Great investment property or first time home buyer! This home offers 3 bedrooms, 2 bathrooms, large living area with cozy fireplace, bright cheerful kitchen, office, and fenced backyard. Bring your decorating ideas and tools and see this one today!
-
2017-08-16soldstatus
ⓘ Source: listings_history table (triggers on properties + properties_extension) + one-shot
backfill from property_details.listing_events for pre-trigger history.
Tax reassessment forecast TX · Resets to sale price
- Current annual tax
- $3,892 · $324/mo
- Projected year-2 tax
- $3,934 · $328/mo
- Expected delta
- +$42/yr (+$4/mo · 1.1%)
ⓘ Screening estimate from a state-policy table — verify with the county assessor before closing.
Climate risk First Street
- Flood 7/10 Severe FEMA zone X (unshaded) · 98% chance over 30 yrs
- Wildfire 7/10 Severe
- Heat 7/10 Severe 7 d/yr ≥104°F today · 24 d/yr by 30 yrs out
- Wind 4/10 Moderate 11% chance of damaging wind over 30 yrs
- Air quality 1/10 Low 0 unhealthy d/yr today · 0 by 30 yrs out
Nearby sold comps map
Loading sold comps map…
Walkable amenities ~0.75 mi
Loading nearby amenities…
Taxation est. · year 1
- Rental income
- $30,799
- − Mortgage interest
- −$12,043
- − Property taxes
- −$3,892
- − Insurance
- −$1,872
- − Repairs & maintenance
- −$2,464
- − Management
- −$2,464
- − Depreciation
- −$6,255
- Taxable income
- $1,808
- Est. tax owed @ 24.0%
- −$434
- After-tax cash flow
- $4,602/yr
For passive investors: Depreciation is non-cash, so a rental often shows a tax loss while cash-flowing — sheltering income. Rental losses are passive: they offset passive income freely, and up to $25,000/yr can offset ordinary (W-2) income if you actively participate and your MAGI is under $100k (phasing out to $0 by $150k); unused losses carry forward. On sale, claimed depreciation is recaptured at up to 25%, and gains may owe capital-gains tax (a 1031 exchange can defer both). Figures are a year-1 estimate at your 24.0% rate — not tax advice; consult a CPA.
Schools (NCES district)
- District
- Abilene ISD
- NCES district ID
- 4807440
- Math proficiency
- 32% ▼ -11.00%
- Reading proficiency
- 34% ▼ -5.00%
- Median HH income
- $39,782
- Composite
- 27.71/100
- National rank
- #6909
- State rank
- #575 of 826 in TX
Livability — Abilene
- Score
- 75/100
- State rank
- #142
- US rank
- #4037
Category grades
Schools grade is shown separately in the Schools card above.
Census & demographics
- Census place
- Abilene, TX
- County
- Taylor County · 136,672 people
- City population
- 136,672
- Metro
- Abilene, TX
- Population (ZIP)
- 23,548
- Household income
- $53,513
- Rent vs Own
- Severe rent burden
- 662.0
Population outlook (Taylor County) Hauer SSP2
- Today (2025)
- 145,270 people
- By 2030
- 150,050 · +3.3%
- By 2040
- 159,417 · +9.7%
- By 2050
- 168,883 · +16.3%
- By 2075
- 194,436 · +33.8%
- By 2100
- 203,163 · +39.9%
Race, ethnicity, and origin ACS 2023
- Neighborhood character
- Diverse neighborhood (Simpson 0.60)
- Race & ethnicity
- Hispanic / Latino 48% White 40% Two or more races 24% Black 8%
- Hispanic origin (detail)
- Mexican 44%
- Common ancestry
- Italian 2% Slovak 2% Portuguese 1%
- Foreign-born
- 9% · Canada
- Languages at home
- 73% English-only · Spanish 25%
Political lean MEDSL · Taylor
- 2024 margin
- Solid R (+49.8) · D 24.6% · R 74.4% · Other 1.0%
- 2008→2024 swing
- -4.2pp toward R · 2008: -45.6pp · 2024: -49.8pp
- All cycles
- 2024: R+49.8 2020: R+45.3 2016: R+51.1 2012: R+53.6 2008: R+45.6
Not yet ingested
- Civics
- —
Market trends
- HPI YoY
- ▼ -88.84%
- Current HPI
- 184.8875
- Rent YoY
- ▲ 40.19%
- Metro
- Abilene, TX
- State GDP YoY
- ▲ 3.95%
- F500 in state
- 110
Industry mix (Fortune 500 HQ in TX)
| Industry | F500 HQs | Revenue |
|---|---|---|
| Energy | 16 | $1,198B |
|
||
| Technology | 5 | $198B |
|
||
| Engineering / Construction | 4 | $72B |
|
||
| Energy Services | 3 | $60B |
|
||
| Utilities | 3 | $41B |
|
||
| Healthcare | 2 | $330B |
|
||
Price history
+136.3% since first listed5 events — show timeline
- 2026-04-10 Listed $215,000 NTREIS
- 2017-10-13 Sold (MLS) — NTREIS
- 2017-09-21 Pending — NTREIS
- 2017-09-14 Listed $91,000 NTREIS
- 2017-08-16 Sold (Public Records) — Public Records
Property tax history
+5.5%/yrLatest (2025): $3,892 · +13.0% YoY. Source: county tax records.
Cash-flow waterfall
monthlySold comps — $/sqft
last 12 mo · ≤1 miLoading sold comps…