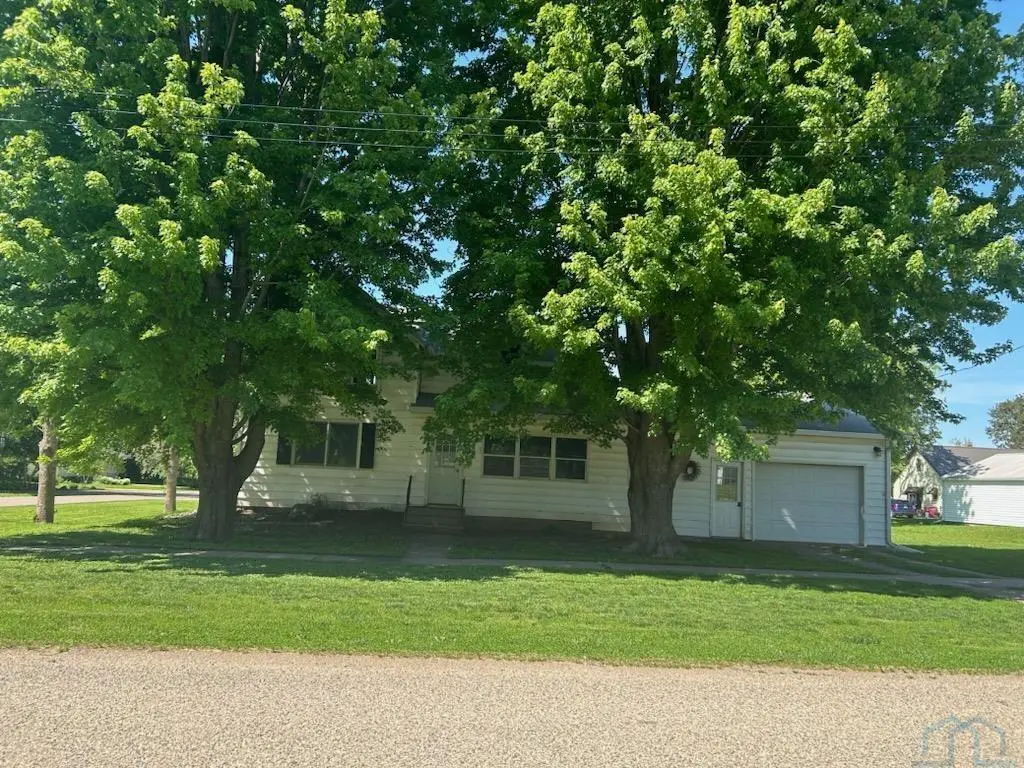
301 Harriman Ave · Archer, IA
Flood risk 1/10 · Minimal
- FEMA flood zone
- X (unshaded)
- Chance of flooding over 30 yrs
- 0.0%
- Est. flood insurance / yr
- $473 – $860
Fire risk 1/10 · Minimal
- Est. fire insurance / yr
- $902 – $1,676
Heat risk 3/10 · Minor
- Hot days now (above 101°F)
- 7 days/yr
- Hot days in 30 yrs
- 15 days/yr
Wind risk 2/10 · Minimal
- Chance of severe wind over 30 yrs
- —
Air-quality risk 1/10 · Minimal
- Unhealthy air days now
- 0 days/yr
- Unhealthy air days in 30 yrs
- 0 days/yr
Risk factors via First Street. Map © Google.
Why this score? — see what drove the C grade
The composite is a weighted blend of 9 inputs, each scored 0–100. Each bar is that input's sub-score; the figure is the points it added to the 100-point composite (weight × sub-score).
- Cash flow +13.9/30.0
- ARV discount +13.4/15.0
- Appreciation +8.9/10.0
- Schools +6.4/10.0
- DSCR +4.2/10.0
- Livability +3.1/5.0
- 1% rule +2.6/10.0
- Rent growth +2.5/5.0
- Condition / age +2.5/5.0
$149,500
🖨 Deal sheet (PDF) 📄 Offer letter ✓ Due diligence
Listing remarks
A pleasant one & a half story home nestled in the community of Archer where you can live quietly and get to know your neighbors. Three bedrooms and one bath and the necessary living space, There is an attached single garage and a double detached with a metal roof plus two lawn buildings and some fencing in the backyard. Reasonable price!
Key facts
- 0.34 acre lot
- Garage
- Built 1900
Property features AI
Exterior
- Parking: Attached garage; Detached garage; Concrete driveway
- Utilities: Public sewer
- Home design: Single-family residential property
- Construction: Vinyl siding
- Exterior features: Shingle roof
Interior
- Bathrooms: 1 full bathroom
- Interior features: Central air conditioning; Forced air electric heating
- Laundry & utility: Laundry on the main level
Neighborhood map
What this means for you Summary
Snapshot
- This is a 3-bed/1.0-bath single-family listed at $150k.
Deal economics
- At list price, monthly cash flow is $17 ($209/yr) — positive.
- The deal already cash-flows at list — no discount required.
- To meet the 1% rule (rent ≥ 1% of price), the offer needs to be $113k (24.1% below list).
- Recommended offer: $113k (24.1% below list) — sets the bar for 1% rule.
Location & tenants
- Location reads 61/100 on livability (#792 in IA) — a middle-class / working-renter tenant base. Strengths: cost of living A+, housing B; Watch: employment D+, health & safety D, amenities F.
- Sheldon Community School District (town): math 74% / reading 78% proficiency, ranked #63 of 289 in IA (top 22%) — strong family-tenant draw, lease renewals of 3-5y typical.
- Zoned schools: Sheldon Middle School (math 70% / reading 78%, grade A, #83 of 246 statewide, top 34%, 320 students, 47% FRL); Sheldon High School (math 73% / reading 81%, grade A-, #60 of 336 statewide, top 21%, 342 students, 39% FRL).
- Market conditions: 4 active listings in the ZIP; 13 units permitted in O'Brien County in 2024 (0 in 5+ unit buildings).
Forward outlook
- In year one you build about $13k of equity ($1k loan paydown + $12k appreciation (7.7% local appreciation)).
- O'Brien County population projected at -11% by 2050 — secular population decline; favor cash flow + early exit over multi-decade hold.
- At projected returns (7.7% appreciation + 3.0% rent growth), your $42k cash investment doubles in ~3 years — after that, you're playing with house money.
- By year 3, paydown + projected appreciation supports a ~$31k cash-out refi (75% LTV) — recoverable capital for the next deal without selling this one.
Negotiation context
- It's been on market 17 days — a 2% lower offer ($147k) is reasonable based on typical stale-listing flexibility.
Risks & watch-outs
- Watch-outs: built in 1900 — expect roof / HVAC / electrical / plumbing capex.
Questions for the listing agent
- Built in 1900 — when were the roof, HVAC, electrical panel, plumbing, and water heater last replaced?
- Is there a deadline driving the sale (1031 exchange, divorce, estate, relocation)? That informs how much negotiation room exists.
- Schools are D-rated, which usually means shorter tenancies and higher turnover. Who's the typical renter profile here, and what's been the actual vacancy rate?
- What's the average days-on-market for RENTAL listings here right now (not sales)? A rising rental-DOM trend means longer vacancies and softer asking-rent achievability than the comps imply.
- What's the recent tenant-quality profile in this submarket — average credit score on applications, eviction rate, late-payment / NSF rate, and stable-employment percentage? A property-management company in the area should have these aggregated.
- How much new for-sale + rental construction is in the pipeline within 1–3 miles? Heavy new supply typically softens prices + rents 12–24 months out; constrained supply supports both.
Investment metrics
- 1% rule
- 0.76% ✗
- Cap rate
- 6.43%
- Cash-on-cash
- 0.50%
- DSCR
- 1.02
- GRM
- 11.0
CMA / ARV
- ARV (on-the-fly)
- $172,220
- Comps found
- 2
Show comp detail 2 sales within ~0.75 mi
| Address | Dist | Beds/Ba | Sqft | Sold | Price | $/sf | Match |
|---|---|---|---|---|---|---|---|
| 307 Harriman Ave | 0.02mi | 2/2.0 (-1) | 1,763 (+12%) | 2mo | $192,000 | $109 | 69 |
| 203 Primghar Ave | 0.18mi | 4/1.0 (+1) | 1,775 (+12%) | 12mo | $116,000 | $65 | 56 |
Match score weights: distance 35% · size 25% · config 20% · recency 20%. Top-matched comps best support the ARV.
Projected returns pro-forma
7.73% appreciation · 3.0% rent growth · sell at horizon
- IRR
- 19.8%
- Equity multiple
- 2.44×
- Total profit
- $60,083
- Equity at exit
- $110,885
- IRR
- 18.5%
- Equity multiple
- 5.14×
- Total profit
- $173,292
- Equity at exit
- $217,584
Cash invested: $41,860 (down + closing). Projections, not guarantees.
Landlord ↔ Tenant lean methodology
- Overall (STATE)
- 83 Strongly Landlord-Friendly
- State Iowa
- 83 Strongly Landlord-Friendly · R+6
- County
- — inherits STATE
- City
- — inherits STATE
ZIP-level market 51231
- Home prices YoY
- 4.9%
- Active inventory
- 4
- Price-to-rent
- 11.0×
Monthly cashflow live
- Estimated rent
- $1,135 medium interval (Pro) →
- Mortgage (P&I)
- −$784
- Tax from tax record
- −$33 /mo · $394/yr
- Insurance
- −$62
- HOA
- −$0
- Vacancy / Maint / Mgmt
- −$238
- Net cashflow
- $17
Break-even live
Sensitivity live
| Price | -10% $102 | -5% $60 | +0% $17 | +5% $-25 | +10% $-67 |
|---|---|---|---|---|---|
| Rent | -10% $-72 | -5% $-27 | +0% $17 | +5% $62 | +10% $107 |
| Rate | -1.0pp $93 | -0.5pp $55 | base $17 | +0.5pp $-21 | +1.0pp $-61 |
UW: 25.0% down · 7.5% · 30yr · 1.5% tax · 5.0% vac · 8.0% maint · 8.0% mgmt
Financing live
Cash to close
- Down payment
- $37,375
- Closing costs
- $4,485
- Reserves months
- —
- Total cash needed
- —
Loan-product check · same deal, 3 products live
Conventional
25% down · 7.5% · 30yr
- Down + closing
- —
- Monthly P&I
- —
- Monthly cashflow
- —
- DSCR
- —
- Eligible?
- —
Personal DTI + credit; lowest rate.
DSCR
20% down · 8.5% · 30yr
- Down + closing
- —
- Monthly P&I
- —
- Monthly cashflow
- —
- DSCR
- —
- Eligible?
- —
No personal income docs; deal must DSCR.
Hard money
10% down · 12.0% · 12mo
- Down + closing
- —
- Monthly P&I
- —
- Monthly cashflow
- —
- DSCR
- —
- Eligible?
- —
Short-term bridge; refi at stabilization.
Listing history 13 events
-
2026-06-21days on market $149,500 Active 17 DOM
-
2026-06-21days on market $149,500 Active 16 DOM
-
2026-06-18days on market $149,500 Active 14 DOM
-
2026-06-17days on market $149,500 Active 13 DOM
-
2026-06-16days on market $149,500 Active 12 DOM
-
2026-06-15days on market $149,500 Active 11 DOM
-
2026-06-13days on market $149,500 Active 9 DOM
-
2026-06-12days on market $149,500 Active 8 DOM
-
2026-06-09days on market $149,500 Active 5 DOM
-
2026-06-08days on market $149,500 Active 4 DOM
-
2026-06-07days on market $149,500 Active 3 DOM
-
2026-06-05remarks 341-char remark
-
2026-06-05$149,500 Active 1 DOM
ⓘ Source: listings_history table (triggers on properties + properties_extension) + one-shot
backfill from property_details.listing_events for pre-trigger history.
Tax reassessment forecast IA · Partial reset (capped growth)
- Current annual tax
- $394 · $33/mo
- Projected year-2 tax
- $1,371 · $114/mo
- Expected delta
- +$977/yr (+$81/mo · 247.9%)
ⓘ Screening estimate from a state-policy table — verify with the county assessor before closing.
Climate risk First Street
- Flood 1/10 Low FEMA zone X (unshaded) · 0% chance over 30 yrs
- Wildfire 1/10 Low
- Heat 3/10 Moderate 7 d/yr ≥101°F today · 15 d/yr by 30 yrs out
- Wind 2/10 Low
- Air quality 1/10 Low 0 unhealthy d/yr today · 0 by 30 yrs out
Nearby sold comps map
Loading sold comps map…
Walkable amenities ~0.75 mi
Loading nearby amenities…
Taxation est. · year 1
- Rental income
- $13,618
- − Mortgage interest
- −$8,374
- − Property taxes
- −$394
- − Insurance
- −$748
- − Repairs & maintenance
- −$1,089
- − Management
- −$1,089
- − Depreciation
- −$4,349
- Taxable loss
- −$2,426
- Est. tax savings @ 24.0%
- +$582
- After-tax cash flow
- $791/yr
For passive investors: Depreciation is non-cash, so a rental often shows a tax loss while cash-flowing — sheltering income. Rental losses are passive: they offset passive income freely, and up to $25,000/yr can offset ordinary (W-2) income if you actively participate and your MAGI is under $100k (phasing out to $0 by $150k); unused losses carry forward. On sale, claimed depreciation is recaptured at up to 25%, and gains may owe capital-gains tax (a 1031 exchange can defer both). Figures are a year-1 estimate at your 24.0% rate — not tax advice; consult a CPA.
Schools (NCES district)
- District
- Sheldon Community School District
- NCES district ID
- 1925980
- Math proficiency
- 74% ▼ -4.00%
- Reading proficiency
- 78% ▬ 0.00%
- Median HH income
- $50,644
- Composite
- 64.39/100
- National rank
- #545
- State rank
- #63 of 289 in IA
Livability — Archer
- Score
- 61/100
- State rank
- #792
- US rank
- #17924
Category grades
Schools grade is shown separately in the Schools card above.
Census & demographics
- Census place
- Archer, IA
- Population (ZIP)
- 543
Population outlook (O'Brien County) Hauer SSP2
- Today (2025)
- 13,353 people
- By 2030
- 13,040 · -2.3%
- By 2040
- 12,422 · -7.0%
- By 2050
- 11,887 · -11.0%
- By 2075
- 11,132 · -16.6%
- By 2100
- 10,176 · -23.8%
Race, ethnicity, and origin ACS 2023
- Neighborhood character
- Predominantly White (100%)
- Race & ethnicity
- White 100%
- Common ancestry
- Iranian 8% Portuguese 1%
- Foreign-born
- 0%
- Languages at home
- 98% English-only · Spanish 2%
Political lean MEDSL · O'Brien
- 2024 margin
- Solid R (+60.9) · D 19.0% · R 80.0% · Other 1.0%
- 2008→2024 swing
- -26.1pp toward R · 2008: -34.9pp · 2024: -60.9pp
- All cycles
- 2024: R+60.9 2020: R+56.8 2016: R+60.2 2012: R+45.2 2008: R+34.9
Not yet ingested
- Civics
- —
Market trends
- HPI YoY
- ▲ 7.73%
- Current HPI
- 165.2763
- Rent YoY
- —
- Metro
- —
- State GDP YoY
- ▲ 2.48%
- F500 in state
- 4
Industry mix (Fortune 500 HQ in IA)
| Industry | F500 HQs | Revenue |
|---|---|---|
| Financial Services | 1 | $16B |
|
||
| Retail / Convenience | 1 | $15B |
|
||
Price history
1 event — show timeline
- 2026-06-04 Listed $149,500 NWIA
Property tax history
+5.0%/yrLatest (2025): $394 · +2.1% YoY. Source: county tax records.
Cash-flow waterfall
monthlySold comps — $/sqft
last 12 mo · ≤1 miLoading sold comps…