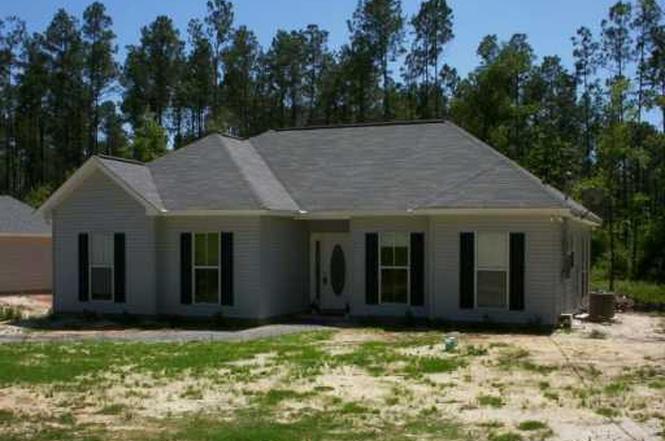
73169 Penn Mill Rd · Covington, LA
Flood risk 1/10 · Minimal
- FEMA flood zone
- X
- Chance of flooding over 30 yrs
- 0.0%
- Est. flood insurance / yr
- $507 – $1,088
Fire risk 6/10 · Moderate
- Est. fire insurance / yr
- $1,269 – $2,357
Heat risk 9/10 · Severe
- Hot days now (above 109°F)
- 7 days/yr
- Hot days in 30 yrs
- 22 days/yr
Wind risk 9/10 · Severe
- Chance of severe wind over 30 yrs
- 99.0%
Air-quality risk 2/10 · Minimal
- Unhealthy air days now
- 0 days/yr
- Unhealthy air days in 30 yrs
- 1 days/yr
Risk factors via First Street. Map © Google.
Why this score? — see what drove the B grade
The composite is a weighted blend of 9 inputs, each scored 0–100. Each bar is that input's sub-score; the figure is the points it added to the 100-point composite (weight × sub-score).
- Cash flow +29.1/30.0
- ARV discount +15.0/15.0
- DSCR +10.0/10.0
- 1% rule +7.1/10.0
- Schools +4.3/10.0
- Livability +3.8/5.0
- Rent growth +2.5/5.0
- Condition / age +2.5/5.0
- Appreciation +0.0/10.0
$179,000
🖨 Deal sheet 📄 Offer letter ✓ Due diligence
Listing remarks MLS
This lovely property features a freshly painted, renovated interior with 3 bedrooms and 2 baths on a 1/2 acre lot with a new roof (2024) in "C" flood zone. This open-concept kitchen offers granite countertops, stainless steel appliances and a breakfast area that has additional bar seating. The living room showcases a tray ceiling and overlooks the extensive backyard. The private end suite includes a tray ceiling, large soaking tub, separate shower and a walk-in closet. Laminate wood floors flow throughout the living areas and bedrooms with tile in the kitchen and baths. Enjoy a huge fenced-in backyard with endless possibilities. The home has an alarm and the code will be provided through Showing Time.
Key facts
- Open-concept kitchen
- Renovated interior
- Granite countertops
Tags
Property features AI
Finance
- Other: Property in very good condition; Lot size about 0.52 acres
Exterior
- Parking: Driveway; Off-street parking
- Security: Security system; Smoke detectors
- Utilities: Private well water; Septic tank
- Home design: Single-story home; Entry level: 1; Asphalt shingle roof; Vinyl siding
- Construction: Built on a slab foundation; Vinyl siding; Asphalt shingle roof
- Exterior features: Outside city limits; Oversized lot; Lot dimensions approximately 96 x 76 x 246 x 228
Interior
- Kitchen: Dishwasher; Oven; Range; Granite counters; Stainless steel appliances
- Bedrooms: Total of 7 rooms in the home
- Bathrooms: 2 full bathrooms
- Heating & cooling: Central heating; Central air conditioning
- Interior features: Tray ceilings; Ceiling fans; Granite counters; Stainless steel appliances; Wood-burning fireplace
- Laundry & utility: Washer hookup; Dryer hookup
Neighborhood map
What this means for you Summary
Snapshot
- This is a 3-bed/2.0-bath single-family listed at $179k.
Deal economics
- At list price, monthly cash flow is $619 ($7k/yr) — positive.
- The deal already cash-flows at list — no discount required.
- Meets the 1% rule at list price ($2k rent vs $179k).
- Cap rate 10.4% vs local median 3.9% in Covington — top-decile yield for the area; either an underpriced asset or a hidden risk that comps aren't pricing in. Stress-test before assuming the spread holds.
Location & tenants
- Location reads 75/100 on livability (#17 in LA, #3,876 nationally) — a middle-class / working-renter tenant base. Strengths: employment A+, housing A+, health & safety A+; Watch: amenities F, commute F.
- St. Tammany Parish (suburban): math 43% / reading 55% proficiency, ranked #11 of 98 in LA (top 11%) — families likely to look elsewhere, expect single-tenant / working-renter base with shorter leases.
- Market conditions: 365 active listings in the ZIP; 2 comparable units currently listed for rent nearby; solid renter incomes; 1,064 units permitted in St. Tammany Parish in 2024 (0 in 5+ unit buildings).
- This rent runs 32% of the median local income ($81k/yr) — at the standard rent-burdened threshold; future hikes will face affordability resistance.
Forward outlook
- Local home prices are declining (-3.0%/yr); year-one equity from $1k of loan paydown is wiped out by about $5k of value loss. Plan a longer hold.
- St. Tammany County population projected at +27% by 2050 — long-run rental-demand tailwind backs the buy-and-hold thesis.
- At projected returns (-3.0% appreciation + 3.0% rent growth), your $50k cash investment doubles in ~8 years — after that, you're playing with house money.
Negotiation context
- Only 2 days on market — expect competitive offers; lowballing is unlikely to land.
- 10 sale attempts since 21y ago with the ask held roughly flat each time — persistent listings suggest the price (not the market) is what's stuck; bring a comps-based counter.
- Current owner paid $129k; 39% above their basis — modest negotiation headroom, anchor on the comps not their cost.
Risks & watch-outs
- Climate carrying-cost: severe wind risk, 99% chance of damaging wind over 30y; major wildfire risk; extreme-heat days projected 7→22/yr by 2055 (HVAC capex compounding) — expect insurance premiums to compound above CPI over the hold.
Questions for the listing agent
- Is there a deadline driving the sale (1031 exchange, divorce, estate, relocation)? That informs how much negotiation room exists.
- Schools are B-rated — typically a magnet for longer-tenancy family renters. What's the average tenant stay here, and is there a school-zone premium baked into asking?
- What's the average days-on-market for RENTAL listings here right now (not sales)? A rising rental-DOM trend means longer vacancies and softer asking-rent achievability than the comps imply.
- What's the recent tenant-quality profile in this submarket — average credit score on applications, eviction rate, late-payment / NSF rate, and stable-employment percentage? A property-management company in the area should have these aggregated.
- How much new for-sale + rental construction is in the pipeline within 1–3 miles? Heavy new supply typically softens prices + rents 12–24 months out; constrained supply supports both.
Investment metrics
- 1% rule
- 1.21% ✓
- Cap rate
- 10.44%
- Cash-on-cash
- 14.83%
- DSCR
- 1.66
- GRM
- 6.9
CMA / ARV
- ARV (median comp)
- $270,132
- List price
- $179,000
- Delta
- -30.03%
- Verdict
- UNDERPRICED
- Comps
- 20 within 1.0 mi
Show comp detail 8 sales within ~0.75 mi
| Address | Dist | Beds/Ba | Sqft | Sold | Price | $/sf | Match |
|---|---|---|---|---|---|---|---|
| 73120 Penn Mill Rd | 0.20mi | 3/2.0 | 1,445 (+3%) | 1mo | $262,000 | $181 | 85 |
| 73104 Penn Mill Rd | 0.22mi | 3/2.0 | 1,310 (-6%) | 3mo | $235,000 | $179 | 77 |
| 73749 Amber Ct | 0.16mi | 3/2.0 | 1,508 (+8%) | 14mo | $235,000 | $156 | 68 |
| 73230 Penn Mill Rd | 0.16mi | 3/2.0 | 1,550 (+11%) | 12mo | $255,000 | $165 | 64 |
| 15524 Madris Ln | 0.27mi | 3/2.0 | 1,508 (+8%) | 14mo | $225,500 | $150 | 63 |
| 15553 Madris Ln | 0.18mi | 3/2.0 | 1,508 (+8%) | 24mo | $239,500 | $159 | 59 |
| 52 Hickory Dr | 0.70mi | 3/2.0 | 1,453 (+4%) | 10mo | $250,000 | $172 | 53 |
| 57 Lurline Dr | 0.60mi | 3/2.0 | 1,460 (+4%) | 15mo | $212,900 | $146 | 52 |
Match score weights: distance 35% · size 25% · config 20% · recency 20%. Top-matched comps best support the ARV.
Projected returns pro-forma
-3.0% appreciation · 3.0% rent growth · sell at horizon
- IRR
- 5.3%
- Equity multiple
- 1.21×
- Total profit
- $10,386
- Equity at exit
- $26,689
- IRR
- 14.7%
- Equity multiple
- 2.19×
- Total profit
- $59,615
- Equity at exit
- $15,477
Cash invested: $50,120 (down + closing). Projections, not guarantees.
Landlord ↔ Tenant lean methodology
- Overall (STATE)
- 90 Strongly Landlord-Friendly
- State Louisiana
- 90 Strongly Landlord-Friendly · R+12
- County
- — inherits STATE
- City
- — inherits STATE
ZIP-level market 70435
- Home prices YoY
- -27.3%
- Active inventory
- 365
- Price-to-rent
- 6.9×
Monthly cashflow live
- Estimated rent
- $2,170 medium interval (Pro) →
- Mortgage (P&I)
- −$939
- Tax from tax record
- −$82 /mo · $982/yr
- Insurance
- −$75
- HOA
- −$0
- Vacancy / Maint / Mgmt
- −$456
- Net cashflow
- $619
Break-even live
UW: 25.0% down · 7.5% · 30yr · 1.5% tax · 5.0% vac · 8.0% maint · 8.0% mgmt
Financing live
Cash to close
- Down payment
- $44,750
- Closing costs
- $5,370
- Reserves months
- —
- Total cash needed
- —
Loan-product check · same deal, 3 products live
Conventional
25% down · 7.5% · 30yr
- Down + closing
- —
- Monthly P&I
- —
- Monthly cashflow
- —
- DSCR
- —
- Eligible?
- —
Personal DTI + credit; lowest rate.
DSCR
20% down · 8.5% · 30yr
- Down + closing
- —
- Monthly P&I
- —
- Monthly cashflow
- —
- DSCR
- —
- Eligible?
- —
No personal income docs; deal must DSCR.
Hard money
10% down · 12.0% · 12mo
- Down + closing
- —
- Monthly P&I
- —
- Monthly cashflow
- —
- DSCR
- —
- Eligible?
- —
Short-term bridge; refi at stabilization.
Rent comps 2 comps
| Address | Beds | Baths | Sqft | Rent | $/sqft | DOM | Units | Dist |
|---|---|---|---|---|---|---|---|---|
| 15568 Madris Ln Covington, LA | 3.0 | 2.0 | 1600 | $1,825 | $1.14 | 19d | 1 | 0.17mi |
| 72291 Forest Dr Covington, LA | 3.0 | 2.0 | 1680 | $2,000 | $1.19 | 43d | 1 | 1.32mi |
Listing history 20 events
-
2026-06-18days on market $179,000 Active 2 DOM
-
2026-06-16remarks 689-char remark
Show marketing remark (720 chars)
This lovely property features a freshly painted, renovated interior with 3 bedrooms and 2 baths on a 1/2 acre lot with a new roof (2024) in "C" flood zone. This open-concept kitchen offers granite countertops, stainless steel appliances and a breakfast area that has additional bar seating. The living room showcases a tray ceiling and overlooks the extensive backyard. The private end suite includes a tray ceiling, large soaking tub, separate shower and a walk-in closet. Laminate wood floors flow throughout the living areas and bedrooms with tile in the kitchen and baths. Enjoy a huge fenced-in backyard with endless possibilities. The home has an alarm and the code will be provided through Showing Time.
-
2026-06-16pricestatusdays on market $179,000 Active 1 DOM
Show marketing remark (720 chars)
This lovely property features a freshly painted, renovated interior with 3 bedrooms and 2 baths on a 1/2 acre lot with a new roof (2024) in "C" flood zone. This open-concept kitchen offers granite countertops, stainless steel appliances and a breakfast area that has additional bar seating. The living room showcases a tray ceiling and overlooks the extensive backyard. The private end suite includes a tray ceiling, large soaking tub, separate shower and a walk-in closet. Laminate wood floors flow throughout the living areas and bedrooms with tile in the kitchen and baths. Enjoy a huge fenced-in backyard with endless possibilities. The home has an alarm and the code will be provided through Showing Time.
-
2026-05-08status Pending
-
2026-05-08status Active
-
2026-05-07status Active
-
2026-04-29$189,000 Active
-
2026-04-28$189,000 Active
-
2026-03-17price $205,400
-
2026-03-17price $205,400
-
2026-03-06status Active
-
2026-02-19price $210,000
-
2026-02-19price $210,000
-
2026-02-18status Pending
-
2026-02-14$189,500 Active
-
2005-09-12soldstatus $128,700
-
2005-08-19soldstatus $128,700
-
2005-05-04$129,900
-
2005-05-04$129,900
-
2004-07-22soldstatus $122,000
ⓘ Source: listings_history table (triggers on properties + properties_extension) + one-shot
backfill from property_details.listing_events for pre-trigger history.
Tax reassessment forecast LA · Resets to sale price
- Current annual tax
- $982 · $82/mo
- Projected year-2 tax
- $984 · $82/mo
- Expected delta
- +$3/yr ($0/mo · 0.3%)
ⓘ Screening estimate from a state-policy table — verify with the county assessor before closing.
Climate risk First Street
- Flood 1/10 Low FEMA zone X · 0% chance over 30 yrs
- Wildfire 6/10 Major
- Heat 9/10 Extreme 7 d/yr ≥109°F today · 22 d/yr by 30 yrs out
- Wind 9/10 Extreme 99% chance of damaging wind over 30 yrs
- Air quality 2/10 Low 0 unhealthy d/yr today · 1 by 30 yrs out
Nearby sold comps map
Loading sold comps map…
Walkable amenities ~0.75 mi
Loading nearby amenities…
Taxation est. · year 1
- Rental income
- $26,042
- − Mortgage interest
- −$10,027
- − Property taxes
- −$982
- − Insurance
- −$895
- − Repairs & maintenance
- −$2,083
- − Management
- −$2,083
- − Depreciation
- −$5,207
- Taxable income
- $4,764
- Est. tax owed @ 24.0%
- −$1,143
- After-tax cash flow
- $6,289/yr
For passive investors: Depreciation is non-cash, so a rental often shows a tax loss while cash-flowing — sheltering income. Rental losses are passive: they offset passive income freely, and up to $25,000/yr can offset ordinary (W-2) income if you actively participate and your MAGI is under $100k (phasing out to $0 by $150k); unused losses carry forward. On sale, claimed depreciation is recaptured at up to 25%, and gains may owe capital-gains tax (a 1031 exchange can defer both). Figures are a year-1 estimate at your 24.0% rate — not tax advice; consult a CPA.
Schools (NCES district)
- District
- St. Tammany Parish
- NCES district ID
- 2201650
- Math proficiency
- 43% ▼ -32.00%
- Reading proficiency
- 55% ▼ -26.00%
- Median HH income
- $61,752
- Composite
- 43.04/100
- National rank
- #3098
- State rank
- #11 of 98 in LA
Livability — Covington
- Score
- 75/100
- State rank
- #17
- US rank
- #3876
Category grades
Schools grade is shown separately in the Schools card above.
Census & demographics
- County
- Saint Tammany Parish · 228,296 people
- City population
- 64,351
- Metro
- New Orleans-Metairie, LA
- Population (ZIP)
- 22,475
- Household income
- $80,926
- Rent vs Own
- Severe rent burden
- 296.0
Population outlook (St. Tammany County) Hauer SSP2
- Today (2025)
- 286,725 people
- By 2030
- 304,175 · +6.1%
- By 2040
- 336,203 · +17.3%
- By 2050
- 364,590 · +27.2%
- By 2075
- 433,362 · +51.1%
- By 2100
- 470,333 · +64.0%
Race, ethnicity, and origin ACS 2023
- Neighborhood character
- Predominantly White (84%)
- Race & ethnicity
- White 84% Black 9% Two or more races 4% Hispanic / Latino 3% Pacific Islander 2%
- Common ancestry
- Lithuanian 15% Serbian 1% Slovak 1%
- Foreign-born
- 2% · Canada
- Languages at home
- 97% English-only · Spanish 1% French/Haitian/Cajun 1%
Political lean MEDSL · St. Tammany
- 2024 margin
- Solid R (+43.8) · D 27.3% · R 71.1% · Other 1.6%
- 2008→2024 swing
- +9.6pp toward D · 2008: -53.4pp · 2024: -43.8pp
- All cycles
- 2024: R+43.8 2020: R+44.2 2016: R+50.8 2012: R+52.2 2008: R+53.4
Not yet ingested
- Civics
- —
Market trends
- HPI YoY
- ▼ -76.03%
- Current HPI
- 202.0458
- Rent YoY
- —
- Metro
- New Orleans-Metairie, LA
- State GDP YoY
- ▲ 3.29%
- F500 in state
- 10
Industry mix (Fortune 500 HQ in LA)
| Industry | F500 HQs | Revenue |
|---|---|---|
| Telecommunications | 2 | $23B |
|
||
| Utilities | 1 | $12B |
|
||
| Wholesale / Distribution | 1 | $5B |
|
||
| Advertising | 1 | $2B |
|
||
Price history
+46.7% since first listed19 events — show timeline
- 2026-06-16 Listed $179,000 GSREIN
- 2026-06-16 Listed $179,000 AcadianaMLS
- 2026-05-08 Pending — AcadianaMLS
- 2026-05-08 Relisted — AcadianaMLS
- 2026-05-07 Relisted — AcadianaMLS
- 2026-04-29 Listed $189,000 AcadianaMLS
- 2026-04-28 Listed $189,000 AcadianaMLS
- 2026-03-17 Price Changed $205,400 AcadianaMLS
- 2026-03-17 Price Changed $205,400 GSREIN
- 2026-03-06 Relisted — AcadianaMLS
- 2026-02-19 Price Changed $210,000 AcadianaMLS
- 2026-02-19 Price Changed $210,000 GSREIN
- 2026-02-18 Pending — AcadianaMLS
- 2026-02-14 Listed $189,500 AcadianaMLS
- 2005-09-12 Sold (Public Records) $128,700 Public Records
- 2005-08-19 Sold (MLS) $128,700 GSREIN
- 2005-05-04 Listed $129,900 AcadianaMLS
- 2005-05-04 Listed $129,900 GSREIN
- 2004-07-22 Sold (Public Records) $122,000 Public Records
Property tax history
-5.9%/yrLatest (2025): $982 · -3.8% YoY. Source: county tax records.
Cash-flow waterfall
monthlySold comps — $/sqft
last 12 mo · ≤1 miLoading sold comps…