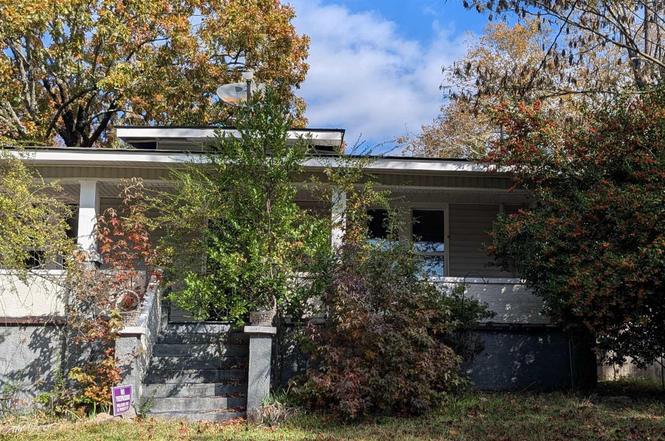
155 Ravine St · Hot Springs, AR
Flood risk 1/10 · Minimal
- FEMA flood zone
- X (unshaded)
- Chance of flooding over 30 yrs
- 0.0%
- Est. flood insurance / yr
- $507 – $1,088
Fire risk 4/10 · Minor
- Est. fire insurance / yr
- $1,499 – $2,785
Heat risk 5/10 · Moderate
- Hot days now (above 111°F)
- 7 days/yr
- Hot days in 30 yrs
- 20 days/yr
Wind risk 3/10 · Minor
- Chance of severe wind over 30 yrs
- 8.0%
Air-quality risk 1/10 · Minimal
- Unhealthy air days now
- 0 days/yr
- Unhealthy air days in 30 yrs
- 0 days/yr
Risk factors via First Street. Map © Google.
Why this score? — see what drove the C grade
The composite is a weighted blend of 9 inputs, each scored 0–100. Each bar is that input's sub-score; the figure is the points it added to the 100-point composite (weight × sub-score).
- Cash flow +23.9/30.0
- ARV discount +12.1/15.0
- DSCR +7.7/10.0
- 1% rule +5.3/10.0
- Livability +3.2/5.0
- Rent growth +2.5/5.0
- Condition / age +2.5/5.0
- Schools +2.0/10.0
- Appreciation +0.0/10.0
$133,000
🖨 Deal sheet (PDF) 📄 Offer letter ✓ Due diligence
Listing remarks MLS
Fascinating home with 2 BR and 1 BA, 9 ft. ceilings, large living room and formal dining room. Sun room in rear of house could be an extra dining area, 2nd living area, or office space. Separate workshop with garage in rear, and a large wood deck with wheelchair ramp and front porch for outdoor enjoyment. Sealed double pane windows, good insulation and 1 yr. old roof.
Key facts
- Detached
- 0.32 acre lot
- Garage
Tags
Neighborhood map
What this means for you Summary
Snapshot
- This is a 3-bed/1.0-bath single-family listed at $133k.
Deal economics
- At list price, monthly cash flow is $258 ($3k/yr) — positive.
- The deal already cash-flows at list — no discount required.
- Meets the 1% rule at list price ($1k rent vs $133k).
- Cap rate 8.6% vs local median 2.8% in Hot Springs — top-decile yield for the area; either an underpriced asset or a hidden risk that comps aren't pricing in. Stress-test before assuming the spread holds.
Location & tenants
- Location reads 65/100 on livability (#140 in AR) — a middle-class / working-renter tenant base. Strengths: cost of living A+, housing A+, health & safety A-; Watch: crime F, amenities F, commute F.
- Hot Springs School District (urban): math 24% / reading 25% proficiency, ranked #195 of 238 in AR (top 82%) — low school quality limits family demand, transient renter base, plan for 1-2y turnover; 72% free/reduced lunch — lower-income household profile, screen leases tightly.
- Zoned schools: Hot Springs Junior Academy (math 20% / reading 29%, grade F, #166 of 201 statewide, top 84%, 815 students, 100% FRL, charter); Hot Springs World Class High School (math 12% / reading 24%, grade F, #252 of 292 statewide, top 87%, 739 students, 100% FRL, charter) — zoned schools average 100% FRL vs 72% district-wide (28 pts higher); higher-poverty schools than district average — tighter screening recommended.
- Market conditions: 363 active listings in the ZIP; 7 comparable units currently listed for rent nearby; rentals lingering (median 46d on market — plan ~5-8 weeks vacancy on turnover, expect pricing pressure); 86% of comp listings sitting > 30 days — soft ceiling on asking rent; 117 units permitted in Garland County in 2024 (24 in 5+ unit buildings).
- This rent runs 31% of the median local income ($54k/yr) — at the standard rent-burdened threshold; future hikes will face affordability resistance.
Forward outlook
- Local home prices are declining (-3.0%/yr); year-one equity from $920 of loan paydown is wiped out by about $4k of value loss. Plan a longer hold.
- Garland County population projected at +7% by 2050 — modest demand growth; plan on rents tracking national, not racing it.
Negotiation context
- Only 8 days on market — expect competitive offers; lowballing is unlikely to land.
- 2 sale attempts since 13y ago with the ask held roughly flat each time — persistent listings suggest the price (not the market) is what's stuck; bring a comps-based counter.
- Current owner paid $52k; list at $133k implies a 156% gain — meaningful room to come down on a strong offer.
Risks & watch-outs
- Watch-outs: built in 1920 — expect roof / HVAC / electrical / plumbing capex.
- Climate carrying-cost: extreme-heat days projected 7→20/yr by 2055 (HVAC capex compounding) — expect insurance premiums to compound above CPI over the hold.
Questions for the listing agent
- Built in 1920 — when were the roof, HVAC, electrical panel, plumbing, and water heater last replaced?
- Is there a deadline driving the sale (1031 exchange, divorce, estate, relocation)? That informs how much negotiation room exists.
- Schools are D-rated, which usually means shorter tenancies and higher turnover. Who's the typical renter profile here, and what's been the actual vacancy rate?
- Crime grade is F in this area — have there been break-ins, vandalism, or insurance claims at this property in the last 3 years? What carrier currently insures it and at what premium?
- What's the average days-on-market for RENTAL listings here right now (not sales)? A rising rental-DOM trend means longer vacancies and softer asking-rent achievability than the comps imply.
- What's the recent tenant-quality profile in this submarket — average credit score on applications, eviction rate, late-payment / NSF rate, and stable-employment percentage? A property-management company in the area should have these aggregated.
- How much new for-sale + rental construction is in the pipeline within 1–3 miles? Heavy new supply typically softens prices + rents 12–24 months out; constrained supply supports both.
Investment metrics
- 1% rule
- 1.03% ✓
- Cap rate
- 8.62%
- Cash-on-cash
- 8.32%
- DSCR
- 1.37
- GRM
- 8.1
CMA / ARV
- ARV (on-the-fly)
- $148,000
- Comps found
- 12
Show comp detail 12 sales within ~0.75 mi
| Address | Dist | Beds/Ba | Sqft | Sold | Price | $/sf | Match |
|---|---|---|---|---|---|---|---|
| 112 Cove St | 0.27mi | 3/1.0 | 1,497 (+1%) | 5mo | $125,000 | $84 | 82 |
| 104 Hillcrest St | 0.25mi | 2/2.5 (-1) | 1,449 (-2%) | 0mo | $145,000 | $100 | 74 |
| 117 Poplar St St | 0.41mi | 3/1.0 | 1,500 (+1%) | 12mo | $210,000 | $140 | 69 |
| 101 Westbrook St | 0.41mi | 3/1.0 | 1,600 (+8%) | 1mo | $236,500 | $148 | 66 |
| 301 Ramble St | 0.29mi | 3/1.0 | 1,301 (-12%) | 3mo | $179,000 | $138 | 63 |
| 209 Magnolia St | 0.20mi | 3/2.0 | 1,670 (+13%) | 5mo | $125,000 | $75 | 61 |
| 100 Wren St | 0.46mi | 3/2.0 | 1,543 (+4%) | 9mo | $75,000 | $49 | 60 |
| 117 Eddy St | 0.32mi | 3/1.0 | 1,300 (-12%) | 10mo | $145,000 | $112 | 56 |
| 236 Walnut St | 0.73mi | 3/1.0 | 1,360 (-8%) | 1mo | $34,000 | $25 | 52 |
| 137 Carlton Ter | 0.38mi | 3/2.0 | 1,624 (+10%) | 15mo | $145,000 | $89 | 50 |
| 109 Reynolds St | 0.61mi | 2/1.0 (-1) | 1,332 (-10%) | 4mo | $150,000 | $113 | 46 |
| 210 Harrell St | 0.61mi | 3/1.5 | 1,694 (+14%) | 5mo | $160,875 | $95 | 42 |
Match score weights: distance 35% · size 25% · config 20% · recency 20%. Top-matched comps best support the ARV.
Projected returns pro-forma
-3.0% appreciation · 3.0% rent growth · sell at horizon
- IRR
- -3.7%
- Equity multiple
- 0.86×
- Total profit
- $-5,146
- Equity at exit
- $19,831
- IRR
- 6.0%
- Equity multiple
- 1.44×
- Total profit
- $16,537
- Equity at exit
- $11,499
Cash invested: $37,240 (down + closing). Projections, not guarantees.
Landlord ↔ Tenant lean methodology
- Overall (STATE)
- 92 Strongly Landlord-Friendly
- State Arkansas
- 92 Strongly Landlord-Friendly · R+14
- County
- — inherits STATE
- City
- — inherits STATE
ZIP-level market 71901
- Home prices YoY
- -3.6%
- Active inventory
- 363
- Price-to-rent
- 8.1×
Monthly cashflow live
- Estimated rent
- $1,369 high interval (Pro) →
- Mortgage (P&I)
- −$697
- Tax from tax record
- −$70 /mo · $845/yr
- Insurance
- −$55
- HOA
- −$0
- Vacancy / Maint / Mgmt
- −$287
- Net cashflow
- $258
Break-even live
Sensitivity live
| Price | -10% $333 | -5% $296 | +0% $258 | +5% $221 | +10% $183 |
|---|---|---|---|---|---|
| Rent | -10% $150 | -5% $204 | +0% $258 | +5% $312 | +10% $366 |
| Rate | -1.0pp $325 | -0.5pp $292 | base $258 | +0.5pp $224 | +1.0pp $189 |
UW: 25.0% down · 7.5% · 30yr · 1.5% tax · 5.0% vac · 8.0% maint · 8.0% mgmt
Financing live
Cash to close
- Down payment
- $33,250
- Closing costs
- $3,990
- Reserves months
- —
- Total cash needed
- —
Loan-product check · same deal, 3 products live
Conventional
25% down · 7.5% · 30yr
- Down + closing
- —
- Monthly P&I
- —
- Monthly cashflow
- —
- DSCR
- —
- Eligible?
- —
Personal DTI + credit; lowest rate.
DSCR
20% down · 8.5% · 30yr
- Down + closing
- —
- Monthly P&I
- —
- Monthly cashflow
- —
- DSCR
- —
- Eligible?
- —
No personal income docs; deal must DSCR.
Hard money
10% down · 12.0% · 12mo
- Down + closing
- —
- Monthly P&I
- —
- Monthly cashflow
- —
- DSCR
- —
- Eligible?
- —
Short-term bridge; refi at stabilization.
Rent comps 7 comps
| Address | Beds | Baths | Sqft | Rent | $/sqft | DOM | Units | Dist |
|---|---|---|---|---|---|---|---|---|
| 605 Hig Fry Rd Hot Springs National Park, AR | 2.0 | 1.0–2.0 | 806 | $1,400 | $1.74 | 25d | 1 | 0.54mi |
| 103 Juniper Pl Hot Springs National Park, AR | 3.0 | 1.0 | 1056 | $1,250 | $1.18 | 45d | 1 | 0.83mi |
| 315 Convention Blvd Hot Springs, AR | 2.0 | 1.0 | 900 | $950 | $1.06 | 45d | 4 | 0.99mi |
| 125 Oak St Unit 1-307 Hot Springs, AR | 2.0 | 1.0 | 1000 | $1,350 | $1.35 | 45d | 1 | 1.35mi |
| 125 Oak St Unit 1-402 Hot Springs, AR | 2.0 | 1.0 | 1150 | $1,475 | $1.28 | 45d | 1 | 1.35mi |
| 125 Oak St Unit 1-306 Hot Springs, AR | 2.0 | 1.0 | 970 | $1,200 | $1.24 | 45d | 1 | 1.35mi |
| 244 Palmetto St Hot Springs National Park, AR | 4.0 | 2.0 | 1244 | $1,595 | $1.28 | 45d | 1 | 1.43mi |
Listing history 6 events
-
2026-03-10status Under Contract
-
2026-03-01$133,000 New Listing
-
2013-10-29soldstatus $52,000
-
2013-10-28soldstatus $52,000 370-char remark
Show marketing remark (370 chars)
Fascinating home with 2 BR and 1 BA, 9 ft. ceilings, large living room and formal dining room. Sun room in rear of house could be an extra dining area, 2nd living area, or office space. Separate workshop with garage in rear, and a large wood deck with wheelchair ramp and front porch for outdoor enjoyment. Sealed double pane windows, good insulation and 1 yr. old roof.
-
2013-10-16historical 370-char remark
Show marketing remark (370 chars)
Fascinating home with 2 BR and 1 BA, 9 ft. ceilings, large living room and formal dining room. Sun room in rear of house could be an extra dining area, 2nd living area, or office space. Separate workshop with garage in rear, and a large wood deck with wheelchair ramp and front porch for outdoor enjoyment. Sealed double pane windows, good insulation and 1 yr. old roof.
-
2013-08-14$54,900 370-char remark
Show marketing remark (370 chars)
Fascinating home with 2 BR and 1 BA, 9 ft. ceilings, large living room and formal dining room. Sun room in rear of house could be an extra dining area, 2nd living area, or office space. Separate workshop with garage in rear, and a large wood deck with wheelchair ramp and front porch for outdoor enjoyment. Sealed double pane windows, good insulation and 1 yr. old roof.
ⓘ Source: listings_history table (triggers on properties + properties_extension) + one-shot
backfill from property_details.listing_events for pre-trigger history.
Tax reassessment forecast AR · Resets to sale price
- Current annual tax
- $845 · $70/mo
- Projected year-2 tax
- $851 · $71/mo
- Expected delta
- +$6/yr (+$1/mo · 0.8%)
ⓘ Screening estimate from a state-policy table — verify with the county assessor before closing.
Climate risk First Street
- Flood 1/10 Low FEMA zone X (unshaded) · 0% chance over 30 yrs
- Wildfire 4/10 Moderate
- Heat 5/10 Major 7 d/yr ≥111°F today · 20 d/yr by 30 yrs out
- Wind 3/10 Moderate 8% chance of damaging wind over 30 yrs
- Air quality 1/10 Low 0 unhealthy d/yr today · 0 by 30 yrs out
Nearby sold comps map
Loading sold comps map…
Walkable amenities ~0.75 mi
Loading nearby amenities…
Taxation est. · year 1
- Rental income
- $16,427
- − Mortgage interest
- −$7,450
- − Property taxes
- −$845
- − Insurance
- −$665
- − Repairs & maintenance
- −$1,314
- − Management
- −$1,314
- − Depreciation
- −$3,869
- Taxable income
- $970
- Est. tax owed @ 24.0%
- −$233
- After-tax cash flow
- $2,865/yr
For passive investors: Depreciation is non-cash, so a rental often shows a tax loss while cash-flowing — sheltering income. Rental losses are passive: they offset passive income freely, and up to $25,000/yr can offset ordinary (W-2) income if you actively participate and your MAGI is under $100k (phasing out to $0 by $150k); unused losses carry forward. On sale, claimed depreciation is recaptured at up to 25%, and gains may owe capital-gains tax (a 1031 exchange can defer both). Figures are a year-1 estimate at your 24.0% rate — not tax advice; consult a CPA.
Schools (NCES district)
- District
- Hot Springs School District
- NCES district ID
- 0507890
- Math proficiency
- 24% ▼ -15.00%
- Reading proficiency
- 25% ▼ -12.00%
- Median HH income
- $28,817
- Composite
- 19.62/100
- National rank
- #8746
- State rank
- #195 of 238 in AR
Livability — Hot Springs
- Score
- 65/100
- State rank
- #140
- US rank
- #12498
Category grades
Schools grade is shown separately in the Schools card above.
Census & demographics
- Census place
- Hot Springs, AR
- County
- Garland County · 76,414 people
- City population
- 76,414
- Metro
- Hot Springs, AR
- Population (ZIP)
- 28,937
- Household income
- $53,514
- Rent vs Own
- Severe rent burden
- 961.0
Population outlook (Garland County) Hauer SSP2
- Today (2025)
- 100,343 people
- By 2030
- 101,880 · +1.5%
- By 2040
- 104,804 · +4.4%
- By 2050
- 107,292 · +6.9%
- By 2075
- 113,182 · +12.8%
- By 2100
- 112,247 · +11.9%
Race, ethnicity, and origin ACS 2023
- Neighborhood character
- Predominantly White (71%)
- Race & ethnicity
- White 71% Black 13% Hispanic / Latino 10% Two or more races 6%
- Hispanic origin (detail)
- Mexican 7%
- Common ancestry
- Italian 2% Slovak 2% Portuguese 1%
- Foreign-born
- 5% · Canada, Vietnam
- Languages at home
- 90% English-only · Spanish 7% Vietnamese 1%
Political lean MEDSL · Garland
- 2024 margin
- Solid R (+36.2) · D 30.8% · R 67.0% · Other 2.2%
- 2008→2024 swing
- -11.3pp toward R · 2008: -25.0pp · 2024: -36.2pp
- All cycles
- 2024: R+36.2 2020: R+34.0 2016: R+34.1 2012: R+29.9 2008: R+25.0
Not yet ingested
- Civics
- —
Market trends
- HPI YoY
- ▼ -11.75%
- Current HPI
- 317.2542
- Rent YoY
- —
- Metro
- Hot Springs, AR
- State GDP YoY
- ▲ 3.80%
- F500 in state
- 10
Industry mix (Fortune 500 HQ in AR)
| Industry | F500 HQs | Revenue |
|---|---|---|
| Retail | 1 | $681B |
|
||
| Food / Agriculture | 1 | $53B |
|
||
| Retail / Energy | 1 | $22B |
|
||
| Transportation / Logistics | 1 | $12B |
|
||
| Energy | 1 | $4B |
|
||
Price history
+142.3% since first listed6 events — show timeline
- 2026-03-10 Pending — CARMLS
- 2026-03-01 Listed $133,000 CARMLS
- 2013-10-29 Sold (Public Records) $52,000 Public Records
- 2013-10-28 Sold (MLS) $52,000 CARMLS
- 2013-10-16 Listing Removed — CARMLS
- 2013-08-14 Listed $54,900 CARMLS
Property tax history
+6.4%/yrLatest (2025): $845 · +6.3% YoY. Source: county tax records.
Cash-flow waterfall
monthlySold comps — $/sqft
last 12 mo · ≤1 miLoading sold comps…