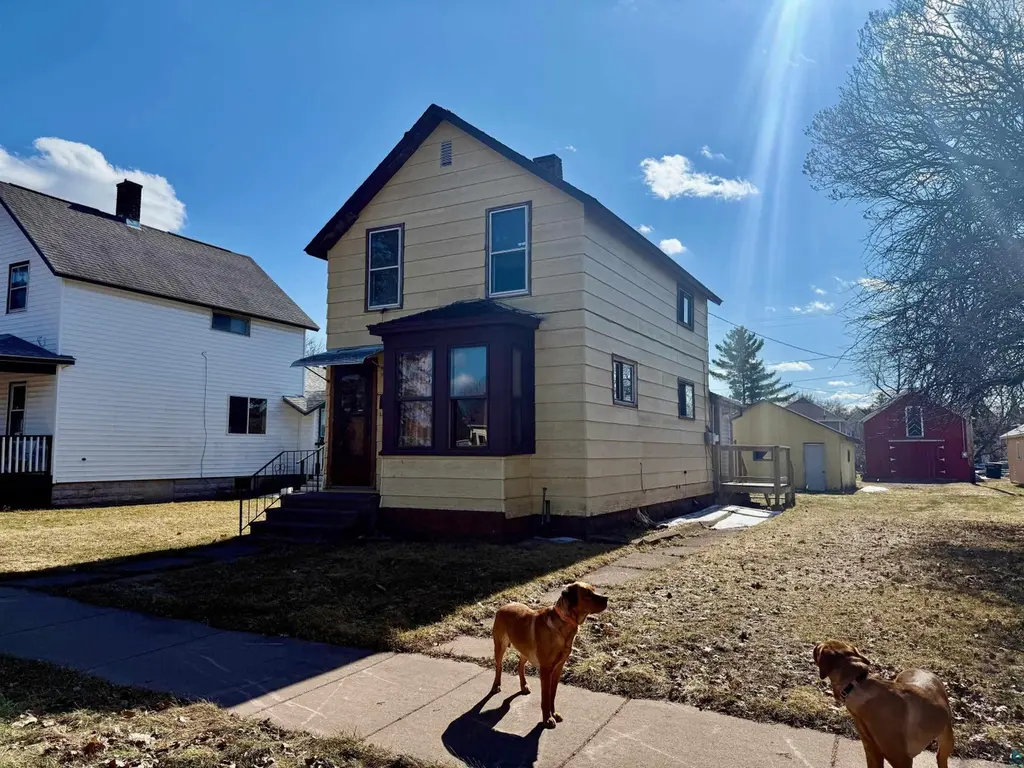
711 3rd Ave W · Ashland, WI
Flood risk 1/10 · Minimal
- FEMA flood zone
- X
- Chance of flooding over 30 yrs
- 0.0%
- Est. flood insurance / yr
- $473 – $860
Fire risk 1/10 · Minimal
- Est. fire insurance / yr
- $636 – $1,182
Heat risk 1/10 · Minimal
- Hot days now (above 92°F)
- 7 days/yr
- Hot days in 30 yrs
- 13 days/yr
Wind risk 1/10 · Minimal
- Chance of severe wind over 30 yrs
- —
Air-quality risk 1/10 · Minimal
- Unhealthy air days now
- 0 days/yr
- Unhealthy air days in 30 yrs
- 0 days/yr
Risk factors via First Street. Map © Google.
Why this score? — see what drove the C+ grade
The composite is a weighted blend of 9 inputs, each scored 0–100. Each bar is that input's sub-score; the figure is the points it added to the 100-point composite (weight × sub-score).
- Cash flow +28.0/30.0
- DSCR +9.9/10.0
- 1% rule +8.3/10.0
- ARV discount +7.5/15.0
- Livability +4.2/5.0
- Rent growth +2.5/5.0
- Condition / age +2.5/5.0
- Schools +1.9/10.0
- Appreciation +0.0/10.0
$79,900
🖨 Deal sheet (PDF) 📄 Offer letter ✓ Due diligence
Key facts
- 6,969 sq ft lot
- 2 garage spots
- Built 1900
Property features AI
Finance
- Financial info: Taxes listed for 2025
Exterior
- Parking: 2-car garage (2 garage parking spaces)
- Home design: 1.5-story single-family home
- Exterior features: Lot approximately 0.16 acre
Interior
- Kitchen: Kitchen on main level (16 x 11)
- Bedrooms: Upper-level bedroom (15 x 12); Upper-level bedroom (12 x 11)
- Bathrooms: 1 full bathroom
- Interior features: Main-level living room; Main-level dining room; Main-level kitchen
Neighborhood map
What this means for you Summary
Snapshot
- This is a 2-bed/1.0-bath other listed at $80k.
Deal economics
- At list price, monthly cash flow is $248 ($3k/yr) — positive.
- The deal already cash-flows at list — no discount required.
- Meets the 1% rule at list price ($1k rent vs $80k).
- Recommended offer: $75k (6.0% below list) — sets the bar for market timing.
- Cap rate 10.0% vs local median 3.5% in Ashland — top-decile yield for the area; either an underpriced asset or a hidden risk that comps aren't pricing in. Stress-test before assuming the spread holds.
Location & tenants
- Location reads 84/100 on livability (#37 in WI, #750 nationally) — a professional / high-income tenant draw. Strengths: cost of living A+, health & safety A+, commute A; Watch: employment F.
- Ashland School District (town): math 16% / reading 30% proficiency, ranked #325 of 342 in WI (top 95%) — low school quality limits family demand, transient renter base, plan for 1-2y turnover.
- Zoned schools: Lake Superior Elementary (math 17% / reading 25%, grade F, #857 of 1,041 statewide, top 83%, 603 students, 61% FRL); Ashland Middle (math 15% / reading 33%, grade F, #325 of 383 statewide, top 85%, 398 students, 61% FRL); Ashland High (math 12% / reading 22%, grade F, #400 of 483 statewide, top 85%, 626 students, 56% FRL).
- Market conditions: 87 active listings in the ZIP; 30 units permitted in Ashland County in 2024 (0 in 5+ unit buildings).
Forward outlook
- Local home prices are declining (-3.0%/yr); year-one equity from $552 of loan paydown is wiped out by about $2k of value loss. Plan a longer hold.
- Ashland County population projected at -22% by 2050 — secular population decline; favor cash flow + early exit over multi-decade hold.
- At projected returns (-3.0% appreciation + 3.0% rent growth), your $22k cash investment doubles in ~9 years — after that, you're playing with house money.
Negotiation context
- It's been on market 68 days — a 6% lower offer ($75k) is reasonable based on typical stale-listing flexibility.
- 2 sale attempts with the ask held roughly flat each time — persistent listings suggest the price (not the market) is what's stuck; bring a comps-based counter.
Risks & watch-outs
- Watch-outs: built in 1900 — expect roof / HVAC / electrical / plumbing capex.
Questions for the listing agent
- It's been on market 68 days. Have you received any prior offers? Is the seller open to a 6% concession, seller financing, or rate buy-down credit?
- Built in 1900 — when were the roof, HVAC, electrical panel, plumbing, and water heater last replaced?
- Why hasn't it sold? Are there any deal-killer items the seller is aware of (foundation, flood, title, zoning, code violations)?
- Is there a deadline driving the sale (1031 exchange, divorce, estate, relocation)? That informs how much negotiation room exists.
- What's the average days-on-market for RENTAL listings here right now (not sales)? A rising rental-DOM trend means longer vacancies and softer asking-rent achievability than the comps imply.
- What's the recent tenant-quality profile in this submarket — average credit score on applications, eviction rate, late-payment / NSF rate, and stable-employment percentage? A property-management company in the area should have these aggregated.
- How much new for-sale + rental construction is in the pipeline within 1–3 miles? Heavy new supply typically softens prices + rents 12–24 months out; constrained supply supports both.
Investment metrics
- 1% rule
- 1.33% ✓
- Cap rate
- 10.02%
- Cash-on-cash
- 13.30%
- DSCR
- 1.59
- GRM
- 6.3
CMA / ARV
No comps found within radius.
Projected returns pro-forma
-3.0% appreciation · 3.0% rent growth · sell at horizon
- IRR
- 3.3%
- Equity multiple
- 1.13×
- Total profit
- $2,878
- Equity at exit
- $11,913
- IRR
- 12.9%
- Equity multiple
- 2.03×
- Total profit
- $22,991
- Equity at exit
- $6,908
Cash invested: $22,372 (down + closing). Projections, not guarantees.
Landlord ↔ Tenant lean methodology
- Overall (STATE)
- 73 Landlord-Friendly
- State Wisconsin
- 73 Landlord-Friendly · R+2
- County
- — inherits STATE
- City
- — inherits STATE
ZIP-level market 54806
- Active inventory
- 87
- Price-to-rent
- 6.3×
Monthly cashflow live
- Estimated rent
- $1,059 medium interval (Pro) →
- Mortgage (P&I)
- −$419
- Tax from tax record
- −$137 /mo · $1,642/yr
- Insurance
- −$33
- HOA
- −$0
- Vacancy / Maint / Mgmt
- −$222
- Net cashflow
- $248
Break-even live
Sensitivity live
| Price | -10% $293 | -5% $270 | +0% $248 | +5% $225 | +10% $203 |
|---|---|---|---|---|---|
| Rent | -10% $164 | -5% $206 | +0% $248 | +5% $290 | +10% $332 |
| Rate | -1.0pp $288 | -0.5pp $268 | base $248 | +0.5pp $227 | +1.0pp $206 |
UW: 25.0% down · 7.5% · 30yr · 1.5% tax · 5.0% vac · 8.0% maint · 8.0% mgmt
Financing live
Cash to close
- Down payment
- $19,975
- Closing costs
- $2,397
- Reserves months
- —
- Total cash needed
- —
Loan-product check · same deal, 3 products live
Conventional
25% down · 7.5% · 30yr
- Down + closing
- —
- Monthly P&I
- —
- Monthly cashflow
- —
- DSCR
- —
- Eligible?
- —
Personal DTI + credit; lowest rate.
DSCR
20% down · 8.5% · 30yr
- Down + closing
- —
- Monthly P&I
- —
- Monthly cashflow
- —
- DSCR
- —
- Eligible?
- —
No personal income docs; deal must DSCR.
Hard money
10% down · 12.0% · 12mo
- Down + closing
- —
- Monthly P&I
- —
- Monthly cashflow
- —
- DSCR
- —
- Eligible?
- —
Short-term bridge; refi at stabilization.
Listing history 20 events
-
2026-06-21days on market $79,900 Active 68 DOM
-
2026-06-21days on market $79,900 Active 67 DOM
-
2026-06-18days on market $79,900 Active 65 DOM
-
2026-06-17days on market $79,900 Active 64 DOM
-
2026-06-16days on market $79,900 Active 63 DOM
-
2026-06-15days on market $79,900 Active 62 DOM
-
2026-06-15days on market $79,900 Active 61 DOM
-
2026-06-13days on market $79,900 Active 60 DOM
-
2026-06-12days on market $79,900 Active 59 DOM
-
2026-06-09days on market $79,900 Active 56 DOM
-
2026-06-08days on market $79,900 Active 55 DOM
-
2026-06-08days on market $79,900 Active 54 DOM
-
2026-06-07days on market $79,900 Active 53 DOM
-
2026-06-03days on market $79,900 Active 50 DOM
-
2026-06-02days on market $79,900 Active 49 DOM
-
2026-06-01days on market $79,900 Active 48 DOM
-
2026-05-31days on market $79,900 Active 47 DOM
-
2026-04-15$79,900 Active
-
2026-04-11$79,900 Active
-
2026-04-11historical $79,900
ⓘ Source: listings_history table (triggers on properties + properties_extension) + one-shot
backfill from property_details.listing_events for pre-trigger history.
Tax reassessment forecast WI · Partial reset (capped growth)
- Current annual tax
- $1,642 · $137/mo
- Projected year-2 tax
- $1,642 · $137/mo
- Expected delta
- $0/yr ($0/mo · 0.0%)
ⓘ Screening estimate from a state-policy table — verify with the county assessor before closing.
Climate risk First Street
- Flood 1/10 Low FEMA zone X · 0% chance over 30 yrs
- Wildfire 1/10 Low
- Heat 1/10 Low 7 d/yr ≥92°F today · 13 d/yr by 30 yrs out
- Wind 1/10 Low
- Air quality 1/10 Low 0 unhealthy d/yr today · 0 by 30 yrs out
Nearby sold comps map
Loading sold comps map…
Walkable amenities ~0.75 mi
Loading nearby amenities…
Taxation est. · year 1
- Rental income
- $12,713
- − Mortgage interest
- −$4,476
- − Property taxes
- −$1,642
- − Insurance
- −$400
- − Repairs & maintenance
- −$1,017
- − Management
- −$1,017
- − Depreciation
- −$2,324
- Taxable income
- $1,838
- Est. tax owed @ 24.0%
- −$441
- After-tax cash flow
- $2,533/yr
For passive investors: Depreciation is non-cash, so a rental often shows a tax loss while cash-flowing — sheltering income. Rental losses are passive: they offset passive income freely, and up to $25,000/yr can offset ordinary (W-2) income if you actively participate and your MAGI is under $100k (phasing out to $0 by $150k); unused losses carry forward. On sale, claimed depreciation is recaptured at up to 25%, and gains may owe capital-gains tax (a 1031 exchange can defer both). Figures are a year-1 estimate at your 24.0% rate — not tax advice; consult a CPA.
Schools (NCES district)
- District
- Ashland School District
- NCES district ID
- 5500510
- Math proficiency
- 16% ▼ -16.00%
- Reading proficiency
- 30% ▼ -4.00%
- Median HH income
- $40,114
- Composite
- 19.4/100
- National rank
- #8782
- State rank
- #325 of 342 in WI
Livability — Ashland
- Score
- 84/100
- State rank
- #37
- US rank
- #750
Category grades
Schools grade is shown separately in the Schools card above.
Census & demographics
- Census place
- Ashland, WI
- Population (ZIP)
- 11,708
Population outlook (Ashland County) Hauer SSP2
- Today (2025)
- 15,204 people
- By 2030
- 14,639 · -3.7%
- By 2040
- 13,198 · -13.2%
- By 2050
- 11,841 · -22.1%
- By 2075
- 9,755 · -35.8%
- By 2100
- 8,675 · -42.9%
Race, ethnicity, and origin ACS 2023
- Neighborhood character
- Predominantly White (81%)
- Race & ethnicity
- White 81% Native American 9% Two or more races 6% Hispanic / Latino 4%
- Common ancestry
- Romanian 8% Portuguese 6% Lithuanian 2%
- Foreign-born
- 2% · Canada
- Languages at home
- 96% English-only · Spanish 1% Other Indo-European 1%
Political lean MEDSL · Ashland
- 2024 margin
- Toss-up / Even · D 51.6% · R 46.9% · Other 1.5%
- 2008→2024 swing
- -32.4pp toward R · 2008: 37.1pp · 2024: 4.7pp
- All cycles
- 2024: D+4.7 2020: D+11.0 2016: D+8.9 2012: D+30.8 2008: D+37.1
Not yet ingested
- Civics
- —
Market trends
- HPI YoY
- ▼ -142.11%
- Current HPI
- 168.3012
- Rent YoY
- —
- Metro
- —
- State GDP YoY
- ▲ 2.10%
- F500 in state
- 20
Industry mix (Fortune 500 HQ in WI)
| Industry | F500 HQs | Revenue |
|---|---|---|
| Industrial Machinery | 4 | $23B |
|
||
| Industrial Technology | 2 | $36B |
|
||
| Insurance | 1 | $36B |
|
||
| Professional Services | 1 | $19B |
|
||
| Utilities | 1 | $9B |
|
||
| Consumer Goods | 1 | $3B |
|
||
Price history
+0.0% since first listed3 events — show timeline
- 2026-04-15 Listed $79,900 SAAR
- 2026-04-11 Listed $79,900 LSAR
- 2026-04-11 Coming Soon $79,900 SAAR
Property tax history
+3.3%/yrLatest (2025): $1,642 · +8.4% YoY. Source: county tax records.
Cash-flow waterfall
monthlySold comps — $/sqft
last 12 mo · ≤1 miLoading sold comps…