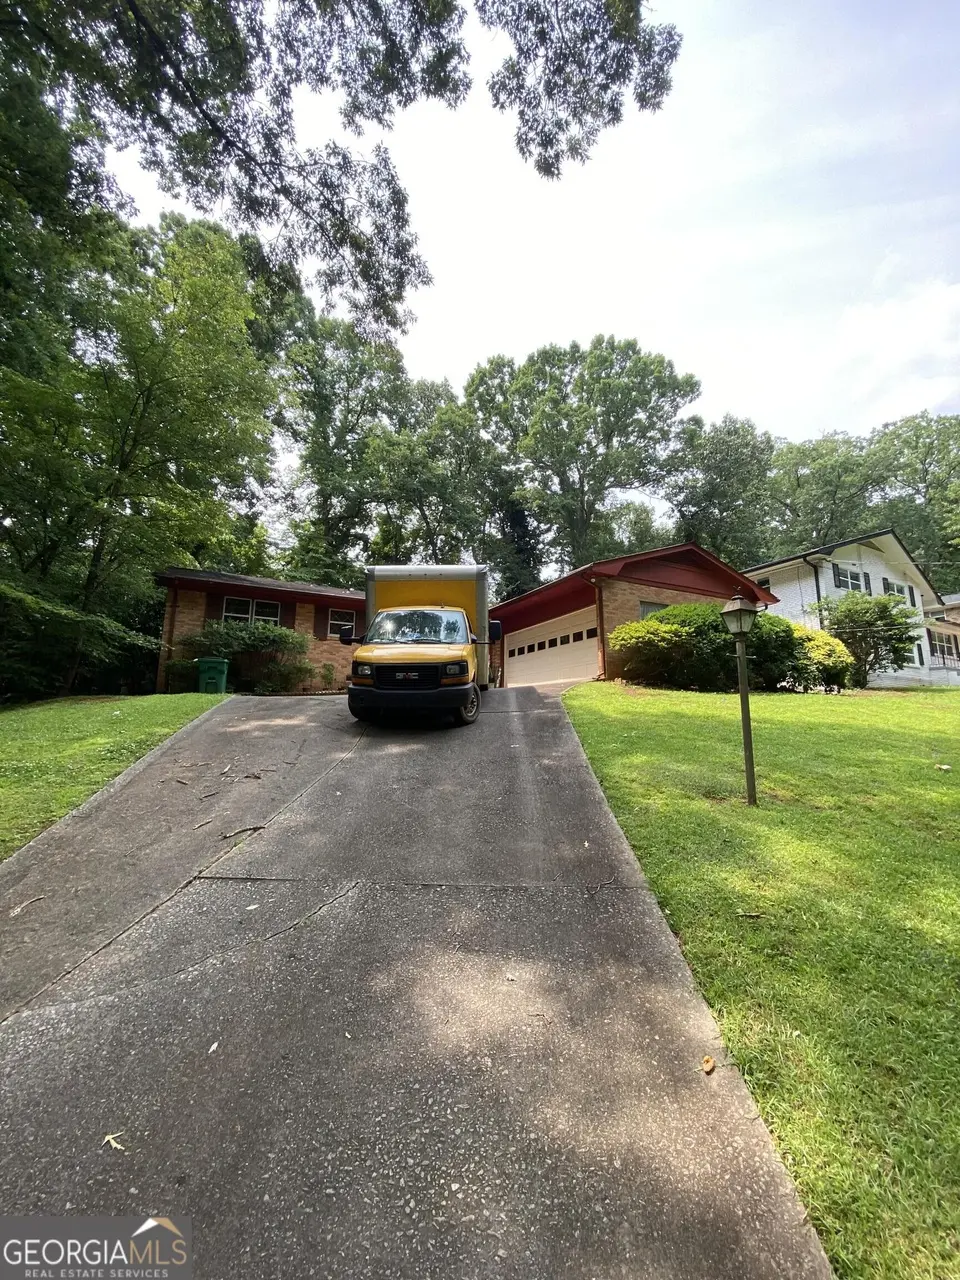
2464 Glenrock Dr · Candler-McAfee, GA
Flood risk 1/10 · Minimal
- FEMA flood zone
- X (unshaded)
- Chance of flooding over 30 yrs
- 0.0%
- Est. flood insurance / yr
- $507 – $1,088
Fire risk 1/10 · Minimal
- Est. fire insurance / yr
- $963 – $1,789
Heat risk 5/10 · Moderate
- Hot days now (above 105°F)
- 7 days/yr
- Hot days in 30 yrs
- 18 days/yr
Wind risk 5/10 · Moderate
- Chance of severe wind over 30 yrs
- 26.0%
Air-quality risk 5/10 · Moderate
- Unhealthy air days now
- 6 days/yr
- Unhealthy air days in 30 yrs
- 8 days/yr
Risk factors via First Street. Map © Google.
Why this score? — see what drove the C- grade
The composite is a weighted blend of 9 inputs, each scored 0–100. Each bar is that input's sub-score; the figure is the points it added to the 100-point composite (weight × sub-score).
- Cash flow +16.7/30.0
- ARV discount +15.0/15.0
- DSCR +5.2/10.0
- 1% rule +3.3/10.0
- Rent growth +2.8/5.0
- Livability +2.5/5.0
- Condition / age +2.5/5.0
- Schools +2.1/10.0
- Appreciation +0.0/10.0
$225,000
🖨 Deal sheet (PDF) 📄 Offer letter ✓ Due diligence
Listing remarks MLS
Value-add opportunity in Decatur! This 3BR/2BA home sits on a spacious lot in an established neighborhood and has a solid foundation and strong structural bones. Property needs repairs and updates, offering a great opportunity for investors or buyers looking to renovate and build equity. Functional layout with generous living space and strong potential to modernize. Convenient location near shopping, dining, and major routes. Sold AS-IS.
Key facts
- Solid foundation
- Spacious lot
- Functional layout
Tags
Neighborhood map
What this means for you Summary
Snapshot
- This is a 3-bed/2.0-bath single-family listed at $225k.
Deal economics
- At list price, monthly cash flow is $141 ($2k/yr) — positive.
- The deal already cash-flows at list — no discount required.
- To meet the 1% rule (rent ≥ 1% of price), the offer needs to be $186k (17.1% below list).
- Recommended offer: $186k (17.1% below list) — sets the bar for 1% rule.
- Cap rate 7.0% vs local median 4.2% in Candler-McAfee — top-decile yield for the area; either an underpriced asset or a hidden risk that comps aren't pricing in. Stress-test before assuming the spread holds.
Location & tenants
- Location reads: area grade C — affects rentability + tenant quality, not the cash-flow math above.
- Dekalb County (suburban): math 19% / reading 28% proficiency, ranked #125 of 174 in GA (top 72%) — low school quality limits family demand, transient renter base, plan for 1-2y turnover; 68% free/reduced lunch — lower-income household profile, screen leases tightly.
- Market conditions: Rents rising (+1.3%/yr); 431 active listings in the ZIP; 40 comparable units currently listed for rent nearby; rentals at typical pace (median 22d on market — plan ~3-4 weeks tenant-placement turnaround); 1,240 units permitted in DeKalb County in 2024 (385 in 5+ unit buildings).
- This rent runs 36% of the median local income ($63k/yr) — at the standard rent-burdened threshold; future hikes will face affordability resistance.
Forward outlook
- Local home prices are declining (-3.0%/yr); year-one equity from $2k of loan paydown is wiped out by about $7k of value loss. Plan a longer hold.
- DeKalb County population projected at +28% by 2050 — long-run rental-demand tailwind backs the buy-and-hold thesis.
Negotiation context
- It's been on market 161 days — a 12% lower offer ($198k) is reasonable based on typical stale-listing flexibility.
- 2 sale attempts with the ask held roughly flat each time — persistent listings suggest the price (not the market) is what's stuck; bring a comps-based counter.
- Current owner paid $104k; list at $225k implies a 116% gain — meaningful room to come down on a strong offer.
Risks & watch-outs
- Climate carrying-cost: moderate wind risk, 26% chance of damaging wind over 30y; extreme-heat days projected 7→18/yr by 2055 (HVAC capex compounding) — expect insurance premiums to compound above CPI over the hold.
Questions for the listing agent
- It's been on market 161 days. Have you received any prior offers? Is the seller open to a 17% concession, seller financing, or rate buy-down credit?
- Built in 1963 — when were the roof, HVAC, electrical panel, plumbing, and water heater last replaced?
- Why hasn't it sold? Are there any deal-killer items the seller is aware of (foundation, flood, title, zoning, code violations)?
- Is there a deadline driving the sale (1031 exchange, divorce, estate, relocation)? That informs how much negotiation room exists.
- What's the average days-on-market for RENTAL listings here right now (not sales)? A rising rental-DOM trend means longer vacancies and softer asking-rent achievability than the comps imply.
- What's the recent tenant-quality profile in this submarket — average credit score on applications, eviction rate, late-payment / NSF rate, and stable-employment percentage? A property-management company in the area should have these aggregated.
- How much new for-sale + rental construction is in the pipeline within 1–3 miles? Heavy new supply typically softens prices + rents 12–24 months out; constrained supply supports both.
Investment metrics
- 1% rule
- 0.83% ✗
- Cap rate
- 7.05%
- Cash-on-cash
- 2.69%
- DSCR
- 1.12
- GRM
- 10.1
CMA / ARV
- ARV (median comp)
- $328,743
- List price
- $225,000
- Delta
- -31.56%
- Verdict
- UNDERPRICED
- Comps
- 20 within 1.0 mi
Show comp detail 12 sales within ~0.75 mi
| Address | Dist | Beds/Ba | Sqft | Sold | Price | $/sf | Match |
|---|---|---|---|---|---|---|---|
| 3133 Columbia Woods Dr | 0.11mi | 4/2.0 (+1) | 1,876 (+4%) | 2mo | $340,000 | $181 | 82 |
| 3222 Edgemont Way | 0.11mi | 3/2.0 | 1,943 (+7%) | 10mo | $346,000 | $178 | 74 |
| 3128 Columbia Woods Dr | 0.13mi | 4/2.5 (+1) | 1,950 (+8%) | 9mo | $340,000 | $174 | 66 |
| 2545 Glenrock Dr | 0.20mi | 3/2.0 | 1,592 (-12%) | 7mo | $295,000 | $185 | 65 |
| 2550 Miriam Ln | 0.54mi | 3/3.0 | 1,894 (+5%) | 0mo | $399,000 | $211 | 63 |
| 2282 Green Forrest Dr | 0.36mi | 4/2.0 (+1) | 1,700 (-6%) | 7mo | $165,000 | $97 | 62 |
| 3349 Toney Dr #2 | 0.30mi | 4/2.0 (+1) | 2,011 (+11%) | 7mo | $180,000 | $90 | 56 |
| 3349 Toney Dr | 0.30mi | 4/3.0 (+1) | 2,011 (+11%) | 3mo | $375,000 | $186 | 56 |
| 2330 Green Forrest Dr | 0.34mi | 4/3.0 (+1) | 1,616 (-11%) | 6mo | $399,900 | $247 | 53 |
| 2982 Toney Dr | 0.68mi | 3/2.0 | 1,614 (-11%) | 2mo | $360,000 | $223 | 49 |
| 2311 Springside Ln | 0.69mi | 3/2.0 | 2,074 (+15%) | 2mo | $365,000 | $176 | 42 |
| 2628 Miriam Ln | 0.70mi | 4/2.0 (+1) | 1,971 (+9%) | 10mo | $237,000 | $120 | 39 |
Match score weights: distance 35% · size 25% · config 20% · recency 20%. Top-matched comps best support the ARV.
Projected returns pro-forma
-3.0% appreciation · 1.34% rent growth · sell at horizon
- IRR
- -13.7%
- Equity multiple
- 0.51×
- Total profit
- $-30,647
- Equity at exit
- $33,548
- IRR
- -7.4%
- Equity multiple
- 0.56×
- Total profit
- $-27,719
- Equity at exit
- $19,454
Cash invested: $63,000 (down + closing). Projections, not guarantees.
Landlord ↔ Tenant lean methodology
- Overall (STATE)
- 90 Strongly Landlord-Friendly
- State Georgia
- 90 Strongly Landlord-Friendly · R+3
- County
- — inherits STATE
- City
- — inherits STATE
ZIP-level market 30032
- Rents YoY
- 1.3%
- Active inventory
- 431
- Price-to-rent
- 10.1×
Monthly cashflow live
- Estimated rent
- $1,865 high interval (Pro) →
- Mortgage (P&I)
- −$1,180
- Tax from tax record
- −$58 /mo · $702/yr
- Insurance
- −$94
- HOA
- −$0
- Vacancy / Maint / Mgmt
- −$392
- Net cashflow
- $141
Break-even live
Sensitivity live
| Price | -10% $268 | -5% $205 | +0% $141 | +5% $77 | +10% $14 |
|---|---|---|---|---|---|
| Rent | -10% $-6 | -5% $67 | +0% $141 | +5% $215 | +10% $288 |
| Rate | -1.0pp $254 | -0.5pp $198 | base $141 | +0.5pp $83 | +1.0pp $23 |
UW: 25.0% down · 7.5% · 30yr · 1.5% tax · 5.0% vac · 8.0% maint · 8.0% mgmt
Financing live
Cash to close
- Down payment
- $56,250
- Closing costs
- $6,750
- Reserves months
- —
- Total cash needed
- —
Loan-product check · same deal, 3 products live
Conventional
25% down · 7.5% · 30yr
- Down + closing
- —
- Monthly P&I
- —
- Monthly cashflow
- —
- DSCR
- —
- Eligible?
- —
Personal DTI + credit; lowest rate.
DSCR
20% down · 8.5% · 30yr
- Down + closing
- —
- Monthly P&I
- —
- Monthly cashflow
- —
- DSCR
- —
- Eligible?
- —
No personal income docs; deal must DSCR.
Hard money
10% down · 12.0% · 12mo
- Down + closing
- —
- Monthly P&I
- —
- Monthly cashflow
- —
- DSCR
- —
- Eligible?
- —
Short-term bridge; refi at stabilization.
Rent comps 40 comps
| Address | Beds | Baths | Sqft | Rent | $/sqft | DOM | Units | Dist |
|---|---|---|---|---|---|---|---|---|
| 2336 Columbia Woods Ct Decatur, GA | 4.0 | 2.0 | 1950 | $1,970 | $1.01 | 44d | 1 | 0.27mi |
| 3293 Abbeywood Dr Decatur, GA | 3.0 | 2.0 | 1455 | $1,650 | $1.13 | 5d | 1 | 0.37mi |
| 3184 Gay Dr Decatur, GA | 4.0 | 2.0 | 2000 | $2,050 | $1.02 | 0d | 1 | 0.43mi |
| 2223 Shamrock Dr Decatur, GA | 4.0 | 2.5 | 1977 | $2,100 | $1.06 | 0d | 1 | 0.51mi |
| 2579 Charleston Ter Decatur, GA | 3.0 | 2.5 | 1866 | $2,095 | $1.12 | 6d | 1 | 0.52mi |
| 2892 Eastwyck Cir Decatur, GA | 1.0–4.0 | 1.0–2.0 | 1114 | $1,393 | $1.25 | 25d | 1 | 0.58mi |
| 3444 Sumter Pl Decatur, GA | 3.0 | 2.5 | 1684 | $1,995 | $1.18 | 45d | 1 | 0.59mi |
| 3393 Woods Dr Decatur, GA | 3.0 | 2.0 | 1598 | $1,901 | $1.19 | 0d | 1 | 0.62mi |
| 2929 Da Vinci Blvd Decatur, GA | 3.0 | 2.5 | 2427 | $2,300 | $0.95 | 44d | 1 | 0.64mi |
| 2381 Charleston Ter Decatur, GA | 3.0 | 2.5 | 2130 | $2,125 | $1.00 | 5d | 1 | 0.73mi |
| 3525 Oregon Trl Decatur, GA | 3.0 | 2.0 | 1296 | $1,825 | $1.41 | 13d | 1 | 0.92mi |
| 3409 Hyland Dr Decatur, GA | 3.0 | 2.0 | 1454 | $1,990 | $1.37 | 44d | 1 | 0.98mi |
| 3229 McAfee Rd Decatur, GA | 3.0 | 1.0 | 1300 | $1,600 | $1.23 | 44d | 1 | 0.98mi |
| 3415 Hyland Dr Decatur, GA | 3.0 | 2.0 | 1454 | $1,895 | $1.30 | 21d | 1 | 0.99mi |
| 3443 Hyland Dr Decatur, GA | 3.0 | 2.0 | 1284 | $2,000 | $1.56 | 44d | 1 | 1.03mi |
| 3100 Lumby Dr Decatur, GA | 1.0–3.0 | 1.0–2.0 | 1057 | $1,808 | $1.71 | 0d | 27 | 1.10mi |
| 1978 Glendale Dr Decatur, GA | 3.0 | 2.0 | 1425 | $1,000 | $0.70 | 25d | 1 | 1.12mi |
| 2013 Yucca Dr Decatur, GA | 3.0 | 2.0 | 2500 | $1,650 | $0.66 | 44d | 1 | 1.13mi |
| 2815 Rainbow Forest Dr Decatur, GA | 3.0 | 2.0 | 1762 | $1,000 | $0.57 | 0d | 1 | 1.14mi |
| 2813 Rainbow Forest Dr Decatur, GA | 3.0 | 2.0 | 1792 | $1,650 | $0.92 | 18d | 1 | 1.14mi |
| 100 Lumby Ct Decatur, GA | 1.0–3.0 | 1.0–2.0 | 1150 | $1,899 | $1.65 | 3d | 11 | 1.14mi |
| 3563 Newberry Trl Unit A11 Decatur, GA | 3.0 | 2.5 | 1980 | $1,940 | $0.98 | 44d | 1 | 1.15mi |
| 3466 Newberry Trl Decatur, GA | 3.0 | 2.5 | 1908 | $1,540 | $0.81 | 12d | 1 | 1.16mi |
| 3467 Newberry Trl Decatur, GA | 3.0 | 2.5 | 1908 | $1,000 | $0.52 | 21d | 1 | 1.19mi |
| 1932 Rosewood Rd Decatur, GA | 4.0 | 2.5 | 1294 | $1,120 | $0.87 | 25d | 1 | 1.19mi |
| 2410 Lafortune Dr Decatur, GA | 3.0 | 2.0 | 2115 | $1,973 | $0.93 | 44d | 1 | 1.24mi |
| 2112 Royal Fox Way Decatur, GA | 4.0 | 2.0 | 1518 | $2,049 | $1.35 | 44d | 1 | 1.26mi |
| 2741 Williamsburg Dr Decatur, GA | 4.0 | 1.5 | 1508 | $1,695 | $1.12 | 44d | 1 | 1.31mi |
| 1873 Shamrock Dr Decatur, GA | 4.0 | 1.5 | 1492 | $1,075 | $0.72 | 6d | 1 | 1.33mi |
| 1855 Shamrock Dr Decatur, GA | 3.0 | 2.0 | 1310 | $1,771 | $1.35 | 6d | 1 | 1.37mi |
| 3800 Flat Shoals Pkwy Decatur, GA | 2.0–3.0 | 1.5–2.5 | 1370 | $1,711 | $1.25 | 3d | 51 | 1.40mi |
| 3917 Leprechaun Ct Decatur, GA | 4.0 | 2.0 | 2463 | $2,280 | $0.93 | 13d | 1 | 1.42mi |
| 2840 Vining Ridge Ter Unit 1 Decatur, GA | 3.0 | 2.5 | 1433 | $1,425 | $0.99 | 0d | 1 | 1.43mi |
| 2840 Vining Ridge Ter Unit 1 Decatur, GA | 3.0 | 2.5 | 1433 | $1,425 | $0.99 | 4d | 1 | 1.43mi |
| 3379 Flat Shoals Rd Decatur, GA | 2.0 | 2.5 | 1230 | $1,512 | $1.23 | 3d | 9 | 1.45mi |
| 2868 Vining Ridge Ter Decatur, GA | 2.0 | 2.5 | 1528 | $1,499 | $0.98 | 19d | 1 | 1.46mi |
| 3188 Panthers Trce Decatur, GA | 2.0 | 3.0 | 1350 | $1,495 | $1.11 | 44d | 1 | 1.47mi |
| 3162 Panthers Trce Decatur, GA | 3.0 | 2.5 | 1434 | $1,700 | $1.19 | 44d | 1 | 1.47mi |
| 2805 Vining Ridge Ter Decatur, GA | 3.0 | 2.5 | 1664 | $1,600 | $0.96 | 44d | 1 | 1.48mi |
| 3315 Flat Shoals Rd Decatur, GA | 3.0 | 2.0 | 1765 | $1,950 | $1.10 | 44d | 1 | 1.49mi |
Listing history 18 events
-
2026-06-21days on market $225,000 Active 161 DOM
-
2026-06-18days on market $225,000 Active 158 DOM
-
2026-06-17days on market $225,000 Active 157 DOM
-
2026-06-16days on market $225,000 Active 156 DOM
-
2026-06-15days on market $225,000 Active 155 DOM
-
2026-06-13days on market $225,000 Active 153 DOM
-
2026-06-09days on market $225,000 Active 149 DOM
-
2026-06-08days on market $225,000 Active 148 DOM
-
2026-06-07days on market $225,000 Active 147 DOM
-
2026-06-04days on market $225,000 Active 144 DOM
-
2026-06-03days on market $225,000 Active 143 DOM
-
2026-06-02days on market $225,000 Active 142 DOM
-
2026-06-01days on market $225,000 Active 141 DOM
-
2026-05-31days on market $225,000 Active 140 DOM
-
2026-02-05status Back On Market 441-char remark
Show marketing remark (441 chars)
Value-add opportunity in Decatur! This 3BR/2BA home sits on a spacious lot in an established neighborhood and has a solid foundation and strong structural bones. Property needs repairs and updates, offering a great opportunity for investors or buyers looking to renovate and build equity. Functional layout with generous living space and strong potential to modernize. Convenient location near shopping, dining, and major routes. Sold AS-IS.
-
2026-02-03historical 441-char remark
Show marketing remark (441 chars)
Value-add opportunity in Decatur! This 3BR/2BA home sits on a spacious lot in an established neighborhood and has a solid foundation and strong structural bones. Property needs repairs and updates, offering a great opportunity for investors or buyers looking to renovate and build equity. Functional layout with generous living space and strong potential to modernize. Convenient location near shopping, dining, and major routes. Sold AS-IS.
-
2026-01-09$225,000 New 441-char remark
Show marketing remark (441 chars)
Value-add opportunity in Decatur! This 3BR/2BA home sits on a spacious lot in an established neighborhood and has a solid foundation and strong structural bones. Property needs repairs and updates, offering a great opportunity for investors or buyers looking to renovate and build equity. Functional layout with generous living space and strong potential to modernize. Convenient location near shopping, dining, and major routes. Sold AS-IS.
-
1999-11-01soldstatus $104,000
ⓘ Source: listings_history table (triggers on properties + properties_extension) + one-shot
backfill from property_details.listing_events for pre-trigger history.
Tax reassessment forecast GA · Resets to sale price
- Current annual tax
- $702 · $58/mo
- Projected year-2 tax
- $2,070 · $172/mo
- Expected delta
- +$1,368/yr (+$114/mo · 195.0%)
ⓘ Screening estimate from a state-policy table — verify with the county assessor before closing.
Climate risk First Street
- Flood 1/10 Low FEMA zone X (unshaded) · 0% chance over 30 yrs
- Wildfire 1/10 Low
- Heat 5/10 Major 7 d/yr ≥105°F today · 18 d/yr by 30 yrs out
- Wind 5/10 Major 26% chance of damaging wind over 30 yrs
- Air quality 5/10 Major 6 unhealthy d/yr today · 8 by 30 yrs out
Nearby sold comps map
Loading sold comps map…
Walkable amenities ~0.75 mi
Loading nearby amenities…
Taxation est. · year 1
- Rental income
- $22,378
- − Mortgage interest
- −$12,603
- − Property taxes
- −$702
- − Insurance
- −$1,125
- − Repairs & maintenance
- −$1,790
- − Management
- −$1,790
- − Depreciation
- −$6,545
- Taxable loss
- −$2,178
- Est. tax savings @ 24.0%
- +$523
- After-tax cash flow
- $2,216/yr
For passive investors: Depreciation is non-cash, so a rental often shows a tax loss while cash-flowing — sheltering income. Rental losses are passive: they offset passive income freely, and up to $25,000/yr can offset ordinary (W-2) income if you actively participate and your MAGI is under $100k (phasing out to $0 by $150k); unused losses carry forward. On sale, claimed depreciation is recaptured at up to 25%, and gains may owe capital-gains tax (a 1031 exchange can defer both). Figures are a year-1 estimate at your 24.0% rate — not tax advice; consult a CPA.
Schools (NCES district)
- District
- Dekalb County
- NCES district ID
- 1301740
- Math proficiency
- 19% ▼ -12.00%
- Reading proficiency
- 28% ▼ -7.00%
- Median HH income
- $51,448
- Composite
- 20.92/100
- National rank
- #8482
- State rank
- #125 of 174 in GA
Livability — Candler-McAfee
No livability data for this city. (Only ~50 U.S. cities are tracked.)
Census & demographics
- Census place
- Candler-McAfee, GA
- County
- Dekalb County · 782,738 people
- City population
- 42,812
- Metro
- Atlanta-Sandy Springs-Alpharetta, GA
- Population (ZIP)
- 42,948
- Household income
- $62,765
- Rent vs Own
- Severe rent burden
- 2097.0
Population outlook (DeKalb County) Hauer SSP2
- Today (2025)
- 839,977 people
- By 2030
- 891,768 · +6.2%
- By 2040
- 988,894 · +17.7%
- By 2050
- 1,074,583 · +27.9%
- By 2075
- 1,245,026 · +48.2%
- By 2100
- 1,303,135 · +55.1%
Race, ethnicity, and origin ACS 2023
- Neighborhood character
- Predominantly Black (70%)
- Race & ethnicity
- Black 70% White 18% Two or more races 6% Hispanic / Latino 5% Asian 2%
- Hispanic origin (detail)
- Mexican 2%
- Common ancestry
- Slovak 1% Italian 1% Serbian 1%
- Foreign-born
- 7% · Canada, China, Guatemala
- Languages at home
- 91% English-only · Spanish 4% Arabic 1% Other Indo-European 0%
Political lean MEDSL · DeKalb
- 2024 margin
- Solid D (+64.8) · D 81.9% · R 17.1% · Other 1.0%
- 2008→2024 swing
- +6.1pp toward D · 2008: 58.6pp · 2024: 64.8pp
- All cycles
- 2024: D+64.8 2020: D+67.4 2016: D+64.8 2012: D+56.8 2008: D+58.6
Not yet ingested
- Civics
- —
Market trends
- HPI YoY
- ▼ -203.83%
- Current HPI
- 221.0467
- Rent YoY
- ▲ 1.34%
- Metro
- Atlanta-Sandy Springs-Alpharetta, GA
- State GDP YoY
- ▲ 2.66%
- F500 in state
- 28
Industry mix (Fortune 500 HQ in GA)
| Industry | F500 HQs | Revenue |
|---|---|---|
| Paper / Packaging | 2 | $29B |
|
||
| Retail | 1 | $160B |
|
||
| Transportation / Logistics | 1 | $91B |
|
||
| Airlines | 1 | $62B |
|
||
| Consumer Goods | 1 | $47B |
|
||
| Utilities | 1 | $25B |
|
||
Price history
+116.3% since first listed4 events — show timeline
- 2026-02-05 Relisted — GAMLS
- 2026-02-03 Listing Removed — GAMLS
- 2026-01-09 Listed $225,000 GAMLS
- 1999-11-01 Sold (Public Records) $104,000 Public Records
Property tax history
-2.0%/yrLatest (2025): $702 · -4.3% YoY. Source: county tax records.
Cash-flow waterfall
monthlySold comps — $/sqft
last 12 mo · ≤1 miLoading sold comps…