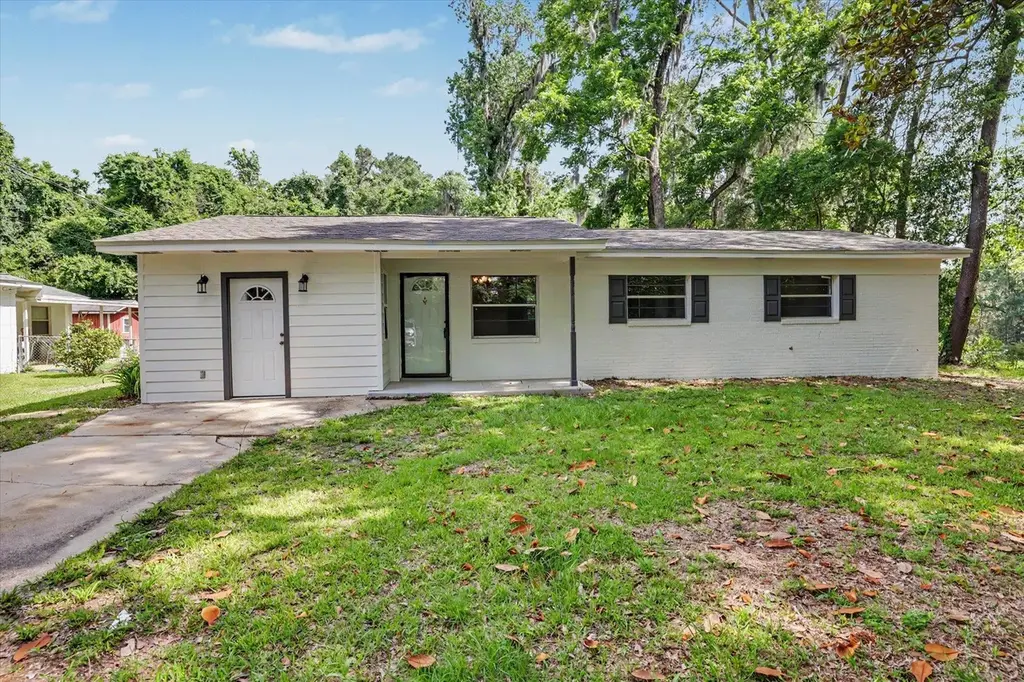
2898 Bell Dr · Tallahassee, FL
Flood risk 1/10 · Minimal
- FEMA flood zone
- X (unshaded)
- Chance of flooding over 30 yrs
- 0.0%
- Est. flood insurance / yr
- $507 – $1,088
Fire risk 4/10 · Minor
- Est. fire insurance / yr
- $947 – $1,759
Heat risk 8/10 · Major
- Hot days now (above 108°F)
- 7 days/yr
- Hot days in 30 yrs
- 20 days/yr
Wind risk 9/10 · Severe
- Chance of severe wind over 30 yrs
- 99.0%
Air-quality risk 5/10 · Moderate
- Unhealthy air days now
- 7 days/yr
- Unhealthy air days in 30 yrs
- 7 days/yr
Risk factors via First Street. Map © Google.
Why this score? — see what drove the C+ grade
The composite is a weighted blend of 9 inputs, each scored 0–100. Each bar is that input's sub-score; the figure is the points it added to the 100-point composite (weight × sub-score).
- Cash flow +23.2/30.0
- ARV discount +15.0/15.0
- DSCR +7.5/10.0
- 1% rule +4.8/10.0
- Schools +4.3/10.0
- Livability +4.3/5.0
- Rent growth +3.3/5.0
- Condition / age +2.5/5.0
- Appreciation +0.0/10.0
$255,000
🖨 Deal sheet (PDF) 📄 Offer letter ✓ Due diligence
Listing remarks
This precious home offers so much space for a large family! ??? You will love the additional mother-in-law suite along with the spacious main house. This home is full of upgrades, including new LVP flooring, new carpet, a 2025 roof, and more! The mother-in-law suite features a newer A/C and hot water heater, while the main house offers plenty of room for everyone to spread out and enjoy. Upgrades galore and space you will not be disappointed in!
Key facts
- Mother-in-law suite
- New carpet
- 2025 roof
Tags
Property features AI
Finance
- Financial info: Offered for sale
- HOA & community: Street lights in the community
Exterior
- Parking: Driveway
- Utilities: Septic tank
- Home design: Single-story; Slab foundation
- Construction: Block, concrete, and wood siding construction
- Exterior features: Covered porch; Partial fencing; Public maintained paved road
Interior
- Kitchen: Icemaker; Microwave; Oven; Range; Refrigerator
- Bedrooms: Bedroom 2; Bedroom 3; Bedroom 4
- Flooring: Carpet; Plank; Tile; Vinyl
- Bathrooms: 2 full bathrooms
- Heating & cooling: Central heating (electric); Central air conditioning (electric); Ceiling fan(s)
- Interior features: Split bedrooms; Bonus room; Office; Utility room; Living room; Family room; Dining room; Other flexible space (large)
- Laundry & utility: Utility room
Neighborhood map
What this means for you Summary
Snapshot
- This is a 4-bed/2.0-bath single-family listed at $255k.
Deal economics
- At list price, monthly cash flow is $463 ($6k/yr) — positive.
- The deal already cash-flows at list — no discount required.
- To meet the 1% rule (rent ≥ 1% of price), the offer needs to be $249k (2.2% below list).
- Recommended offer: $249k (2.2% below list) — sets the bar for 1% rule.
- Cap rate 8.5% vs local median 4.2% in Tallahassee — top-decile yield for the area; either an underpriced asset or a hidden risk that comps aren't pricing in. Stress-test before assuming the spread holds.
Location & tenants
- Location reads 86/100 on livability (#19 in FL, #429 nationally) — a professional / high-income tenant draw. Strengths: amenities A+, commute A+, health & safety A+; Watch: employment D.
- Leon (urban): math 48% / reading 53% proficiency, ranked #33 of 73 in FL (top 45%) — acceptable for families but not a draw, mixed tenant base, ~2y average lease.
- Market conditions: Rents rising (+3.1%/yr); 238 active listings in the ZIP; 3 comparable units currently listed for rent nearby; rentals at typical pace (median 22d on market — plan ~3-4 weeks tenant-placement turnaround); 1,765 units permitted in Leon County in 2024 (975 in 5+ unit buildings).
- At $2,495/mo this rent would consume 48% of the median local household income ($62k/yr) (locally 2919% of renters already pay >50% of income on rent) — very limited rent-growth headroom before tenants either downsize or default.
Forward outlook
- Local home prices are declining (-3.0%/yr); year-one equity from $2k of loan paydown is wiped out by about $8k of value loss. Plan a longer hold.
- Leon County population projected at +23% by 2050 — long-run rental-demand tailwind backs the buy-and-hold thesis.
Negotiation context
- It's been on market 18 days — a 2% lower offer ($251k) is reasonable based on typical stale-listing flexibility.
Risks & watch-outs
- Climate carrying-cost: severe wind risk, 99% chance of damaging wind over 30y; extreme-heat days projected 7→20/yr by 2055 (HVAC capex compounding) — expect insurance premiums to compound above CPI over the hold.
Questions for the listing agent
- Built in 1964 — when were the roof, HVAC, electrical panel, plumbing, and water heater last replaced?
- Is there a deadline driving the sale (1031 exchange, divorce, estate, relocation)? That informs how much negotiation room exists.
- Schools are B-rated — typically a magnet for longer-tenancy family renters. What's the average tenant stay here, and is there a school-zone premium baked into asking?
- What's the average days-on-market for RENTAL listings here right now (not sales)? A rising rental-DOM trend means longer vacancies and softer asking-rent achievability than the comps imply.
- What's the recent tenant-quality profile in this submarket — average credit score on applications, eviction rate, late-payment / NSF rate, and stable-employment percentage? A property-management company in the area should have these aggregated.
- How much new for-sale + rental construction is in the pipeline within 1–3 miles? Heavy new supply typically softens prices + rents 12–24 months out; constrained supply supports both.
Investment metrics
- 1% rule
- 0.98% ✗
- Cap rate
- 8.47%
- Cash-on-cash
- 7.79%
- DSCR
- 1.35
- GRM
- 8.5
CMA / ARV
- ARV (on-the-fly)
- $348,600
- Comps found
- 12
Show comp detail 12 sales within ~0.75 mi
| Address | Dist | Beds/Ba | Sqft | Sold | Price | $/sf | Match |
|---|---|---|---|---|---|---|---|
| 2501 Hastings Dr | 0.43mi | 4/2.0 | 2,004 (+1%) | 2mo | $369,800 | $185 | 78 |
| 4127 Zermatt Dr | 0.28mi | 4/2.0 | 1,792 (-10%) | 3mo | $341,500 | $191 | 68 |
| 1928 Harriet Dr | 0.72mi | 4/2.0 | 1,985 (-0%) | 4mo | $352,000 | $177 | 62 |
| 2723 Lucerne | 0.30mi | 3/2.5 (-1) | 2,074 (+4%) | 12mo | $292,000 | $141 | 62 |
| 4124 Zermatt Dr | 0.25mi | 3/2.0 (-1) | 1,798 (-10%) | 12mo | $315,000 | $175 | 57 |
| 2002 Cynthia Dr | 0.50mi | 3/2.0 (-1) | 2,245 (+13%) | 3mo | $350,000 | $156 | 48 |
| 2005 Casa Linda Ct | 0.73mi | 3/2.0 (-1) | 1,812 (-9%) | 2mo | $255,000 | $141 | 45 |
| 2035 Wildridge Dr | 0.37mi | 4/2.0 | 2,240 (+12%) | 21mo | $335,000 | $150 | 44 |
| 1945 Harriet Dr | 0.73mi | 3/2.0 (-1) | 2,046 (+3%) | 16mo | $309,000 | $151 | 43 |
| 4493 Andrew Jackson Way | 0.46mi | 4/3.0 | 2,267 (+14%) | 22mo | $385,000 | $170 | 33 |
| 2620 Fenwood Ct | 0.72mi | 3/2.5 (-1) | 1,791 (-10%) | 18mo | $320,000 | $179 | 27 |
| 2040 Cynthia Dr | 0.69mi | 3/2.5 (-1) | 2,289 (+15%) | 19mo | $519,500 | $227 | 20 |
Match score weights: distance 35% · size 25% · config 20% · recency 20%. Top-matched comps best support the ARV.
Projected returns pro-forma
-3.0% appreciation · 3.12% rent growth · sell at horizon
- IRR
- -4.3%
- Equity multiple
- 0.84×
- Total profit
- $-11,621
- Equity at exit
- $38,021
- IRR
- 5.4%
- Equity multiple
- 1.40×
- Total profit
- $28,645
- Equity at exit
- $22,048
Cash invested: $71,400 (down + closing). Projections, not guarantees.
Landlord ↔ Tenant lean methodology
- Overall (STATE)
- 87 Strongly Landlord-Friendly
- State Florida
- 87 Strongly Landlord-Friendly · R+3
- County
- — inherits STATE
- City
- — inherits STATE
ZIP-level market 32303
- Rents YoY
- 3.1%
- Active inventory
- 238
- Price-to-rent
- 8.5×
Monthly cashflow live
- Estimated rent
- $2,495 medium interval (Pro) →
- Mortgage (P&I)
- −$1,337
- Tax from tax record
- −$64 /mo · $765/yr
- Insurance
- −$106
- HOA
- −$0
- Vacancy / Maint / Mgmt
- −$524
- Net cashflow
- $463
Break-even live
Sensitivity live
| Price | -10% $608 | -5% $536 | +0% $463 | +5% $391 | +10% $319 |
|---|---|---|---|---|---|
| Rent | -10% $266 | -5% $365 | +0% $463 | +5% $562 | +10% $661 |
| Rate | -1.0pp $592 | -0.5pp $528 | base $463 | +0.5pp $397 | +1.0pp $330 |
UW: 25.0% down · 7.5% · 30yr · 1.5% tax · 5.0% vac · 8.0% maint · 8.0% mgmt
Financing live
Cash to close
- Down payment
- $63,750
- Closing costs
- $7,650
- Reserves months
- —
- Total cash needed
- —
Loan-product check · same deal, 3 products live
Conventional
25% down · 7.5% · 30yr
- Down + closing
- —
- Monthly P&I
- —
- Monthly cashflow
- —
- DSCR
- —
- Eligible?
- —
Personal DTI + credit; lowest rate.
DSCR
20% down · 8.5% · 30yr
- Down + closing
- —
- Monthly P&I
- —
- Monthly cashflow
- —
- DSCR
- —
- Eligible?
- —
No personal income docs; deal must DSCR.
Hard money
10% down · 12.0% · 12mo
- Down + closing
- —
- Monthly P&I
- —
- Monthly cashflow
- —
- DSCR
- —
- Eligible?
- —
Short-term bridge; refi at stabilization.
Rent comps 3 comps
| Address | Beds | Baths | Sqft | Rent | $/sqft | DOM | Units | Dist |
|---|---|---|---|---|---|---|---|---|
| 3400 Old Bainbridge Rd #203 Tallahassee, FL | 3.0 | 3.0 | 1368 | $1,650 | $1.21 | 22d | 1 | 0.84mi |
| 1729 Ray Rd Tallahassee, FL | 3.0 | 1.0 | 1611 | $3,400 | $2.11 | 22d | 1 | 1.09mi |
| 3126 Okeeheepkee Rd Tallahassee, FL | 3.0 | 2.0 | 1638 | $2,900 | $1.77 | 22d | 1 | 1.33mi |
Listing history 16 events
-
2026-06-18days on market $255,000 Active 18 DOM
-
2026-06-17days on market $255,000 Active 17 DOM
-
2026-06-16days on market $255,000 Active 16 DOM
-
2026-06-15days on market $255,000 Active 15 DOM
-
2026-06-14days on market $255,000 Active 13 DOM
-
2026-06-10days on market $255,000 Active 10 DOM
-
2026-06-09days on market $255,000 Active 9 DOM
-
2026-06-08days on market $255,000 Active 8 DOM
-
2026-06-07days on market $255,000 Active 7 DOM
-
2026-06-05days on market $255,000 Active 4 DOM
-
2026-06-03days on market $255,000 Active 3 DOM
-
2026-06-02days on market $255,000 Active 2 DOM
-
2026-05-31pricedays on market $255,000 Active 1 DOM
-
2026-05-31days on market $265,000 Active 12 DOM
-
2026-05-30days on market $265,000 Active 11 DOM
-
2026-05-19$265,000 Active
ⓘ Source: listings_history table (triggers on properties + properties_extension) + one-shot
backfill from property_details.listing_events for pre-trigger history.
Tax reassessment forecast FL · Resets to sale price
- Current annual tax
- $765 · $64/mo
- Projected year-2 tax
- $2,116 · $176/mo
- Expected delta
- +$1,351/yr (+$113/mo · 176.5%)
ⓘ Screening estimate from a state-policy table — verify with the county assessor before closing.
Climate risk First Street
- Flood 1/10 Low FEMA zone X (unshaded) · 0% chance over 30 yrs
- Wildfire 4/10 Moderate
- Heat 8/10 Severe 7 d/yr ≥108°F today · 20 d/yr by 30 yrs out
- Wind 9/10 Extreme 99% chance of damaging wind over 30 yrs
- Air quality 5/10 Major 7 unhealthy d/yr today · 7 by 30 yrs out
Nearby sold comps map
Loading sold comps map…
Walkable amenities ~0.75 mi
Loading nearby amenities…
Taxation est. · year 1
- Rental income
- $29,935
- − Mortgage interest
- −$14,284
- − Property taxes
- −$765
- − Insurance
- −$1,275
- − Repairs & maintenance
- −$2,395
- − Management
- −$2,395
- − Depreciation
- −$7,418
- Taxable income
- $1,403
- Est. tax owed @ 24.0%
- −$337
- After-tax cash flow
- $5,225/yr
For passive investors: Depreciation is non-cash, so a rental often shows a tax loss while cash-flowing — sheltering income. Rental losses are passive: they offset passive income freely, and up to $25,000/yr can offset ordinary (W-2) income if you actively participate and your MAGI is under $100k (phasing out to $0 by $150k); unused losses carry forward. On sale, claimed depreciation is recaptured at up to 25%, and gains may owe capital-gains tax (a 1031 exchange can defer both). Figures are a year-1 estimate at your 24.0% rate — not tax advice; consult a CPA.
Schools (NCES district)
- District
- Leon
- NCES district ID
- 1201110
- Math proficiency
- 48% ▼ -13.00%
- Reading proficiency
- 53% ▼ -5.00%
- Median HH income
- $46,339
- Composite
- 42.84/100
- National rank
- #3131
- State rank
- #33 of 73 in FL
Livability — Tallahassee
- Score
- 86/100
- State rank
- #19
- US rank
- #429
Category grades
Schools grade is shown separately in the Schools card above.
Census & demographics
- County
- Leon County · 294,472 people
- City population
- 294,472
- Metro
- Tallahassee, FL
- Population (ZIP)
- 49,785
- Household income
- $62,275
- Rent vs Own
- Severe rent burden
- 2919.0
Population outlook (Leon County) Hauer SSP2
- Today (2025)
- 315,507 people
- By 2030
- 330,677 · +4.8%
- By 2040
- 358,465 · +13.6%
- By 2050
- 386,804 · +22.6%
- By 2075
- 465,480 · +47.5%
- By 2100
- 519,959 · +64.8%
Race, ethnicity, and origin ACS 2023
- Neighborhood character
- Diverse neighborhood (Simpson 0.63)
- Race & ethnicity
- White 50% Black 34% Hispanic / Latino 8% Two or more races 8% Asian 3%
- Hispanic origin (detail)
- Mexican 2% Puerto Rican 1% Cuban 2%
- Common ancestry
- Slovak 2% Italian 1% Lithuanian 1%
- Foreign-born
- 8% · Canada, Vietnam, China
- Languages at home
- 89% English-only · Spanish 5% Arabic 1% French/Haitian/Cajun 1%
Political lean MEDSL · Leon
- 2024 margin
- Strong D (+21.8) · D 60.3% · R 38.5% · Other 1.2%
- 2008→2024 swing
- -2.5pp toward R · 2008: 24.3pp · 2024: 21.8pp
- All cycles
- 2024: D+21.8 2020: D+28.3 2016: D+25.1 2012: D+23.6 2008: D+24.3
Not yet ingested
- Civics
- —
Market trends
- HPI YoY
- ▼ -255.24%
- Current HPI
- 241.3131
- Rent YoY
- ▲ 3.12%
- Metro
- Tallahassee, FL
- State GDP YoY
- ▲ 3.28%
- F500 in state
- 36
Industry mix (Fortune 500 HQ in FL)
| Industry | F500 HQs | Revenue |
|---|---|---|
| Industrial Technology | 2 | $29B |
|
||
| Insurance | 2 | $17B |
|
||
| Retail | 1 | $60B |
|
||
| Technology Distribution | 1 | $58B |
|
||
| Homebuilding | 1 | $35B |
|
||
| Technology Manufacturing | 1 | $35B |
|
||
Price history
1 event — show timeline
- 2026-05-19 Listed $265,000 CATRS
Property tax history
+0.4%/yrLatest (2025): $765 · +1.3% YoY. Source: county tax records.
Cash-flow waterfall
monthlySold comps — $/sqft
last 12 mo · ≤1 miLoading sold comps…