 Duplex
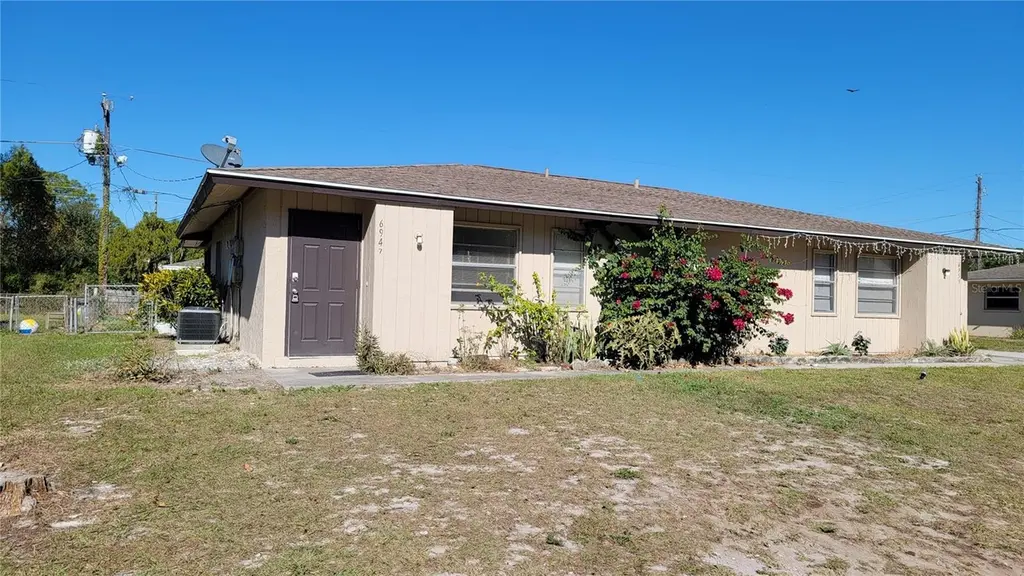
6947 Brentford Rd · Lake Sarasota, FL
Flood risk 1/10 · Minimal
- FEMA flood zone
- X (unshaded)
- Chance of flooding over 30 yrs
- 0.0%
- Est. flood insurance / yr
- $507 – $1,088
Fire risk 1/10 · Minimal
- Est. fire insurance / yr
- $947 – $1,759
Heat risk 10/10 · Severe
- Hot days now (above 109°F)
- 7 days/yr
- Hot days in 30 yrs
- 29 days/yr
Wind risk 10/10 · Severe
- Chance of severe wind over 30 yrs
- 99.0%
Air-quality risk 3/10 · Minor
- Unhealthy air days now
- 3 days/yr
- Unhealthy air days in 30 yrs
- 3 days/yr
Risk factors via First Street. Map © Google.
Why this score? — see what drove the B- grade
The composite is a weighted blend of 9 inputs, each scored 0–100. Each bar is that input's sub-score; the figure is the points it added to the 100-point composite (weight × sub-score).
- Cash flow +30.0/30.0
- DSCR +10.0/10.0
- 1% rule +8.2/10.0
- ARV discount +7.5/15.0
- Schools +5.4/10.0
- Livability +3.6/5.0
- Rent growth +2.5/5.0
- Condition / age +2.5/5.0
- Appreciation +0.0/10.0
$395,000
🖨 Deal sheet 📄 Offer letter ✓ Due diligence
Multi-family units
County records classify this as Multi-Family (2-4 Unit). Listing-text estimate: 2 units. confirmed
Listing remarks MLS
Duplex alert! Located just east of I 75 off Bee Ridge Rd in the Lake Sarasota community. This duplex is configured with 2 bedroom, 1 bathroom units with screened lanais and fenced in green space. Both units have new HVAC units (2019-2020). Off street parking. Concrete block construction. Both units are the same floor plan and have private utility closets off the the screened in lanai. DO NOT TALK TO TENANTS
Key facts
- Newer impact windows
- Fenced yard
- Newer roof
Tags
Property features AI
Finance
- Other: Zoning: RSF3; Total number of buildings: 1; Total acreage: less than 1/4 acre
- Financial info: Gross income reported: $43,080; Annual net income reported: $32,101; Pro forma rent for each 2-bedroom unit: $1,795; Lease type: Gross lease (lease restrictions apply)
- HOA & community: No association; Pets allowed (cats and dogs)
Exterior
- Utilities: Public water; Septic tank (or none listed); Cable connected; Electricity connected; Water connected
- Home design: Residential income property (duplex); Single building with 2 units; Total living area about 1,576 square feet; Lot about 0.19 acres
- Construction: Block and wood siding construction; Shingle roof; Slab foundation; Built with duplex layout
- Exterior features: Fenced yard; Private mailbox; Sliding doors; Asphalt road access
Interior
- Kitchen: Eat-in kitchen
- Bedrooms: 4 total bedrooms; Two 2-bedroom units (duplex configuration)
- Bathrooms: Two 1-bath units (one bath each)
- Heating & cooling: Central heating (electric); Central air conditioning
- Interior features: Ceiling fans; Eat-in kitchen
- Laundry & utility: Laundry closet; Washer hookup; Outside laundry access
Neighborhood map
What this means for you Summary
Snapshot
- This is a 2 × 2-bed/1.0-bath units multifamily listed at $395k.
Deal economics
- At list price, monthly cash flow is $1k ($18k/yr) — positive. Per door: $745/mo.
- The deal already cash-flows at list — no discount required.
- Meets the 1% rule at list price ($5k rent vs $395k).
Location & tenants
- Location reads 72/100 on livability (#365 in FL) — a middle-class / working-renter tenant base. Strengths: crime A+, employment A+, housing A+; Watch: schools D, amenities F, commute F.
- Sarasota (urban): math 63% / reading 63% proficiency, ranked #7 of 73 in FL (top 10%) — acceptable for families but not a draw, mixed tenant base, ~2y average lease.
- Market conditions: Rents soft (-0.1%/yr); 564 active listings in the ZIP; high-income renter base; 7,466 units permitted in Sarasota County in 2024 (2,138 in 5+ unit buildings).
- At $5,205/mo this rent would consume 54% of the median local household income ($116k/yr) (locally 69% of renters already pay >50% of income on rent) — very limited rent-growth headroom before tenants either downsize or default.
Forward outlook
- Local home prices are declining (-3.0%/yr); year-one equity from $3k of loan paydown is wiped out by about $12k of value loss. Plan a longer hold.
- Sarasota County population projected at +20% by 2050 — long-run rental-demand tailwind backs the buy-and-hold thesis.
Negotiation context
- Only 5 days on market — expect competitive offers; lowballing is unlikely to land.
- 4 sale attempts since 19y ago with the ask held roughly flat each time — persistent listings suggest the price (not the market) is what's stuck; bring a comps-based counter.
- Current owner paid $293k; 35% above their basis — modest negotiation headroom, anchor on the comps not their cost.
Risks & watch-outs
- Climate carrying-cost: severe wind risk, 99% chance of damaging wind over 30y; extreme-heat days projected 7→29/yr by 2055 (HVAC capex compounding) — expect insurance premiums to compound above CPI over the hold.
Questions for the listing agent
- Can we see the unit-by-unit rent roll, current vacancy, and any below-market leases? What's the average tenancy length?
- What capital expenditures (roof, boiler, parking lot, exteriors) have been made in the last 5 years, and what's planned in the next 2?
- Built in 1973 — when were the roof, HVAC, electrical panel, plumbing, and water heater last replaced?
- Is there a deadline driving the sale (1031 exchange, divorce, estate, relocation)? That informs how much negotiation room exists.
- Schools are D-rated, which usually means shorter tenancies and higher turnover. Who's the typical renter profile here, and what's been the actual vacancy rate?
- What's the average days-on-market for RENTAL listings here right now (not sales)? A rising rental-DOM trend means longer vacancies and softer asking-rent achievability than the comps imply.
- What's the recent tenant-quality profile in this submarket — average credit score on applications, eviction rate, late-payment / NSF rate, and stable-employment percentage? A property-management company in the area should have these aggregated.
- How much new apartment / multifamily construction is in the pipeline within 1–3 miles? Heavy new supply (>2% of stock underway) typically softens rents 12–24 months out; light construction supports rent growth.
Investment metrics
- 1% rule
- 1.32% ✓
- Cap rate
- 10.82%
- Cash-on-cash
- 16.17%
- DSCR
- 1.72
- GRM
- 6.3
CMA / ARV
No comps found within radius.
Projected returns pro-forma
-3.0% appreciation · 0.0% rent growth · sell at horizon
- IRR
- 3.8%
- Equity multiple
- 1.14×
- Total profit
- $15,681
- Equity at exit
- $58,896
- IRR
- 10.3%
- Equity multiple
- 1.70×
- Total profit
- $76,991
- Equity at exit
- $34,152
Cash invested: $110,600 (down + closing). Projections, not guarantees.
Landlord ↔ Tenant lean methodology
- Overall (STATE)
- 87 Strongly Landlord-Friendly
- State Florida
- 87 Strongly Landlord-Friendly · R+3
- County
- — inherits STATE
- City
- — inherits STATE
ZIP-level market 34241
- Rents YoY
- -0.1%
- Active inventory
- 564
- Price-to-rent
- 12.6×
Monthly cashflow live
- Estimated rent
- $5,205 medium interval (Pro) →
- Mortgage (P&I)
- −$2,071
- Tax from tax record
- −$385 /mo · $4,626/yr
- Insurance
- −$165
- HOA
- −$0
- Vacancy / Maint / Mgmt
- −$1,093
- Net cashflow
- $1,490
Break-even live
2-unit breakdown (identical units grouped — click to expand)
| Units | Beds | Baths | Est. rent |
|---|---|---|---|
| 2× units | 2 | 1 | $5,206 |
| #1 | 2 | 1 | $2,603 |
| #2 | 2 | 1 | $2,603 |
| Total (2 units) | $5,205 | ||
UW: 25.0% down · 7.5% · 30yr · 1.5% tax · 5.0% vac · 8.0% maint · 8.0% mgmt
Financing live
Cash to close
- Down payment
- $98,750
- Closing costs
- $11,850
- Reserves months
- —
- Total cash needed
- —
Loan-product check · same deal, 3 products live
Conventional
25% down · 7.5% · 30yr
- Down + closing
- —
- Monthly P&I
- —
- Monthly cashflow
- —
- DSCR
- —
- Eligible?
- —
Personal DTI + credit; lowest rate.
DSCR
20% down · 8.5% · 30yr
- Down + closing
- —
- Monthly P&I
- —
- Monthly cashflow
- —
- DSCR
- —
- Eligible?
- —
No personal income docs; deal must DSCR.
Hard money
10% down · 12.0% · 12mo
- Down + closing
- —
- Monthly P&I
- —
- Monthly cashflow
- —
- DSCR
- —
- Eligible?
- —
Short-term bridge; refi at stabilization.
Listing history 15 events
-
2026-05-05status Pending
-
2026-04-30$395,000 Active
-
2025-08-24historical $1,695
-
2025-08-13$1,695
-
2023-08-29historical $1,695
-
2023-08-13price $1,695
-
2021-08-02soldstatus $293,100 Closed 415-char remark
Show marketing remark (415 chars)
Duplex alert! Located just east of I 75 off Bee Ridge Rd in the Lake Sarasota community. This duplex is configured with 2 bedroom, 1 bathroom units with screened lanais and fenced in green space. Both units have new HVAC units (2019-2020). Off street parking. Concrete block construction. Both units are the same floor plan and have private utility closets off the the screened in lanai. DO NOT TALK TO TENANTS
-
2021-08-02soldstatus $293,100
Show marketing remark (415 chars)
Duplex alert! Located just east of I 75 off Bee Ridge Rd in the Lake Sarasota community. This duplex is configured with 2 bedroom, 1 bathroom units with screened lanais and fenced in green space. Both units have new HVAC units (2019-2020). Off street parking. Concrete block construction. Both units are the same floor plan and have private utility closets off the the screened in lanai. DO NOT TALK TO TENANTS
-
2021-07-09status Pending 415-char remark
Show marketing remark (415 chars)
Duplex alert! Located just east of I 75 off Bee Ridge Rd in the Lake Sarasota community. This duplex is configured with 2 bedroom, 1 bathroom units with screened lanais and fenced in green space. Both units have new HVAC units (2019-2020). Off street parking. Concrete block construction. Both units are the same floor plan and have private utility closets off the the screened in lanai. DO NOT TALK TO TENANTS
-
2021-07-02$284,900 Active 415-char remark
Show marketing remark (415 chars)
Duplex alert! Located just east of I 75 off Bee Ridge Rd in the Lake Sarasota community. This duplex is configured with 2 bedroom, 1 bathroom units with screened lanais and fenced in green space. Both units have new HVAC units (2019-2020). Off street parking. Concrete block construction. Both units are the same floor plan and have private utility closets off the the screened in lanai. DO NOT TALK TO TENANTS
-
2007-09-21$264,900
-
2003-11-04soldstatus $149,500
-
1999-11-02soldstatus $97,500
-
1994-10-18soldstatus $76,000
-
1983-06-01soldstatus $50,677
ⓘ Source: listings_history table (triggers on properties + properties_extension) + one-shot
backfill from property_details.listing_events for pre-trigger history.
Tax reassessment forecast FL · Resets to sale price
- Current annual tax
- $4,626 · $385/mo
- Projected year-2 tax
- $4,626 · $385/mo
- Expected delta
- $0/yr ($0/mo · 0.0%)
ⓘ Screening estimate from a state-policy table — verify with the county assessor before closing.
Climate risk First Street
- Flood 1/10 Low FEMA zone X (unshaded) · 0% chance over 30 yrs
- Wildfire 1/10 Low
- Heat 10/10 Extreme 7 d/yr ≥109°F today · 29 d/yr by 30 yrs out
- Wind 10/10 Extreme 99% chance of damaging wind over 30 yrs
- Air quality 3/10 Moderate 3 unhealthy d/yr today · 3 by 30 yrs out
Nearby sold comps map
Loading sold comps map…
Walkable amenities ~0.75 mi
Loading nearby amenities…
Taxation est. · year 1
- Rental income
- $62,460
- − Mortgage interest
- −$22,126
- − Property taxes
- −$4,626
- − Insurance
- −$1,975
- − Repairs & maintenance
- −$4,997
- − Management
- −$4,997
- − Depreciation
- −$11,491
- Taxable income
- $12,249
- Est. tax owed @ 24.0%
- −$2,940
- After-tax cash flow
- $14,946/yr
For passive investors: Depreciation is non-cash, so a rental often shows a tax loss while cash-flowing — sheltering income. Rental losses are passive: they offset passive income freely, and up to $25,000/yr can offset ordinary (W-2) income if you actively participate and your MAGI is under $100k (phasing out to $0 by $150k); unused losses carry forward. On sale, claimed depreciation is recaptured at up to 25%, and gains may owe capital-gains tax (a 1031 exchange can defer both). Figures are a year-1 estimate at your 24.0% rate — not tax advice; consult a CPA.
Schools (NCES district)
- District
- Sarasota
- NCES district ID
- 1201680
- Math proficiency
- 63% ▼ -8.00%
- Reading proficiency
- 63% ▼ -3.00%
- Median HH income
- $51,167
- Composite
- 53.68/100
- National rank
- #1428
- State rank
- #7 of 73 in FL
Livability — Lake Sarasota
- Score
- 72/100
- State rank
- #365
- US rank
- #6453
Category grades
Schools grade is shown separately in the Schools card above.
Census & demographics
- Census place
- Lake Sarasota, FL
- County
- Sarasota County · 448,376 people
- City population
- 22,808
- Metro
- North Port-Sarasota-Bradenton, FL
- Population (ZIP)
- 16,408
- Household income
- $116,412
- Rent vs Own
- Severe rent burden
- 69.0
Population outlook (Sarasota County) Hauer SSP2
- Today (2025)
- 452,380 people
- By 2030
- 474,175 · +4.8%
- By 2040
- 511,577 · +13.1%
- By 2050
- 541,467 · +19.7%
- By 2075
- 604,947 · +33.7%
- By 2100
- 621,965 · +37.5%
Race, ethnicity, and origin ACS 2023
- Neighborhood character
- Predominantly White (89%)
- Race & ethnicity
- White 89% Hispanic / Latino 8% Two or more races 6% Asian 1%
- Hispanic origin (detail)
- Puerto Rican 3% Cuban 1%
- Common ancestry
- Romanian 7% Slovak 3% Scandinavian 2%
- Foreign-born
- 10% · Canada, Dominican Republic
- Languages at home
- 90% English-only · Spanish 3% Other Indo-European 3% Russian/Polish/Slavic 2%
Political lean MEDSL · Sarasota
- 2024 margin
- R (+18.2) · D 40.5% · R 58.7%
- 2008→2024 swing
- -18.1pp toward R · 2008: -0.1pp · 2024: -18.2pp
- All cycles
- 2024: R+18.2 2020: R+10.4 2016: R+11.6 2012: R+7.4 2008: R+0.1
Not yet ingested
- Civics
- —
Market trends
- HPI YoY
- ▼ -363.72%
- Current HPI
- 278.3404
- Rent YoY
- ▬ -0.05%
- Metro
- North Port-Sarasota-Bradenton, FL
- State GDP YoY
- ▲ 3.28%
- F500 in state
- 36
Industry mix (Fortune 500 HQ in FL)
| Industry | F500 HQs | Revenue |
|---|---|---|
| Industrial Technology | 2 | $29B |
|
||
| Insurance | 2 | $17B |
|
||
| Retail | 1 | $60B |
|
||
| Technology Distribution | 1 | $58B |
|
||
| Homebuilding | 1 | $35B |
|
||
| Technology Manufacturing | 1 | $35B |
|
||
Price history
+679.4% since first listed15 events — show timeline
- 2026-05-05 Pending — Stellar MLS as Distributed by MLS Grid
- 2026-04-30 Listed $395,000 Stellar MLS as Distributed by MLS Grid
- 2025-08-24 Rental Removed $1,695 APPFOLIO
- 2025-08-13 Listed for Rent $1,695 APPFOLIO
- 2023-08-29 Rental Removed $1,695 APPFOLIO
- 2023-08-13 Price Changed $1,695 APPFOLIO
- 2021-08-02 Sold (Public Records) $293,100 Public Records
- 2021-08-02 Sold (MLS) $293,100 Stellar MLS as Distributed by MLS Grid
- 2021-07-09 Pending — Stellar MLS as Distributed by MLS Grid
- 2021-07-02 Listed $284,900 Stellar MLS as Distributed by MLS Grid
- 2007-09-21 Listed $264,900 Stellar MLS as Distributed by MLS Grid
- 2003-11-04 Sold (Public Records) $149,500 Public Records
- 1999-11-02 Sold (Public Records) $97,500 Public Records
- 1994-10-18 Sold (Public Records) $76,000 Public Records
- 1983-06-01 Sold (Public Records) $50,677 Public Records
Property tax history
+8.0%/yrLatest (2025): $4,626 · -0.9% YoY. Source: county tax records.
Cash-flow waterfall
monthlySold comps — $/sqft
last 12 mo · ≤1 miLoading sold comps…