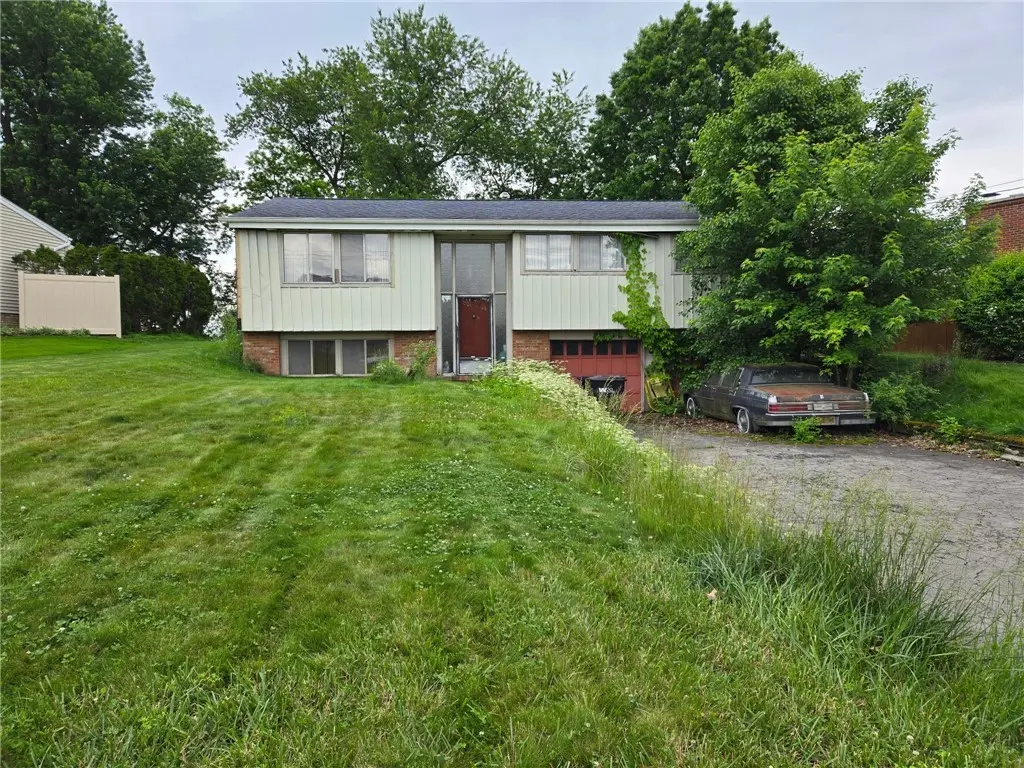
145 Rivercrest Dr · Carnot-Moon, PA
Flood risk 1/10 · Minimal
- FEMA flood zone
- X (unshaded)
- Chance of flooding over 30 yrs
- 0.0%
- Est. flood insurance / yr
- $473 – $860
Fire risk 1/10 · Minimal
- Est. fire insurance / yr
- $511 – $949
Heat risk 3/10 · Minor
- Hot days now (above 98°F)
- 7 days/yr
- Hot days in 30 yrs
- 16 days/yr
Wind risk 2/10 · Minimal
- Chance of severe wind over 30 yrs
- —
Air-quality risk 3/10 · Minor
- Unhealthy air days now
- 2 days/yr
- Unhealthy air days in 30 yrs
- 3 days/yr
Risk factors via First Street. Map © Google.
Why this score? — see what drove the B grade
The composite is a weighted blend of 9 inputs, each scored 0–100. Each bar is that input's sub-score; the figure is the points it added to the 100-point composite (weight × sub-score).
- Cash flow +30.0/30.0
- 1% rule +10.0/10.0
- DSCR +10.0/10.0
- ARV discount +7.5/15.0
- Schools +5.3/10.0
- Rent growth +3.5/5.0
- Livability +2.5/5.0
- Condition / age +2.5/5.0
- Appreciation +0.0/10.0
$109,000
🖨 Deal sheet 📄 Offer letter ✓ Due diligence
Listing remarks
Opportunity awaits at 145 Rivercrest Dr. in Moon Township! This 3 bedroom, 2.5 bathroom home offers solid bones, partial brick construction, and incredible potential for investors, flippers, or buyers looking to build equity. The property features off-street parking with a 2-car integral garage and a spacious interior layout ready for a full cosmetic renovation. Inside, you'll find generously sized living spaces along with a basement that includes laundry hookups and an additional bonus room perfect for extra living space, storage, or a future game room. Major mechanical updates already completed include an updated electrical panel and newer furnace. Please note: foundation repair is needed
Key facts
- Bonus room
- Off-street parking
- 9,356 sq ft lot
Tags
Property features AI
Exterior
- Parking: Attached garage; Built-in parking
- Utilities: Public water; Public sewer
- Home design: 2-story; Resale property
- Construction: Brick and frame construction; Asphalt roof
- Exterior features: Public transportation access
Interior
- Kitchen: Dishwasher; Stove; Some electric appliances
- Bathrooms: 2 full bathrooms; 1 half bathroom
- Heating & cooling: Forced air heating (gas); Gas cooling
- Interior features: Basement
Neighborhood map
What this means for you Summary
Snapshot
- This is a 3-bed/1.5-bath single-family listed at $109k.
Deal economics
- At list price, monthly cash flow is $816 ($10k/yr) — positive.
- The deal already cash-flows at list — no discount required.
- Meets the 1% rule at list price ($2k rent vs $109k).
Location & tenants
- Location reads: area grade B — affects rentability + tenant quality, not the cash-flow math above.
- Moon Area SD (suburban): math 50% / reading 70% proficiency, ranked #62 of 539 in PA (top 12%) — acceptable for families but not a draw, mixed tenant base, ~2y average lease; only 16% free/reduced lunch — higher-income household profile.
- Market conditions: Rents rising fast (+4.1%/yr); 177 active listings in the ZIP; 12 comparable units currently listed for rent nearby; rentals leasing fast (median 2d on market — plan ~1-2 weeks tenant-placement turnaround); solid renter incomes; 2,996 units permitted in Allegheny County in 2024 (1,588 in 5+ unit buildings).
Forward outlook
- Local home prices are declining (-3.0%/yr); year-one equity from $754 of loan paydown is wiped out by about $3k of value loss. Plan a longer hold.
- At projected returns (-3.0% appreciation + 4.1% rent growth), your $31k cash investment doubles in ~4 years — after that, you're playing with house money.
Negotiation context
- Only 4 days on market — expect competitive offers; lowballing is unlikely to land.
Risks & watch-outs
- Watch-outs: property tax is 3.9% of price.
Questions for the listing agent
- Built in 1969 — when were the roof, HVAC, electrical panel, plumbing, and water heater last replaced?
- Property tax is high relative to price — has the assessment been appealed recently, and will the sale trigger a re-assessment?
- Is there a deadline driving the sale (1031 exchange, divorce, estate, relocation)? That informs how much negotiation room exists.
- What's the average days-on-market for RENTAL listings here right now (not sales)? A rising rental-DOM trend means longer vacancies and softer asking-rent achievability than the comps imply.
- What's the recent tenant-quality profile in this submarket — average credit score on applications, eviction rate, late-payment / NSF rate, and stable-employment percentage? A property-management company in the area should have these aggregated.
- How much new for-sale + rental construction is in the pipeline within 1–3 miles? Heavy new supply typically softens prices + rents 12–24 months out; constrained supply supports both.
Investment metrics
- 1% rule
- 2.08% ✓
- Cap rate
- 15.27%
- Cash-on-cash
- 32.07%
- DSCR
- 2.43
- GRM
- 4.0
CMA / ARV
- ARV (on-the-fly)
- $298,782
- Comps found
- 8
Show comp detail 8 sales within ~0.75 mi
| Address | Dist | Beds/Ba | Sqft | Sold | Price | $/sf | Match |
|---|---|---|---|---|---|---|---|
| 156 Rivercrest Dr | 0.03mi | 3/1.5 | 1,490 (-1%) | 8mo | $275,000 | $185 | 90 |
| 144 Rivercrest Dr | 0.07mi | 3/1.5 | 1,428 (-5%) | 9mo | $270,000 | $189 | 80 |
| 118 Rivercrest Dr | 0.19mi | 3/2.5 | 1,428 (-5%) | 2mo | $347,000 | $243 | 76 |
| 160 Rivercrest Dr | 0.04mi | 3/1.0 | 1,426 (-6%) | 20mo | $282,000 | $198 | 70 |
| 110 Shadow Ln | 0.05mi | 3/1.5 | 1,401 (-7%) | 21mo | $290,000 | $207 | 68 |
| 301 Chadwick St | 0.60mi | 4/2.0 (+1) | 1,656 (+10%) | 9mo | $260,000 | $157 | 41 |
| 222 Win Ridge Dr | 0.40mi | 3/2.0 | 1,320 (-12%) | 23mo | $311,000 | $236 | 40 |
| 238 Larue Dr | 0.69mi | 3/2.0 | 1,412 (-6%) | 22mo | $227,500 | $161 | 37 |
Match score weights: distance 35% · size 25% · config 20% · recency 20%. Top-matched comps best support the ARV.
Projected returns pro-forma
-3.0% appreciation · 4.13% rent growth · sell at horizon
- IRR
- 28.6%
- Equity multiple
- 2.21×
- Total profit
- $37,062
- Equity at exit
- $16,252
- IRR
- 36.8%
- Equity multiple
- 4.63×
- Total profit
- $110,805
- Equity at exit
- $9,424
Cash invested: $30,520 (down + closing). Projections, not guarantees.
Landlord ↔ Tenant lean methodology
- Overall (STATE)
- 62 Landlord-Friendly
- State Pennsylvania
- 62 Landlord-Friendly · EVEN
- County
- — inherits STATE
- City
- — inherits STATE
ZIP-level market 15108
- Rents YoY
- 4.1%
- Active inventory
- 177
- Price-to-rent
- 4.0×
Monthly cashflow live
- Estimated rent
- $2,268 high interval (Pro) →
- Mortgage (P&I)
- −$572
- Tax from tax record
- −$359 /mo · $4,305/yr
- Insurance
- −$45
- HOA
- −$0
- Vacancy / Maint / Mgmt
- −$476
- Net cashflow
- $816
Break-even live
UW: 25.0% down · 7.5% · 30yr · 1.5% tax · 5.0% vac · 8.0% maint · 8.0% mgmt
Financing live
Cash to close
- Down payment
- $27,250
- Closing costs
- $3,270
- Reserves months
- —
- Total cash needed
- —
Loan-product check · same deal, 3 products live
Conventional
25% down · 7.5% · 30yr
- Down + closing
- —
- Monthly P&I
- —
- Monthly cashflow
- —
- DSCR
- —
- Eligible?
- —
Personal DTI + credit; lowest rate.
DSCR
20% down · 8.5% · 30yr
- Down + closing
- —
- Monthly P&I
- —
- Monthly cashflow
- —
- DSCR
- —
- Eligible?
- —
No personal income docs; deal must DSCR.
Hard money
10% down · 12.0% · 12mo
- Down + closing
- —
- Monthly P&I
- —
- Monthly cashflow
- —
- DSCR
- —
- Eligible?
- —
Short-term bridge; refi at stabilization.
Rent comps 12 comps
| Address | Beds | Baths | Sqft | Rent | $/sqft | DOM | Units | Dist |
|---|---|---|---|---|---|---|---|---|
| 634 Maple Ln Sewickley, PA | 3.0 | 2.5 | 1714 | $2,500 | $1.46 | 1d | 1 | 0.66mi |
| 360 Hemlock Dr Coraopolis, PA | 3.0 | 1.0 | 1050 | $1,250 | $1.19 | 7d | 1 | 0.66mi |
| 114 Westbury Dr Coraopolis, PA | 4.0 | 2.5 | 1639 | $2,450 | $1.49 | 1d | 1 | 0.72mi |
| 327 Chestnut St Sewickley, PA | 3.0 | 1.0 | 1100 | $2,750 | $2.50 | 1d | 1 | 0.86mi |
| 220 Graham St Unit 5/E Sewickley, PA | 3.0 | 1.0 | 2000 | $2,000 | $1.00 | 1d | 1 | 0.88mi |
| 711 Newton Sq Coraopolis, PA | 2.0 | 1.5 | 1104 | $1,695 | $1.54 | 43d | 1 | 0.93mi |
| 206 Orchard Pl Unit 2 Sewickley, PA | 2.0 | 1.0 | 1361 | $1,950 | $1.43 | 2d | 1 | 0.95mi |
| 208 Orchard Pl Unit First Edgeworth, PA | 2.0 | 1.0 | 1361 | $1,950 | $1.43 | 1d | 1 | 0.96mi |
| 518 Broad St Unit 2 Sewickley, PA | 3.0 | 1.0 | 1200 | $2,350 | $1.96 | 43d | 1 | 1.04mi |
| 325 Centennial Ave Sewickley, PA | 3.0 | 2.5 | 1654 | $3,850 | $2.33 | 1d | 1 | 1.09mi |
| 732 Orchard Ter Sewickley, PA | 3.0 | 2.0 | 2090 | $3,300 | $1.58 | 1d | 1 | 1.30mi |
| 911 Nevin Ave Sewickley, PA | 4.0 | 2.0 | 1536 | $2,950 | $1.92 | 10d | 1 | 1.44mi |
Listing history 4 events
-
2026-06-02status $109,000 Pending 4 DOM
-
2026-06-01days on market $109,000 Active 4 DOM
-
2026-05-31days on market $109,000 Active 3 DOM
-
2026-05-27$109,000 Active
ⓘ Source: listings_history table (triggers on properties + properties_extension) + one-shot
backfill from property_details.listing_events for pre-trigger history.
Tax reassessment forecast PA · Partial reset (capped growth)
- Current annual tax
- $4,305 · $359/mo
- Projected year-2 tax
- $4,305 · $359/mo
- Expected delta
- $0/yr ($0/mo · 0.0%)
ⓘ Screening estimate from a state-policy table — verify with the county assessor before closing.
Climate risk First Street
- Flood 1/10 Low FEMA zone X (unshaded) · 0% chance over 30 yrs
- Wildfire 1/10 Low
- Heat 3/10 Moderate 7 d/yr ≥98°F today · 16 d/yr by 30 yrs out
- Wind 2/10 Low
- Air quality 3/10 Moderate 2 unhealthy d/yr today · 3 by 30 yrs out
Nearby sold comps map
Loading sold comps map…
Walkable amenities ~0.75 mi
Loading nearby amenities…
Taxation est. · year 1
- Rental income
- $27,211
- − Mortgage interest
- −$6,106
- − Property taxes
- −$4,305
- − Insurance
- −$545
- − Repairs & maintenance
- −$2,177
- − Management
- −$2,177
- − Depreciation
- −$3,171
- Taxable income
- $8,731
- Est. tax owed @ 24.0%
- −$2,095
- After-tax cash flow
- $7,692/yr
For passive investors: Depreciation is non-cash, so a rental often shows a tax loss while cash-flowing — sheltering income. Rental losses are passive: they offset passive income freely, and up to $25,000/yr can offset ordinary (W-2) income if you actively participate and your MAGI is under $100k (phasing out to $0 by $150k); unused losses carry forward. On sale, claimed depreciation is recaptured at up to 25%, and gains may owe capital-gains tax (a 1031 exchange can defer both). Figures are a year-1 estimate at your 24.0% rate — not tax advice; consult a CPA.
Schools (NCES district)
- District
- Moon Area SD
- NCES district ID
- 4215830
- Math proficiency
- 50% ▼ -15.00%
- Reading proficiency
- 70% ▼ -10.00%
- Median HH income
- $70,464
- Composite
- 52.95/100
- National rank
- #1528
- State rank
- #62 of 539 in PA
Livability — Carnot-Moon
No livability data for this city. (Only ~50 U.S. cities are tracked.)
Census & demographics
- Census place
- Carnot-Moon, PA
- County
- Allegheny County · 1,022,028 people
- Metro
- Pittsburgh, PA
- Population (ZIP)
- 42,799
- Household income
- $100,859
- Rent vs Own
- Severe rent burden
- 890.0
Population outlook (Allegheny County) Hauer SSP2
- Today (2025)
- 1,250,282 people
- By 2030
- 1,256,482 · +0.5%
- By 2040
- 1,256,318 · +0.5%
- By 2050
- 1,244,169 · -0.5%
- By 2075
- 1,197,693 · -4.2%
- By 2100
- 1,093,187 · -12.6%
Race, ethnicity, and origin ACS 2023
- Neighborhood character
- Predominantly White (85%)
- Race & ethnicity
- White 85% Black 5% Two or more races 5% Asian 4% Hispanic / Latino 2%
- Common ancestry
- Romanian 7% Subsaharan African 4% Slovak 2%
- Foreign-born
- 6% · Canada, Vietnam
- Languages at home
- 93% English-only · Spanish 2% Other Indo-European 1% Other Asian/Pacific 1%
Political lean MEDSL · Allegheny
- 2024 margin
- Strong D (+20.3) · D 59.7% · R 39.4%
- 2008→2024 swing
- +4.8pp toward D · 2008: 15.5pp · 2024: 20.3pp
- All cycles
- 2024: D+20.3 2020: D+20.4 2016: D+16.4 2012: D+14.4 2008: D+15.5
Not yet ingested
- Civics
- —
Market trends
- HPI YoY
- ▼ -220.09%
- Current HPI
- 250.7623
- Rent YoY
- ▲ 4.13%
- Metro
- Pittsburgh, PA
- State GDP YoY
- ▲ 1.68%
- F500 in state
- 34
Industry mix (Fortune 500 HQ in PA)
| Industry | F500 HQs | Revenue |
|---|---|---|
| Healthcare | 2 | $309B |
|
||
| Insurance | 2 | $27B |
|
||
| Telecommunications / Media | 1 | $124B |
|
||
| Industrial Distribution | 1 | $22B |
|
||
| Financial Services | 1 | $20B |
|
||
| Chemicals / Materials | 1 | $18B |
|
||
Price history
1 event — show timeline
- 2026-05-27 Listed $109,000 West Penn MLS
Property tax history
+2.7%/yrLatest (2026): $4,305 · +6.8% YoY. Source: county tax records.
Cash-flow waterfall
monthlySold comps — $/sqft
last 12 mo · ≤1 miLoading sold comps…