 Multi-family
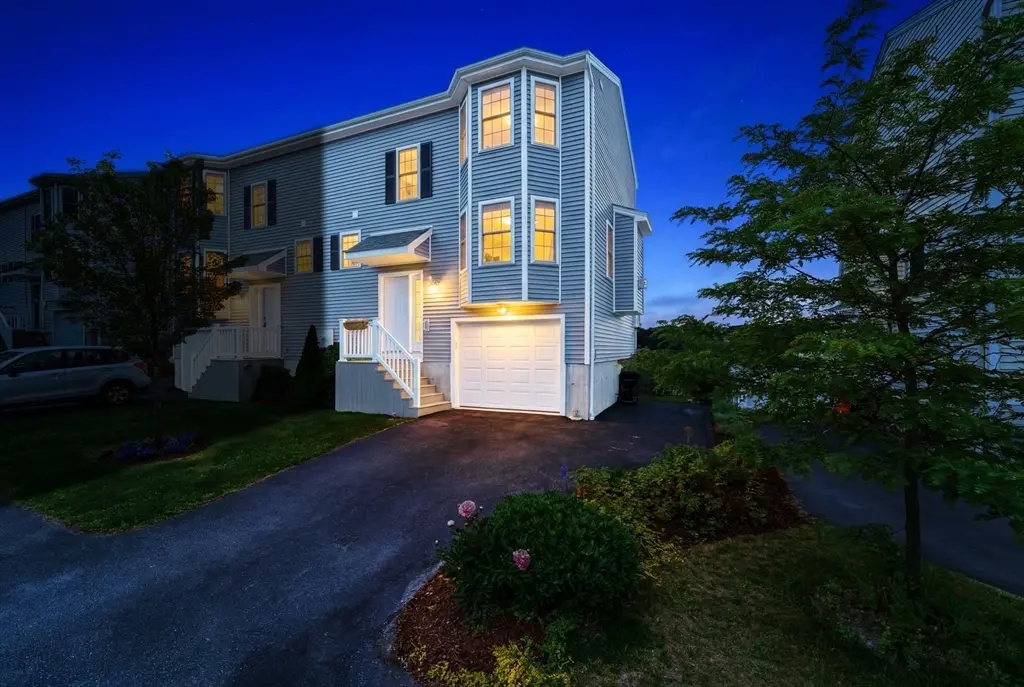
34 Bittersweet Blvd · Worcester, MA
Flood risk 1/10 · Minimal
- FEMA flood zone
- X (unshaded)
- Chance of flooding over 30 yrs
- 0.0%
- Est. flood insurance / yr
- $473 – $860
Fire risk 1/10 · Minimal
- Est. fire insurance / yr
- $915 – $1,699
Heat risk 4/10 · Minor
- Hot days now (above 94°F)
- 7 days/yr
- Hot days in 30 yrs
- 16 days/yr
Wind risk 6/10 · Moderate
- Chance of severe wind over 30 yrs
- 27.0%
Air-quality risk 2/10 · Minimal
- Unhealthy air days now
- 1 days/yr
- Unhealthy air days in 30 yrs
- 2 days/yr
Risk factors via First Street. Map © Google.
Why this score? — see what drove the F grade
The composite is a weighted blend of 9 inputs, each scored 0–100. Each bar is that input's sub-score; the figure is the points it added to the 100-point composite (weight × sub-score).
- ARV discount +7.5/15.0
- Cash flow +4.5/30.0
- Livability +4.4/5.0
- Rent growth +2.5/5.0
- Condition / age +2.5/5.0
- Schools +2.0/10.0
- 1% rule +0.1/10.0
- DSCR +0.0/10.0
- Appreciation +0.0/10.0
$439,900
🖨 Deal sheet 📄 Offer letter ✓ Due diligence
Multi-family units
County records classify this as Multi-Family (2-4 Unit). Listing-text estimate: 1 unit. estimate disagrees with records
Listing remarks MLS
Great opportunity to be involved in some new construction! Single Family attached homes, with no condo fees, Homes are Energy Star certified with fantastic views. This 3 bedroom1.5 bath has an open floor plan with stainless steel and granite in the kitchen. Keep warm by the fireplace during winter or enjoy the back deck during the summer. There's 125 amp service and hot water by heat pump. Located near all major highways, great for commuting. Builder is also supplying ALL appliances for these new homes. Reach out for floor plans & specs. *MLS photos are of similar completed property* Home is currently under construction.
Key facts
- Gas fireplace
- Two tiers of space
- Large pantry
Tags
Property features AI
Finance
- Other: Heat zones: 2; Exclusions: Upstairs bathroom shelving
- HOA & community: Community has public transportation access, nearby shopping, and highway access
Exterior
- Parking: Attached garage (1 car); Under-cover parking (1 covered space); 2 open/off-street paved parking spaces; Paved driveway
- Utilities: Public water; Public sewer; Circuit breaker electric; Electric range capable; Electric dryer hookup; Gas water heater
- Home design: Single family residence; Multi/split levels; Property is attached; Grey exterior color
- Construction: Frame construction; Shingle roof; Concrete perimeter foundation; Built (per public records)
- Exterior features: Deck; Rain gutters; Fenced yard / enclosed fencing; Garden; Scenic view(s); Public road frontage
Interior
- Kitchen: Stone/granite/solid countertops; Stainless steel appliances; Range; Microwave; Refrigerator
- Bedrooms: Master bedroom on second level with double closet and bay/bow/box window; Second bedroom on second level with closet and bay/bow/box window; Third bedroom on second level with closet
- Flooring: Tile; Wall-to-wall carpet; Laminate in dining area
- Bathrooms: One full bathroom on second level with tub and shower; One half bathroom on first level
- Heating & cooling: Forced air heating (natural gas); Central air conditioning; Has heating and cooling
- Interior features: Open floorplan; Pantry; Breakfast bar / nook; Double vanity in upper bathroom; Dressing room in upper bathroom; Insulated doors; Insulated windows; 6 total rooms; Full basement with garage access; Living room with overhead lighting and bay/bow/box windows; Dining room with exterior deck access (slider)
- Laundry & utility: Washer and dryer included; Washer hookup; Electric dryer hookup; Laundry in basement
Neighborhood map
What this means for you Summary
Snapshot
- This is a 3-bed/1.5-bath multifamily listed at $440k.
Deal economics
- At list price, monthly cash flow is $-1k ($-14k/yr) — negative.
- To cash-flow at today's rent, offer at most $240k (45.4% below list).
- To meet the 1% rule (rent ≥ 1% of price), the offer needs to be $224k (49.2% below list).
- Recommended offer: $224k (49.2% below list) — sets the bar for 1% rule.
- Cap rate 3.2% vs local median 4.1% in Worcester — below-typical yield; the buyer is paying a premium for something (appreciation thesis, condition, location) that the cap rate doesn't capture.
Location & tenants
- Location reads 87/100 on livability (#9 in MA, #312 nationally) — a professional / high-income tenant draw. Strengths: crime A+, amenities A+, commute A+; Watch: schools C-, cost of living D.
- Worcester (urban): math 17% / reading 30% proficiency, ranked #280 of 302 in MA (top 93%) — low school quality limits family demand, transient renter base, plan for 1-2y turnover; 66% free/reduced lunch — lower-income household profile, screen leases tightly.
- Market conditions: 13 active listings in the ZIP; 40 comparable units currently listed for rent nearby; rentals at typical pace (median 23d on market — plan ~3-4 weeks tenant-placement turnaround); 40% of comp listings sitting > 30 days — soft ceiling on asking rent; solid renter incomes; 2,293 units permitted in Worcester County in 2024 (1,205 in 5+ unit buildings).
- This rent runs 34% of the median local income ($79k/yr) — at the standard rent-burdened threshold; future hikes will face affordability resistance.
Forward outlook
- Local home prices are declining (-3.0%/yr); year-one equity from $3k of loan paydown is wiped out by about $13k of value loss. Plan a longer hold.
Negotiation context
- Only 9 days on market — expect competitive offers; lowballing is unlikely to land.
- 2 sale attempts since 9y ago with the ask held roughly flat each time — persistent listings suggest the price (not the market) is what's stuck; bring a comps-based counter.
- Current owner paid $245k; list at $440k implies a 80% gain — meaningful room to come down on a strong offer.
Risks & watch-outs
- Climate carrying-cost: major wind risk, 27% chance of damaging wind over 30y — expect insurance premiums to compound above CPI over the hold.
Questions for the listing agent
- What do current leases actually rent for vs. the listed asking? Can we see a recent rent roll and the last 12 months of T-12 income?
- Is there a deadline driving the sale (1031 exchange, divorce, estate, relocation)? That informs how much negotiation room exists.
- The area grade is low — what's the realistic commute time and amenity access for the typical tenant pool here? Any planned neighborhood developments (good or bad) we should know about?
- What's the average days-on-market for RENTAL listings here right now (not sales)? A rising rental-DOM trend means longer vacancies and softer asking-rent achievability than the comps imply.
- What's the recent tenant-quality profile in this submarket — average credit score on applications, eviction rate, late-payment / NSF rate, and stable-employment percentage? A property-management company in the area should have these aggregated.
- How much new apartment / multifamily construction is in the pipeline within 1–3 miles? Heavy new supply (>2% of stock underway) typically softens rents 12–24 months out; light construction supports rent growth.
Investment metrics
- 1% rule
- 0.51% ✗
- Cap rate
- 3.21%
- Cash-on-cash
- -11.01%
- DSCR
- 0.51
- GRM
- 16.4
CMA / ARV
No comps found within radius.
Projected returns pro-forma
-3.0% appreciation · 3.0% rent growth · sell at horizon
- IRR
- -36.4%
- Equity multiple
- -0.16×
- Total profit
- $-143,333
- Equity at exit
- $65,591
- IRR
- -50.9%
- Equity multiple
- -0.77×
- Total profit
- $-217,740
- Equity at exit
- $38,035
Cash invested: $123,172 (down + closing). Projections, not guarantees.
Landlord ↔ Tenant lean methodology
- Overall (STATE)
- 20 Strongly Tenant-Friendly
- State Massachusetts
- 20 Strongly Tenant-Friendly · D+15
- County
- — inherits STATE
- City
- — inherits STATE
ZIP-level market 01607
- Home prices YoY
- -5.3%
- Active inventory
- 13
- Price-to-rent
- 16.4×
Monthly cashflow live
- Estimated rent
- $2,236 high interval (Pro) →
- Mortgage (P&I)
- −$2,307
- Tax from tax record
- −$406 /mo · $4,877/yr
- Insurance
- −$183
- HOA
- −$0
- Vacancy / Maint / Mgmt
- −$469
- Net cashflow
- $-1,130
Break-even live
UW: 25.0% down · 7.5% · 30yr · 1.5% tax · 5.0% vac · 8.0% maint · 8.0% mgmt
Financing live
Cash to close
- Down payment
- $109,975
- Closing costs
- $13,197
- Reserves months
- —
- Total cash needed
- —
Loan-product check · same deal, 3 products live
Conventional
25% down · 7.5% · 30yr
- Down + closing
- —
- Monthly P&I
- —
- Monthly cashflow
- —
- DSCR
- —
- Eligible?
- —
Personal DTI + credit; lowest rate.
DSCR
20% down · 8.5% · 30yr
- Down + closing
- —
- Monthly P&I
- —
- Monthly cashflow
- —
- DSCR
- —
- Eligible?
- —
No personal income docs; deal must DSCR.
Hard money
10% down · 12.0% · 12mo
- Down + closing
- —
- Monthly P&I
- —
- Monthly cashflow
- —
- DSCR
- —
- Eligible?
- —
Short-term bridge; refi at stabilization.
Rent comps 40 comps
| Address | Beds | Baths | Sqft | Rent | $/sqft | DOM | Units | Dist |
|---|---|---|---|---|---|---|---|---|
| 8 Beckman St Unit 2 Worcester, MA | 2.0 | 1.0 | 1300 | $2,350 | $1.81 | 43d | 1 | 0.39mi |
| 10 Henry Ter Worcester, MA | 2.0 | 1.0 | 875 | $1,975 | $2.26 | 23d | 1 | 0.45mi |
| 50 Whipple St Unit 1 Worcester, MA | 3.0 | 1.0 | 1292 | $2,600 | $2.01 | 14d | 1 | 0.45mi |
| 50 Whipple St Unit 2 Worcester, MA | 3.0 | 1.0 | 1292 | $2,500 | $1.93 | 14d | 1 | 0.45mi |
| 10 Oswald St Unit 1 Worcester, MA | 2.0 | 1.0 | 835 | $1,700 | $2.04 | 14d | 1 | 0.46mi |
| 28 Ekman St Apt 1 Worcester, MA | 3.0 | 1.0 | 900 | $2,200 | $2.44 | 43d | 1 | 0.51mi |
| 19 Reeves St Unit 3 Worcester, MA | 2.0 | 1.0 | 1100 | $2,199 | $2.00 | 23d | 1 | 0.55mi |
| 19 Reeves St Unit 2 Worcester, MA | 2.0 | 1.0 | 1100 | $2,200 | $2.00 | 23d | 1 | 0.55mi |
| 19 Reeves St Unit 1 Worcester, MA | 3.0 | 1.0 | 1100 | $2,300 | $2.09 | 23d | 1 | 0.55mi |
| 21 Whipple St #3 Worcester, MA | 2.0 | 1.0 | 1100 | $1,900 | $1.73 | 23d | 1 | 0.56mi |
| 19 Kosta St Unit 3 Worcester, MA | 2.0 | 1.0 | 1055 | $1,700 | $1.61 | 43d | 1 | 0.56mi |
| 9 Reeves St Unit C Worcester, MA | 2.0 | 1.0 | 1000 | $2,000 | $2.00 | 43d | 1 | 0.61mi |
| 9 Reeves St Unit B Worcester, MA | 2.0 | 1.0 | 935 | $2,100 | $2.25 | 43d | 1 | 0.61mi |
| 6 Ekman St Unit 3 Worcester, MA | 2.0 | 1.0 | 900 | $1,700 | $1.89 | 23d | 1 | 0.62mi |
| 78 Greenwood St Unit 2 Worcester, MA | 3.0 | 1.0 | 1000 | $2,200 | $2.20 | 14d | 1 | 0.66mi |
| 4 Glade St Unit 3 Worcester, MA | 3.0 | 1.0 | 935 | $3,550 | $3.80 | 14d | 1 | 0.73mi |
| 3 Maxwell Ct Unit 1 Worcester, MA | 2.0 | 1.0 | 1100 | $1,950 | $1.77 | 43d | 1 | 0.93mi |
| 7 Gibbs St Apt 7 Worcester, MA | 2.0 | 2.0 | 964 | $2,200 | $2.28 | 23d | 1 | 0.98mi |
| 10 Gediminas St #19 Worcester, MA | 2.0 | 2.0 | 1008 | $2,450 | $2.43 | 21d | 1 | 0.98mi |
| 11 Gibbs St #93 Worcester, MA | 2.0 | 2.0 | 1050 | $2,150 | $2.05 | 23d | 1 | 1.02mi |
| 11 Payson St Unit 3 Worcester, MA | 3.0 | 1.0 | 1150 | $2,050 | $1.78 | 43d | 1 | 1.04mi |
| 63 Fifth Ave Unit 1 Worcester, MA | 2.0 | 2.0 | 1018 | $2,095 | $2.06 | 23d | 1 | 1.06mi |
| 52 Fairfax Rd #1 Worcester, MA | 3.0 | 1.0 | 1221 | $2,300 | $1.88 | 43d | 1 | 1.06mi |
| 183 Vernon St Unit 2 Worcester, MA | 3.0 | 1.0 | 1274 | $2,300 | $1.81 | 21d | 1 | 1.09mi |
| 183 Vernon St Unit 3 Worcester, MA | 2.0 | 1.0 | 1274 | $2,300 | $1.81 | 21d | 1 | 1.09mi |
| 72 Fairfax Rd Unit 3 Worcester, MA | 3.0 | 1.0 | 1400 | $2,300 | $1.64 | 14d | 1 | 1.11mi |
| 74 Esther St Unit 1 Worcester, MA | 4.0 | 1.0 | 1500 | $2,400 | $1.60 | 21d | 1 | 1.12mi |
| 73 1/2 Esther St Apt 3 Worcester, MA | 2.0 | 1.0 | 950 | $1,600 | $1.68 | 43d | 1 | 1.12mi |
| 171 Vernon St Unit 3 Worcester, MA | 3.0 | 1.0 | 1100 | $2,200 | $2.00 | 23d | 1 | 1.14mi |
| 90 Fairfax Rd Unit 3 Worcester, MA | 4.0 | 1.0 | 1400 | $2,750 | $1.96 | 43d | 1 | 1.16mi |
| 63 Upsala St Apt 3 Worcester, MA | 2.0 | 1.0 | 1296 | $1,950 | $1.50 | 43d | 1 | 1.16mi |
| 40 Ames St Unit 3 Worcester, MA | 2.0 | 1.0 | 1300 | $1,749 | $1.35 | 43d | 1 | 1.18mi |
| 170 Perry Ave Unit 3B Worcester, MA | 2.0 | 1.0 | 755 | $2,200 | $2.91 | 43d | 1 | 1.19mi |
| 8 S Harlem St Unit 3 Worcester, MA | 2.0 | 1.0 | 1100 | $1,850 | $1.68 | 43d | 1 | 1.21mi |
| 5 S Harlem St Apt 1 Worcester, MA | 2.0 | 1.0 | 800 | $2,100 | $2.62 | 21d | 1 | 1.22mi |
| 4 Hacker St Worcester, MA | 4.0 | 1.0 | 1000 | $2,299 | $2.30 | 14d | 1 | 1.25mi |
| 23 Windham St Unit 1 Worcester, MA | 3.0 | 2.0 | 1353 | $2,350 | $1.74 | 23d | 1 | 1.26mi |
| 39 Harlem St Unit 3 Worcester, MA | 4.0 | 1.0 | 1332 | $2,300 | $1.73 | 43d | 1 | 1.28mi |
| 48 Windham St Unit 3 Worcester, MA | 3.0 | 1.0 | 1391 | $1,950 | $1.40 | 43d | 1 | 1.30mi |
| 160 Fremont St #208 Worcester, MA | 2.0 | 2.0 | 1250 | $2,300 | $1.84 | 14d | 1 | 1.33mi |
Listing history 7 events
-
2026-06-18days on market $439,900 Active 9 DOM
-
2026-06-17days on market $439,900 Active 8 DOM
-
2026-06-16days on market $439,900 Active 7 DOM
-
2026-06-15days on market $439,900 Active 6 DOM
-
2026-06-14statusdays on market $439,900 Active 4 DOM
-
2026-06-10remarks 699-char remark
-
2026-06-10$439,900 New 1 DOM
ⓘ Source: listings_history table (triggers on properties + properties_extension) + one-shot
backfill from property_details.listing_events for pre-trigger history.
Tax reassessment forecast MA · Partial reset (capped growth)
- Current annual tax
- $4,877 · $406/mo
- Projected year-2 tax
- $5,144 · $429/mo
- Expected delta
- +$267/yr (+$22/mo · 5.5%)
ⓘ Screening estimate from a state-policy table — verify with the county assessor before closing.
Climate risk First Street
- Flood 1/10 Low FEMA zone X (unshaded) · 0% chance over 30 yrs
- Wildfire 1/10 Low
- Heat 4/10 Moderate 7 d/yr ≥94°F today · 16 d/yr by 30 yrs out
- Wind 6/10 Major 27% chance of damaging wind over 30 yrs
- Air quality 2/10 Low 1 unhealthy d/yr today · 2 by 30 yrs out
Nearby sold comps map
Loading sold comps map…
Walkable amenities ~0.75 mi
Loading nearby amenities…
Taxation est. · year 1
- Rental income
- $26,828
- − Mortgage interest
- −$24,641
- − Property taxes
- −$4,877
- − Insurance
- −$2,200
- − Repairs & maintenance
- −$2,146
- − Management
- −$2,146
- − Depreciation
- −$12,797
- Taxable loss
- −$21,979
- Est. tax savings @ 24.0%
- +$5,275
- After-tax cash flow
- $-8,290/yr
For passive investors: Depreciation is non-cash, so a rental often shows a tax loss while cash-flowing — sheltering income. Rental losses are passive: they offset passive income freely, and up to $25,000/yr can offset ordinary (W-2) income if you actively participate and your MAGI is under $100k (phasing out to $0 by $150k); unused losses carry forward. On sale, claimed depreciation is recaptured at up to 25%, and gains may owe capital-gains tax (a 1031 exchange can defer both). Figures are a year-1 estimate at your 24.0% rate — not tax advice; consult a CPA.
Schools (NCES district)
- District
- Worcester
- NCES district ID
- 2513230
- Math proficiency
- 17% ▼ -15.00%
- Reading proficiency
- 30% ▼ -8.00%
- Median HH income
- $45,063
- Composite
- 20.3/100
- National rank
- #8615
- State rank
- #280 of 302 in MA
Livability — Worcester
- Score
- 87/100
- State rank
- #9
- US rank
- #312
Category grades
Schools grade is shown separately in the Schools card above.
Census & demographics
- Census place
- Worcester, MA
- County
- Worcester County · 487,911 people
- City population
- 207,324
- Metro
- Worcester, MA-CT
- Population (ZIP)
- 8,706
- Household income
- $78,727
- Rent vs Own
- Severe rent burden
- 379.0
Population outlook (Worcester County) Hauer SSP2
- Today (2025)
- 850,858 people
- By 2030
- 860,403 · +1.1%
- By 2040
- 869,902 · +2.2%
- By 2050
- 869,110 · +2.1%
- By 2075
- 870,120 · +2.3%
- By 2100
- 829,703 · -2.5%
Race, ethnicity, and origin ACS 2023
- Neighborhood character
- Diverse neighborhood (Simpson 0.69)
- Race & ethnicity
- White 47% Hispanic / Latino 22% Two or more races 20% Black 19% Asian 3%
- Hispanic origin (detail)
- Puerto Rican 16% Dominican 2%
- Common ancestry
- Lithuanian 9% Romanian 3% Slovak 2%
- Foreign-born
- 24% · Canada, Vietnam, Jamaica
- Languages at home
- 62% English-only · Spanish 16% Other Indo-European 5% Russian/Polish/Slavic 3%
Political lean MEDSL · Worcester
- 2024 margin
- D (+10.0) · D 53.9% · R 43.9% · Other 2.2%
- 2008→2024 swing
- -3.8pp toward R · 2008: 13.8pp · 2024: 10.0pp
- All cycles
- 2024: D+10.0 2020: D+17.8 2016: D+10.5 2012: D+9.2 2008: D+13.8
Not yet ingested
- Civics
- —
Market trends
- HPI YoY
- ▼ -20.31%
- Current HPI
- 365.7055
- Rent YoY
- —
- Metro
- Worcester, MA-CT
- State GDP YoY
- ▲ 2.28%
- F500 in state
- 38
Industry mix (Fortune 500 HQ in MA)
| Industry | F500 HQs | Revenue |
|---|---|---|
| Technology | 3 | $17B |
|
||
| Insurance | 2 | $84B |
|
||
| Retail | 2 | $76B |
|
||
| Life Sciences | 1 | $43B |
|
||
| Energy Technology | 1 | $31B |
|
||
| Aerospace / Defense | 1 | $18B |
|
||
Price history
+83.3% since first listed4 events — show timeline
- 2026-06-09 Listed $439,900 MLS PIN
- 2018-02-08 Sold (MLS) $245,000 MLS PIN
- 2017-12-05 Pending — MLS PIN
- 2017-11-29 Listed $239,999 MLS PIN
Property tax history
+37.3%/yrLatest (2023): $4,877 · +8.8% YoY. Source: county tax records.
Cash-flow waterfall
monthlySold comps — $/sqft
last 12 mo · ≤1 miLoading sold comps…