10185 W Hwy 80 · Burnside, KY
Flood risk 1/10 · Minimal
- FEMA flood zone
- X (unshaded)
- Chance of flooding over 30 yrs
- 0.0%
- Est. flood insurance / yr
- $507 – $1,088
Fire risk 4/10 · Minor
- Est. fire insurance / yr
- $839 – $1,559
Heat risk 4/10 · Minor
- Hot days now (above 102°F)
- 7 days/yr
- Hot days in 30 yrs
- 20 days/yr
Wind risk 3/10 · Minor
- Chance of severe wind over 30 yrs
- 6.0%
Air-quality risk 1/10 · Minimal
- Unhealthy air days now
- 0 days/yr
- Unhealthy air days in 30 yrs
- 0 days/yr
Risk factors via First Street. Map © Google.
Why this score? — see what drove the C+ grade
The composite is a weighted blend of 9 inputs, each scored 0–100. Each bar is that input's sub-score; the figure is the points it added to the 100-point composite (weight × sub-score).
- Cash flow +20.2/30.0
- ARV discount +15.0/15.0
- DSCR +6.4/10.0
- Appreciation +5.0/10.0
- 1% rule +4.4/10.0
- Schools +4.0/10.0
- Livability +3.6/5.0
- Rent growth +2.5/5.0
- Condition / age +2.2/5.0
$145,000
🖨 Deal sheet 📄 Offer letter ✓ Due diligence
Listing remarks MLS
Great Opportunity for a rental or a fixer upper! Amazing location just off of Hwy 80 in Nancy. This home was recently used for a rental and would be fabulous restored back to its original beauty. Featuring 4BRs and 1BA. Just minutes to Lees Ford Marina and Pulaski Park,
Key facts
- Amazing location
- Just off of hwy 80
- 0.5 acre lot
Tags
Neighborhood map
What this means for you Summary
Snapshot
- This is a 3-bed/1.0-bath single-family listed at $145k. Condition is rated fair.
Deal economics
- At list price, monthly cash flow is $183 ($2k/yr) — positive.
- The deal already cash-flows at list — no discount required.
- To meet the 1% rule (rent ≥ 1% of price), the offer needs to be $136k (6.1% below list).
- Recommended offer: $128k (12.0% below list) — sets the bar for market timing.
- Cap rate 7.8% vs local median 3.0% in Burnside — top-decile yield for the area; either an underpriced asset or a hidden risk that comps aren't pricing in. Stress-test before assuming the spread holds.
Location & tenants
- Location reads 71/100 on livability (#141 in KY) — a middle-class / working-renter tenant base. Strengths: crime A+, cost of living A+, health & safety A+; Watch: schools D+, amenities F, commute F.
- Pulaski County (town): math 43% / reading 53% proficiency, ranked #17 of 165 in KY (top 10%) — families likely to look elsewhere, expect single-tenant / working-renter base with shorter leases.
- Market conditions: 172 active listings in the ZIP; 117 units permitted in Pulaski County in 2024 (50 in 5+ unit buildings).
Forward outlook
- In year one you build about $923 of equity ($1k loan paydown + $-79 appreciation (-0.1% local appreciation)).
- At projected returns (-0.1% appreciation + 3.0% rent growth), your $41k cash investment doubles in ~9 years — after that, you're playing with house money.
Negotiation context
- It's been on market 309 days — a 12% lower offer ($128k) is reasonable based on typical stale-listing flexibility.
Questions for the listing agent
- It's been on market 309 days. Have you received any prior offers? Is the seller open to a 12% concession, seller financing, or rate buy-down credit?
- Have any recent inspections been done? Can we get a copy of the seller's disclosures and any deferred-maintenance estimates?
- Built in 1970 — when were the roof, HVAC, electrical panel, plumbing, and water heater last replaced?
- Why hasn't it sold? Are there any deal-killer items the seller is aware of (foundation, flood, title, zoning, code violations)?
- Is there a deadline driving the sale (1031 exchange, divorce, estate, relocation)? That informs how much negotiation room exists.
- Schools are D-rated, which usually means shorter tenancies and higher turnover. Who's the typical renter profile here, and what's been the actual vacancy rate?
- What's the average days-on-market for RENTAL listings here right now (not sales)? A rising rental-DOM trend means longer vacancies and softer asking-rent achievability than the comps imply.
- What's the recent tenant-quality profile in this submarket — average credit score on applications, eviction rate, late-payment / NSF rate, and stable-employment percentage? A property-management company in the area should have these aggregated.
- How much new for-sale + rental construction is in the pipeline within 1–3 miles? Heavy new supply typically softens prices + rents 12–24 months out; constrained supply supports both.
Investment metrics
- 1% rule
- 0.94% ✗
- Cap rate
- 7.80%
- Cash-on-cash
- 5.39%
- DSCR
- 1.24
- GRM
- 8.9
CMA / ARV
- ARV (median comp)
- $182,578
- List price
- $145,000
- Delta
- -20.58%
- Verdict
- UNDERPRICED
- Comps
- 4 within 1.0 mi
Projected returns pro-forma
-0.05% appreciation · 3.0% rent growth · sell at horizon
- IRR
- 3.6%
- Equity multiple
- 1.17×
- Total profit
- $6,967
- Equity at exit
- $41,710
- IRR
- 9.0%
- Equity multiple
- 1.97×
- Total profit
- $39,452
- Equity at exit
- $49,825
Cash invested: $40,600 (down + closing). Projections, not guarantees.
Landlord ↔ Tenant lean methodology
- Overall (STATE)
- 83 Strongly Landlord-Friendly
- State Kentucky
- 83 Strongly Landlord-Friendly · R+16
- County
- — inherits STATE
- City
- — inherits STATE
ZIP-level market 42544
- Home prices YoY
- -0.0%
- Active inventory
- 172
- Price-to-rent
- 8.9×
Monthly cashflow live
- Estimated rent
- $1,362 medium interval (Pro) →
- Mortgage (P&I)
- −$760
- Tax from tax record
- −$72 /mo · $868/yr
- Insurance
- −$60
- HOA
- −$0
- Vacancy / Maint / Mgmt
- −$286
- Net cashflow
- $183
Break-even live
UW: 25.0% down · 7.5% · 30yr · 1.5% tax · 5.0% vac · 8.0% maint · 8.0% mgmt
Financing live
Cash to close
- Down payment
- $36,250
- Closing costs
- $4,350
- Reserves months
- —
- Total cash needed
- —
Loan-product check · same deal, 3 products live
Conventional
25% down · 7.5% · 30yr
- Down + closing
- —
- Monthly P&I
- —
- Monthly cashflow
- —
- DSCR
- —
- Eligible?
- —
Personal DTI + credit; lowest rate.
DSCR
20% down · 8.5% · 30yr
- Down + closing
- —
- Monthly P&I
- —
- Monthly cashflow
- —
- DSCR
- —
- Eligible?
- —
No personal income docs; deal must DSCR.
Hard money
10% down · 12.0% · 12mo
- Down + closing
- —
- Monthly P&I
- —
- Monthly cashflow
- —
- DSCR
- —
- Eligible?
- —
Short-term bridge; refi at stabilization.
Listing history 17 events
-
2026-06-18days on market $145,000 Active 309 DOM
-
2026-06-17days on market $145,000 Active 308 DOM
-
2026-06-16days on market $145,000 Active 307 DOM
-
2026-06-15days on market $145,000 Active 306 DOM
-
2026-06-13days on market $145,000 Active 304 DOM
-
2026-06-12days on market $145,000 Active 303 DOM
-
2026-06-09days on market $145,000 Active 300 DOM
-
2026-06-08days on market $145,000 Active 299 DOM
-
2026-06-07days on market $145,000 Active 298 DOM
-
2026-06-07days on market $145,000 Active 297 DOM
-
2026-06-04days on market $145,000 Active 294 DOM
-
2026-06-02days on market $145,000 Active 293 DOM
-
2026-06-01days on market $145,000 Active 292 DOM
-
2026-05-31days on market $145,000 Active 291 DOM
-
2026-05-31days on market $145,000 Active 290 DOM
-
2025-11-23price $145,000 270-char remark
Show marketing remark (270 chars)
Great Opportunity for a rental or a fixer upper! Amazing location just off of Hwy 80 in Nancy. This home was recently used for a rental and would be fabulous restored back to its original beauty. Featuring 4BRs and 1BA. Just minutes to Lees Ford Marina and Pulaski Park,
-
2025-08-13$159,900 Active 270-char remark
Show marketing remark (270 chars)
Great Opportunity for a rental or a fixer upper! Amazing location just off of Hwy 80 in Nancy. This home was recently used for a rental and would be fabulous restored back to its original beauty. Featuring 4BRs and 1BA. Just minutes to Lees Ford Marina and Pulaski Park,
ⓘ Source: listings_history table (triggers on properties + properties_extension) + one-shot
backfill from property_details.listing_events for pre-trigger history.
Tax reassessment forecast KY · Resets to sale price
- Current annual tax
- $868 · $72/mo
- Projected year-2 tax
- $1,247 · $104/mo
- Expected delta
- +$379/yr (+$32/mo · 43.7%)
ⓘ Screening estimate from a state-policy table — verify with the county assessor before closing.
Climate risk First Street
- Flood 1/10 Low FEMA zone X (unshaded) · 0% chance over 30 yrs
- Wildfire 4/10 Moderate
- Heat 4/10 Moderate 7 d/yr ≥102°F today · 20 d/yr by 30 yrs out
- Wind 3/10 Moderate 6% chance of damaging wind over 30 yrs
- Air quality 1/10 Low 0 unhealthy d/yr today · 0 by 30 yrs out
Nearby sold comps map
Loading sold comps map…
Walkable amenities ~0.75 mi
Loading nearby amenities…
Taxation est. · year 1
- Rental income
- $16,339
- − Mortgage interest
- −$8,122
- − Property taxes
- −$868
- − Insurance
- −$725
- − Repairs & maintenance
- −$1,307
- − Management
- −$1,307
- − Depreciation
- −$4,218
- Taxable loss
- −$209
- Est. tax savings @ 24.0%
- +$50
- After-tax cash flow
- $2,240/yr
For passive investors: Depreciation is non-cash, so a rental often shows a tax loss while cash-flowing — sheltering income. Rental losses are passive: they offset passive income freely, and up to $25,000/yr can offset ordinary (W-2) income if you actively participate and your MAGI is under $100k (phasing out to $0 by $150k); unused losses carry forward. On sale, claimed depreciation is recaptured at up to 25%, and gains may owe capital-gains tax (a 1031 exchange can defer both). Figures are a year-1 estimate at your 24.0% rate — not tax advice; consult a CPA.
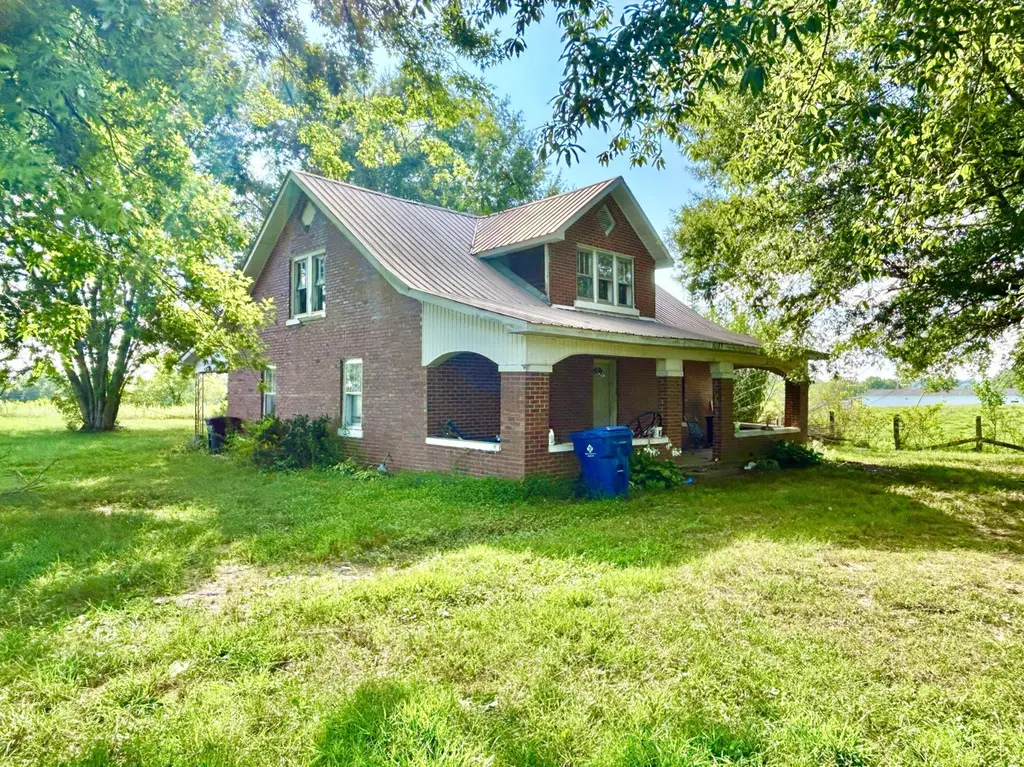
Condition & rehab AI · 7 photos
This property presents a great opportunity for a rental or a fixer-upper. It requires significant exterior and interior work to bring it up to a fair condition.
Repairs flagged
- Major Overgrown vegetation — Blocks view and creates a neglected appearance
- Major Debris — Blocks view and creates a neglected appearance
- Moderate Exterior siding — Appears weathered and in need of cleaning
Value-add opportunities
- Both Landscaping and exterior cleaning — Enhances curb appeal and prepares the property for sale or rental
- Both Interior painting — Improves the home's appearance and can be a quick ROI
- Both Kitchen and bathroom updates — These are common areas that can significantly impact the home's value
Renovation cost estimate screening
| Repair item | Severity | Est. cost |
|---|---|---|
| Overgrown vegetation · Blocks view and creates a neglected appearance | Major | $15,000–50,000 |
| Debris · Blocks view and creates a neglected appearance | Major | $15,000–50,000 |
| Exterior siding · Appears weathered and in need of cleaning | Moderate | $3,000–15,000 |
| Total estimated repair cost · 3 items | $33,000–115,000 |
Value-add ROI direction
- Both Landscaping and exterior cleaning — Enhances curb appeal and prepares the property for sale or rental ↑
- Both Interior painting — Improves the home's appearance and can be a quick ROI ↑
- Both Kitchen and bathroom updates — These are common areas that can significantly impact the home's value ↑
ⓘ Cost ranges are severity-bucket heuristics (US national rule-of-thumb). Get contractor quotes + a written scope before underwriting a rehab budget.
Schools (NCES district)
- District
- Pulaski County
- NCES district ID
- 2104950
- Math proficiency
- 43% ▼ -18.00%
- Reading proficiency
- 53% ▼ -13.00%
- Median HH income
- $35,366
- Composite
- 39.69/100
- National rank
- #3906
- State rank
- #17 of 165 in KY
Livability — Burnside
- Score
- 71/100
- State rank
- #141
- US rank
- #6774
Category grades
Schools grade is shown separately in the Schools card above.
Census & demographics
- Population (ZIP)
- 5,731
Population outlook (Pulaski County) Hauer SSP2
- Today (2025)
- 65,414 people
- By 2030
- 65,828 · +0.6%
- By 2040
- 65,972 · +0.9%
- By 2050
- 65,108 · -0.5%
- By 2075
- 61,647 · -5.8%
- By 2100
- 53,613 · -18.0%
Race, ethnicity, and origin ACS 2023
- Neighborhood character
- Predominantly White (96%)
- Race & ethnicity
- White 96% Asian 2% Two or more races 1%
- Common ancestry
- Serbian 4% Romanian 2% Italian 2%
- Foreign-born
- 1% · Vietnam
- Languages at home
- 98% English-only · Other Indo-European 1% Chinese 1% Vietnamese 1%
Political lean MEDSL · Pulaski
- 2024 margin
- Solid R (+65.2) · D 16.9% · R 82.1% · Other 1.0%
- 2008→2024 swing
- -9.9pp toward R · 2008: -55.4pp · 2024: -65.2pp
- All cycles
- 2024: R+65.2 2020: R+62.7 2016: R+66.7 2012: R+60.5 2008: R+55.4
Not yet ingested
- Civics
- —
Market trends
- HPI YoY
- ▼ -0.05%
- Current HPI
- 273.9998
- Rent YoY
- —
- Metro
- —
- State GDP YoY
- ▲ 1.81%
- F500 in state
- 4
Industry mix (Fortune 500 HQ in KY)
| Industry | F500 HQs | Revenue |
|---|---|---|
| Healthcare | 1 | $118B |
|
||
| Food / Beverage | 1 | $7B |
|
||
Price history
-9.3% since first listed2 events — show timeline
- 2025-11-23 Price Changed $145,000 ImagineMLS
- 2025-08-13 Listed $159,900 ImagineMLS
Property tax history
-2.3%/yrLatest (2025): $868 · -2.3% YoY. Source: county tax records.
Cash-flow waterfall
monthlySold comps — $/sqft
last 12 mo · ≤1 miLoading sold comps…