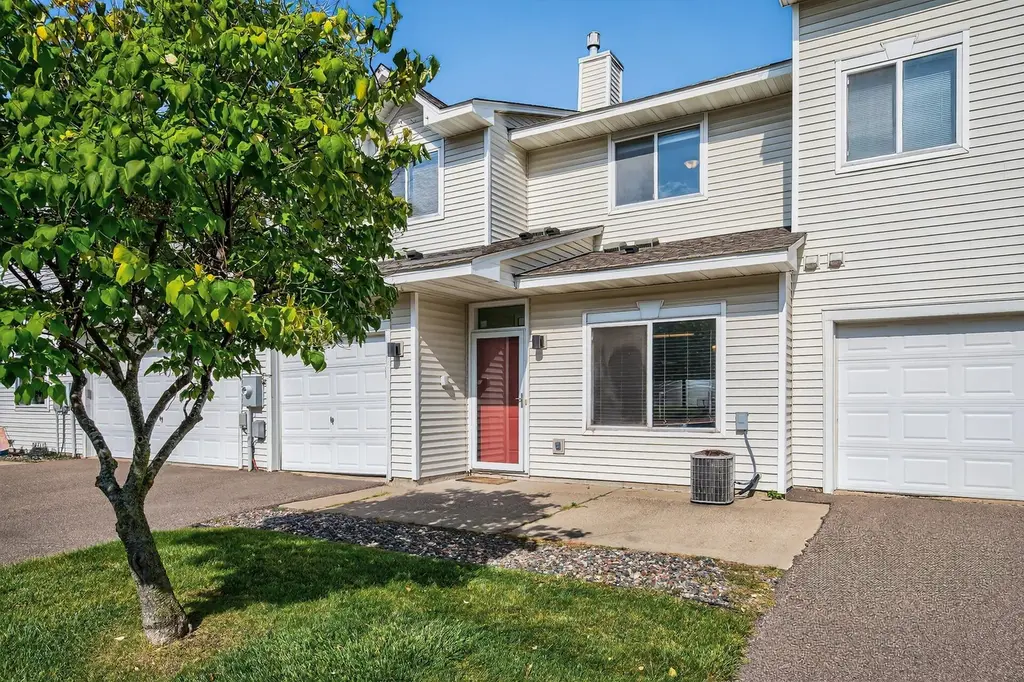
8983 Sawgrass Gln N · Maple Grove, MN
Flood risk 1/10 · Minimal
- FEMA flood zone
- X (unshaded)
- Chance of flooding over 30 yrs
- 0.0%
- Est. flood insurance / yr
- $507 – $1,088
Fire risk 1/10 · Minimal
- Est. fire insurance / yr
- $888 – $1,650
Heat risk 2/10 · Minimal
- Hot days now (above 99°F)
- 7 days/yr
- Hot days in 30 yrs
- 14 days/yr
Wind risk 2/10 · Minimal
- Chance of severe wind over 30 yrs
- —
Air-quality risk 2/10 · Minimal
- Unhealthy air days now
- 1 days/yr
- Unhealthy air days in 30 yrs
- 1 days/yr
Risk factors via First Street. Map © Google.
Why this score? — see what drove the C- grade
The composite is a weighted blend of 9 inputs, each scored 0–100. Each bar is that input's sub-score; the figure is the points it added to the 100-point composite (weight × sub-score).
- ARV discount +15.0/15.0
- Cash flow +12.1/30.0
- 1% rule +5.4/10.0
- Schools +4.2/10.0
- Rent growth +4.0/5.0
- Livability +4.0/5.0
- DSCR +3.6/10.0
- Condition / age +2.5/5.0
- Appreciation +0.0/10.0
$215,000
🖨 Deal sheet 📄 Offer letter ✓ Due diligence
Listing remarks
Welcome to this bright and inviting 2-bedroom, 2-bath townhome located in a quiet and well-kept MapleGrove neighborhood. Offering 1,267 sq. ft. of comfortable living space, this home features an open-concept main level and large windows that fill the space with warm, natural light. The kitchen provides plenty of counter and cabinet space, along with a breakfast bar that flows seamlessly into the dining and living areas perfect for everyday living or hosting friends and family. Both bedrooms are spacious with ample closet storage, and the bathrooms are well-maintained and functional. Enjoy the convenience of in-unit laundry and an attached 1-car garage. Relax outdoors on your private patio,
Key facts
- Large windows
- In-unit laundry
- Private patio
Tags
Property features AI
Finance
- Other: Above-grade finished area approximately 1,267; Main level finished area approximately 780; Living area listed as 1,267 square feet
- HOA & community: HOA: Cities Management; Monthly association fee of $365; HOA covers hazard insurance, lawn care, grounds maintenance, professional management, sewer, snow removal, and water; No association amenities listed
Exterior
- Parking: Attached garage with garage door opener; Asphalt driveway; 1-car garage
- Utilities: City water (connected); City sewer (connected); Natural gas; Electric with circuit breakers
- Home design: Attached residential property; Two levels
- Construction: Block foundation; Foundation area approximately 780
- Exterior features: Vinyl exterior; No pool; No fencing; Irregular lot with light tree coverage; Association-maintained road
Interior
- Kitchen: Range; Microwave; Dishwasher; Refrigerator
- Bedrooms: 2 bedrooms (both on the upper level)
- Bathrooms: One full bathroom (upper level); Half bathroom on the main floor; Primary features a walk-through layout
- Heating & cooling: Forced air heating; Central air conditioning
- Interior features: Living/dining room; Gas fireplace in living room; Walk-in closet
- Laundry & utility: Washer and dryer included; Main level laundry
Neighborhood map
What this means for you Summary
Snapshot
- This is a 2-bed/1.5-bath condo listed at $215k.
Deal economics
- At list price, monthly cash flow is $-47 ($-560/yr) — negative.
- To cash-flow at today's rent, offer at most $207k (3.8% below list).
- Meets the 1% rule at list price ($2k rent vs $215k).
- Recommended offer: $207k (3.8% below list) — sets the bar for cash-flow.
- Cap rate 6.0% vs local median 3.4% in Maple Grove — top-decile yield for the area; either an underpriced asset or a hidden risk that comps aren't pricing in. Stress-test before assuming the spread holds.
Location & tenants
- Location reads 81/100 on livability (#54 in MN, #1,353 nationally) — a professional / high-income tenant draw. Strengths: commute A+, employment A+, housing A+; Watch: amenities D, cost of living D.
- Osseo Public School District (suburban): math 42% / reading 51% proficiency, ranked #129 of 301 in MN (top 43%) — families likely to look elsewhere, expect single-tenant / working-renter base with shorter leases.
- Market conditions: Rents rising fast (+5.9%/yr); 300 active listings in the ZIP; 3 comparable units currently listed for rent nearby; rentals at typical pace (median 15d on market — plan ~3-4 weeks tenant-placement turnaround); high-income renter base; 4,651 units permitted in Hennepin County in 2024 (2,443 in 5+ unit buildings).
- This rent is only 17% of the median local income ($154k/yr) — well below the 30% rent-burden line; pricing power to push rent on renewal without tenant pushback.
Forward outlook
- Local home prices are declining (-3.0%/yr); year-one equity from $1k of loan paydown is wiped out by about $6k of value loss. Plan a longer hold.
- Hennepin County population projected at +30% by 2050 — long-run rental-demand tailwind backs the buy-and-hold thesis.
Negotiation context
- It's been on market 22 days — a 2% lower offer ($212k) is reasonable based on typical stale-listing flexibility.
- 9 sale attempts since 23y ago; this cycle's ask has dropped $13k (6%) from the opening price — seller is motivated, your offer sets the floor, not the list.
Questions for the listing agent
- What do current leases actually rent for vs. the listed asking? Can we see a recent rent roll and the last 12 months of T-12 income?
- What does the HOA fee cover, when was the last increase, and are there any pending special assessments or reserve-fund shortfalls?
- Any open or pending special assessments — roof, HVAC, plumbing, elevator, façade? What's the per-unit balance and payoff schedule, and is the seller paying it off at close or rolling it to the buyer?
- Is there a deadline driving the sale (1031 exchange, divorce, estate, relocation)? That informs how much negotiation room exists.
- Schools are A-rated — typically a magnet for longer-tenancy family renters. What's the average tenant stay here, and is there a school-zone premium baked into asking?
- What's the average days-on-market for RENTAL listings here right now (not sales)? A rising rental-DOM trend means longer vacancies and softer asking-rent achievability than the comps imply.
- What's the recent tenant-quality profile in this submarket — average credit score on applications, eviction rate, late-payment / NSF rate, and stable-employment percentage? A property-management company in the area should have these aggregated.
- How much new apartment / multifamily construction is in the pipeline within 1–3 miles? Heavy new supply (>2% of stock underway) typically softens rents 12–24 months out; light construction supports rent growth.
Investment metrics
- 1% rule
- 1.04% ✓
- Cap rate
- 6.03%
- Cash-on-cash
- -0.93%
- DSCR
- 0.96
- GRM
- 8.0
CMA / ARV
- ARV (median comp)
- $329,610
- List price
- $215,000
- Delta
- -30.52%
- Verdict
- UNDERPRICED
- Comps
- 1 within 2.0 mi
Projected returns pro-forma
-3.0% appreciation · 5.86% rent growth · sell at horizon
- IRR
- -13.9%
- Equity multiple
- 0.49×
- Total profit
- $-30,964
- Equity at exit
- $32,057
- IRR
- -0.2%
- Equity multiple
- 0.98×
- Total profit
- $-1,059
- Equity at exit
- $18,589
Cash invested: $60,200 (down + closing). Projections, not guarantees.
Landlord ↔ Tenant lean methodology
- Overall (STATE)
- 46 Balanced
- State Minnesota
- 46 Balanced · D+2
- County
- — inherits STATE
- City
- — inherits STATE
ZIP-level market 55311
- Rents YoY
- 5.9%
- Active inventory
- 300
- Price-to-rent
- 8.0×
Monthly cashflow live
- Estimated rent
- $2,234 medium interval (Pro) →
- Mortgage (P&I)
- −$1,127
- Tax from tax record
- −$230 /mo · $2,758/yr
- Insurance
- −$90
- HOA
- −$365
- Vacancy / Maint / Mgmt
- −$469
- Net cashflow
- $-47
Break-even live
UW: 25.0% down · 7.5% · 30yr · 1.5% tax · 5.0% vac · 8.0% maint · 8.0% mgmt
Financing live
Cash to close
- Down payment
- $53,750
- Closing costs
- $6,450
- Reserves months
- —
- Total cash needed
- —
Loan-product check · same deal, 3 products live
Conventional
25% down · 7.5% · 30yr
- Down + closing
- —
- Monthly P&I
- —
- Monthly cashflow
- —
- DSCR
- —
- Eligible?
- —
Personal DTI + credit; lowest rate.
DSCR
20% down · 8.5% · 30yr
- Down + closing
- —
- Monthly P&I
- —
- Monthly cashflow
- —
- DSCR
- —
- Eligible?
- —
No personal income docs; deal must DSCR.
Hard money
10% down · 12.0% · 12mo
- Down + closing
- —
- Monthly P&I
- —
- Monthly cashflow
- —
- DSCR
- —
- Eligible?
- —
Short-term bridge; refi at stabilization.
Rent comps 3 comps
| Address | Beds | Baths | Sqft | Rent | $/sqft | DOM | Units | Dist |
|---|---|---|---|---|---|---|---|---|
| 18037 96th Ave N Maple Grove, MN | 2.0 | 2.0 | 1597 | $2,150 | $1.35 | 17d | 1 | 0.95mi |
| 9585 Queensland Ln N Maple Grove, MN | 2.0 | 2.0 | 1489 | $2,195 | $1.47 | 14d | 1 | 0.96mi |
| 9325 Garland Ave Maple Grove, MN | 1.0–3.0 | 1.0–2.0 | 1059 | $2,168 | $2.05 | 1d | 20 | 1.28mi |
HOA detail condo
- Monthly dues
- $365 · $4,380/yr
- Assessments
- None detected in remarks — confirm with the listing agent.
Listing history 46 events
-
2026-06-18days on market $215,000 Active 22 DOM
-
2026-06-17days on market $215,000 Active 21 DOM
-
2026-06-16days on market $215,000 Active 20 DOM
-
2026-06-15days on market $215,000 Active 19 DOM
-
2026-06-13pricedays on market $215,000 Active 17 DOM
-
2026-06-09days on market $228,000 Active 13 DOM
-
2026-06-08days on market $228,000 Active 12 DOM
-
2026-06-07days on market $228,000 Active 11 DOM
-
2026-06-04days on market $228,000 Active 8 DOM
-
2026-06-03days on market $228,000 Active 7 DOM
-
2026-06-02days on market $228,000 Active 6 DOM
-
2026-06-01days on market $228,000 Active 5 DOM
-
2026-05-31days on market $228,000 Active 4 DOM
-
2026-04-29price $229,000 940-char remark
-
2026-04-09historical
-
2026-04-08$234,000 Active 940-char remark
-
2026-02-25price $240,000
-
2026-02-17$249,000 Active
-
2023-04-18soldstatus $231,000
-
2023-04-17soldstatus $238,000 Sold
-
2023-03-18status Pending
-
2023-03-16status Active
-
2023-03-13status Pending
-
2023-03-03price $235,000
-
2023-02-25price $237,500
-
2023-02-19price $239,900
-
2023-02-07price $242,000
-
2023-01-15price $244,900
-
2022-12-31price $252,000
-
2022-12-07$259,000 Active
-
2022-12-04historical $259,000
-
2020-01-28soldstatus $184,000
-
2019-03-29soldstatus $184,000 Sold
-
2019-03-05status Pending
-
2019-02-28price $187,000
-
2019-02-05$189,000 Active
-
2018-11-21soldstatus $170,500
-
2006-02-02soldstatus $170,000
-
2003-12-17soldstatus $155,500
-
2003-11-14soldstatus $155,500
-
2003-09-22historical
-
2003-09-04$157,500
-
2003-09-03historical
-
2003-08-07$159,900
-
2003-08-01historical
-
2003-06-06$159,999
ⓘ Source: listings_history table (triggers on properties + properties_extension) + one-shot
backfill from property_details.listing_events for pre-trigger history.
Tax reassessment forecast MN · Partial reset (capped growth)
- Current annual tax
- $2,758 · $230/mo
- Projected year-2 tax
- $2,758 · $230/mo
- Expected delta
- $0/yr ($0/mo · 0.0%)
ⓘ Screening estimate from a state-policy table — verify with the county assessor before closing.
Climate risk First Street
- Flood 1/10 Low FEMA zone X (unshaded) · 0% chance over 30 yrs
- Wildfire 1/10 Low
- Heat 2/10 Low 7 d/yr ≥99°F today · 14 d/yr by 30 yrs out
- Wind 2/10 Low
- Air quality 2/10 Low 1 unhealthy d/yr today · 1 by 30 yrs out
Nearby sold comps map
Loading sold comps map…
Walkable amenities ~0.75 mi
Loading nearby amenities…
Taxation est. · year 1
- Rental income
- $26,813
- − Mortgage interest
- −$12,043
- − Property taxes
- −$2,758
- − Insurance
- −$1,075
- − Repairs & maintenance
- −$2,145
- − Management
- −$2,145
- − HOA
- −$4,380
- − Depreciation
- −$6,255
- Taxable loss
- −$3,987
- Est. tax savings @ 24.0%
- +$957
- After-tax cash flow
- $397/yr
For passive investors: Depreciation is non-cash, so a rental often shows a tax loss while cash-flowing — sheltering income. Rental losses are passive: they offset passive income freely, and up to $25,000/yr can offset ordinary (W-2) income if you actively participate and your MAGI is under $100k (phasing out to $0 by $150k); unused losses carry forward. On sale, claimed depreciation is recaptured at up to 25%, and gains may owe capital-gains tax (a 1031 exchange can defer both). Figures are a year-1 estimate at your 24.0% rate — not tax advice; consult a CPA.
Schools (NCES district)
- District
- Osseo Public School District
- NCES district ID
- 2725200
- Math proficiency
- 42% ▼ -7.00%
- Reading proficiency
- 51% ▼ -4.00%
- Median HH income
- $76,168
- Composite
- 42.35/100
- National rank
- #3250
- State rank
- #129 of 301 in MN
Livability — Maple Grove
- Score
- 81/100
- State rank
- #54
- US rank
- #1353
Category grades
Schools grade is shown separately in the Schools card above.
Census & demographics
- Census place
- Maple Grove, MN
- County
- Hennepin County · 1,150,272 people
- City population
- 77,762
- Metro
- Minneapolis-St. Paul-Bloomington, MN-WI
- Population (ZIP)
- 38,472
- Household income
- $153,568
- Rent vs Own
- Severe rent burden
- 497.0
Population outlook (Hennepin County) Hauer SSP2
- Today (2025)
- 1,405,227 people
- By 2030
- 1,492,650 · +6.2%
- By 2040
- 1,660,157 · +18.1%
- By 2050
- 1,823,498 · +29.8%
- By 2075
- 2,221,283 · +58.1%
- By 2100
- 2,509,976 · +78.6%
Race, ethnicity, and origin ACS 2023
- Neighborhood character
- Predominantly White (80%)
- Race & ethnicity
- White 80% Asian 8% Black 7% Two or more races 3% Hispanic / Latino 1%
- Common ancestry
- Portuguese 12% Lithuanian 4% Romanian 4%
- Foreign-born
- 12% · Canada, Vietnam, South Korea
- Languages at home
- 87% English-only · Other Indo-European 3% Vietnamese 1% Chinese 1%
Political lean MEDSL · Hennepin
- 2024 margin
- Solid D (+42.6) · D 70.2% · R 27.5% · Other 2.3%
- 2008→2024 swing
- +14.0pp toward D · 2008: 28.6pp · 2024: 42.6pp
- All cycles
- 2024: D+42.6 2020: D+43.2 2016: D+35.3 2012: D+27.1 2008: D+28.6
Not yet ingested
- Civics
- —
Market trends
- HPI YoY
- ▼ -181.69%
- Current HPI
- 213.3896
- Rent YoY
- ▲ 5.86%
- Metro
- Minneapolis-St. Paul-Bloomington, MN-WI
- State GDP YoY
- ▲ 2.41%
- F500 in state
- 34
Industry mix (Fortune 500 HQ in MN)
| Industry | F500 HQs | Revenue |
|---|---|---|
| Healthcare | 2 | $407B |
|
||
| Retail | 2 | $150B |
|
||
| Consumer Goods | 2 | $32B |
|
||
| Industrial Machinery | 2 | $6B |
|
||
| Agriculture | 1 | $40B |
|
||
| Healthcare / Medical Devices | 1 | $32B |
|
||
Price history
+34.4% since first listed36 events — show timeline
- 2026-06-10 Price Changed $215,000 NORTHSTARMLS as Distributed by MLS Grid
- 2026-05-27 Listing Removed — NORTHSTARMLS as Distributed by MLS Grid
- 2026-05-27 Listed $228,000 NORTHSTARMLS as Distributed by MLS Grid
- 2026-04-29 Price Changed $229,000 NORTHSTARMLS as Distributed by MLS Grid
- 2026-04-09 Listing Removed — NORTHSTARMLS as Distributed by MLS Grid
- 2026-04-08 Listed $234,000 NORTHSTARMLS as Distributed by MLS Grid
- 2026-02-25 Price Changed $240,000 NORTHSTARMLS as Distributed by MLS Grid
- 2026-02-17 Listed $249,000 NORTHSTARMLS as Distributed by MLS Grid
- 2023-04-18 Sold (Public Records) $231,000 Public Records
- 2023-04-17 Sold (MLS) $238,000 NORTHSTARMLS as Distributed by MLS Grid
- 2023-03-18 Pending — NORTHSTARMLS as Distributed by MLS Grid
- 2023-03-16 Relisted — NORTHSTARMLS as Distributed by MLS Grid
- 2023-03-13 Pending — NORTHSTARMLS as Distributed by MLS Grid
- 2023-03-03 Price Changed $235,000 NORTHSTARMLS as Distributed by MLS Grid
- 2023-02-25 Price Changed $237,500 NORTHSTARMLS as Distributed by MLS Grid
- 2023-02-19 Price Changed $239,900 NORTHSTARMLS as Distributed by MLS Grid
- 2023-02-07 Price Changed $242,000 NORTHSTARMLS as Distributed by MLS Grid
- 2023-01-15 Price Changed $244,900 NORTHSTARMLS as Distributed by MLS Grid
- 2022-12-31 Price Changed $252,000 NORTHSTARMLS as Distributed by MLS Grid
- 2022-12-07 Listed $259,000 NORTHSTARMLS as Distributed by MLS Grid
- 2022-12-04 Coming Soon $259,000 NORTHSTARMLS as Distributed by MLS Grid
- 2020-01-28 Sold (Public Records) $184,000 Public Records
- 2019-03-29 Sold (MLS) $184,000 NORTHSTARMLS as Distributed by MLS Grid
- 2019-03-05 Pending — NORTHSTARMLS as Distributed by MLS Grid
- 2019-02-28 Price Changed $187,000 NORTHSTARMLS as Distributed by MLS Grid
- 2019-02-05 Listed $189,000 NORTHSTARMLS as Distributed by MLS Grid
- 2018-11-21 Sold (Public Records) $170,500 Public Records
- 2006-02-02 Sold (Public Records) $170,000 Public Records
- 2003-12-17 Sold (Public Records) $155,500 Public Records
- 2003-11-14 Sold (MLS) $155,500 NORTHSTARMLS as Distributed by MLS Grid
- 2003-09-22 Listing Removed — NORTHSTARMLS as Distributed by MLS Grid
- 2003-09-04 Listed $157,500 NORTHSTARMLS as Distributed by MLS Grid
- 2003-09-03 Listing Removed — NORTHSTARMLS as Distributed by MLS Grid
- 2003-08-07 Listed $159,900 NORTHSTARMLS as Distributed by MLS Grid
- 2003-08-01 Listing Removed — NORTHSTARMLS as Distributed by MLS Grid
- 2003-06-06 Listed $159,999 NORTHSTARMLS as Distributed by MLS Grid
Property tax history
+4.4%/yrLatest (2025): $2,758 · -10.9% YoY. Source: county tax records.
Cash-flow waterfall
monthlySold comps — $/sqft
last 12 mo · ≤1 miLoading sold comps…