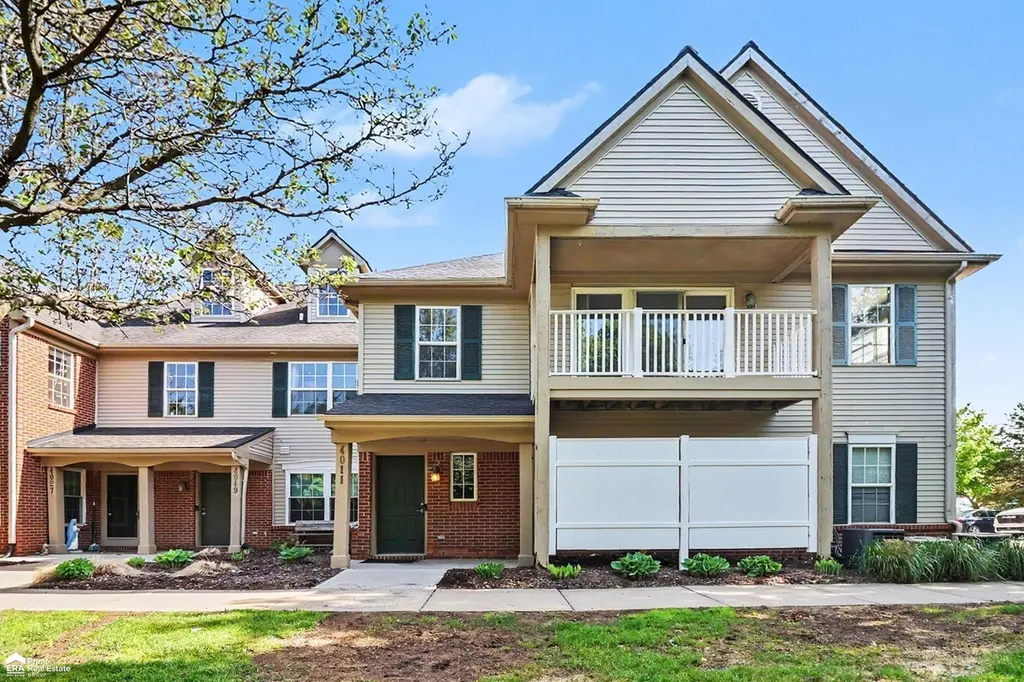
4011 Hampton Ridge Blvd · Howell, MI
Flood risk 1/10 · Minimal
- FEMA flood zone
- X (unshaded)
- Chance of flooding over 30 yrs
- 0.0%
- Est. flood insurance / yr
- $507 – $1,088
Fire risk 1/10 · Minimal
- Est. fire insurance / yr
- $784 – $1,456
Heat risk 3/10 · Minor
- Hot days now (above 96°F)
- 7 days/yr
- Hot days in 30 yrs
- 15 days/yr
Wind risk 2/10 · Minimal
- Chance of severe wind over 30 yrs
- —
Air-quality risk 2/10 · Minimal
- Unhealthy air days now
- 1 days/yr
- Unhealthy air days in 30 yrs
- 2 days/yr
Risk factors via First Street. Map © Google.
Why this score? — see what drove the D grade
The composite is a weighted blend of 9 inputs, each scored 0–100. Each bar is that input's sub-score; the figure is the points it added to the 100-point composite (weight × sub-score).
- Cash flow +11.9/30.0
- ARV discount +7.5/15.0
- 1% rule +5.1/10.0
- Schools +4.1/10.0
- Livability +3.9/5.0
- DSCR +3.5/10.0
- Rent growth +2.5/5.0
- Condition / age +2.5/5.0
- Appreciation +0.0/10.0
$199,900
🖨 Deal sheet (PDF) 📄 Offer letter ✓ Due diligence
Listing remarks MLS
Welcome home to this beautifully maintained second-story end-unit condo offering 1,228 square feet of comfortable and stylish living space. Featuring 2 spacious bedrooms and 1 full bath, this inviting home showcases a gorgeous kitchen with a bar, a beautifully tiled shower, and a large pantry perfect for extra storage and everyday convenience. The oversized primary bedroom offers abundant closet space, creating a true private retreat. Enjoy the added benefit of a 1-car attached garage, a private balcony ideal for relaxing mornings or evenings, and the privacy that comes with an end-unit location. The HOA covers exterior maintenance, allowing for low-maintenance living while you take advantage of the community’s fantastic amenities including a sparkling pool, clubhouse, and playground. Conveniently located close to shopping, dining, and everyday amenities, this condo offers the perfect blend of comfort, convenience, and lifestyle. All appliances stay. Subject to bankruptcy court approval.
Key facts
- Clubhouse
- Private balcony
- Gorgeous kitchen
Tags
Property features AI
Finance
- Other: Approx. 1,228 square feet above grade
- HOA & community: Homeowners association with monthly fee of $340
Exterior
- Parking: Attached garage with direct access (1 car)
- Utilities: Public water; Public sewer
- Home design: Residential condominium; One level
- Construction: Brick and vinyl siding exterior; Slab foundation
- Exterior features: Balcony; In-ground pool; Paved road access
Interior
- Bathrooms: One full bathroom
- Heating & cooling: Central air conditioning; Forced air heating with natural gas
- Interior features: Total of 7 rooms
Neighborhood map
What this means for you Summary
Snapshot
- This is a 2-bed/1.0-bath condo listed at $200k.
Deal economics
- At list price, monthly cash flow is $-52 ($-624/yr) — negative.
- To cash-flow at today's rent, offer at most $191k (4.6% below list).
- Meets the 1% rule at list price ($2k rent vs $200k).
- Recommended offer: $191k (4.6% below list) — sets the bar for cash-flow.
- Cap rate 6.0% vs local median 3.4% in Howell — top-decile yield for the area; either an underpriced asset or a hidden risk that comps aren't pricing in. Stress-test before assuming the spread holds.
Location & tenants
- Location reads 78/100 on livability (#107 in MI, #2,598 nationally) — a middle-class / working-renter tenant base. Strengths: crime A+, cost of living A+, housing A+; Watch: commute F.
- Howell Public Schools (suburban): math 41% / reading 52% proficiency, ranked #116 of 540 in MI (top 22%) — families likely to look elsewhere, expect single-tenant / working-renter base with shorter leases.
- Zoned schools: Ruahmah J Hutchings Elementary (math 57% / reading 42%, grade D, #382 of 1,397 statewide, top 30%, 468 students, 22% FRL); Parker Middle School (math 38% / reading 53%, grade D+, #161 of 493 statewide, top 33%, 741 students, 34% FRL); Howell High School (math 36% / reading 60%, grade D, #183 of 713 statewide, top 26%, 2,024 students, 25% FRL) — zoned schools at 27% FRL track the district average.
- Market conditions: 345 active listings in the ZIP; 5 comparable units currently listed for rent nearby; rentals leasing fast (median 0d on market — plan ~1-2 weeks tenant-placement turnaround); solid renter incomes; 488 units permitted in Livingston County in 2024 (0 in 5+ unit buildings).
Forward outlook
- Local home prices are declining (-3.0%/yr); year-one equity from $1k of loan paydown is wiped out by about $6k of value loss. Plan a longer hold.
- Livingston County population projected at +7% by 2050 — modest demand growth; plan on rents tracking national, not racing it.
Negotiation context
- It's been on market 29 days — a 2% lower offer ($197k) is reasonable based on typical stale-listing flexibility.
- 6 sale attempts since 21y ago with the ask held roughly flat each time — persistent listings suggest the price (not the market) is what's stuck; bring a comps-based counter.
- Current owner paid $115k; list at $200k implies a 74% gain — meaningful room to come down on a strong offer.
Questions for the listing agent
- What do current leases actually rent for vs. the listed asking? Can we see a recent rent roll and the last 12 months of T-12 income?
- What does the HOA fee cover, when was the last increase, and are there any pending special assessments or reserve-fund shortfalls?
- Any open or pending special assessments — roof, HVAC, plumbing, elevator, façade? What's the per-unit balance and payoff schedule, and is the seller paying it off at close or rolling it to the buyer?
- Is there a deadline driving the sale (1031 exchange, divorce, estate, relocation)? That informs how much negotiation room exists.
- The area grade is low — what's the realistic commute time and amenity access for the typical tenant pool here? Any planned neighborhood developments (good or bad) we should know about?
- What's the average days-on-market for RENTAL listings here right now (not sales)? A rising rental-DOM trend means longer vacancies and softer asking-rent achievability than the comps imply.
- What's the recent tenant-quality profile in this submarket — average credit score on applications, eviction rate, late-payment / NSF rate, and stable-employment percentage? A property-management company in the area should have these aggregated.
- How much new apartment / multifamily construction is in the pipeline within 1–3 miles? Heavy new supply (>2% of stock underway) typically softens rents 12–24 months out; light construction supports rent growth.
Investment metrics
- 1% rule
- 1.01% ✓
- Cap rate
- 5.98%
- Cash-on-cash
- -1.12%
- DSCR
- 0.95
- GRM
- 8.3
CMA / ARV
No comps found within radius.
Projected returns pro-forma
-3.0% appreciation · 3.0% rent growth · sell at horizon
- IRR
- -18.0%
- Equity multiple
- 0.37×
- Total profit
- $-35,515
- Equity at exit
- $29,806
- IRR
- -10.0%
- Equity multiple
- 0.39×
- Total profit
- $-34,415
- Equity at exit
- $17,284
Cash invested: $55,972 (down + closing). Projections, not guarantees.
Landlord ↔ Tenant lean methodology
- Overall (STATE)
- 62 Landlord-Friendly
- State Michigan
- 62 Landlord-Friendly · EVEN
- County
- — inherits STATE
- City
- — inherits STATE
ZIP-level market 48843
- Active inventory
- 345
- Price-to-rent
- 8.3×
Monthly cashflow live
- Estimated rent
- $2,015 high interval (Pro) →
- Mortgage (P&I)
- −$1,048
- Tax from tax record
- −$172 /mo · $2,070/yr
- Insurance
- −$83
- HOA
- −$340
- Vacancy / Maint / Mgmt
- −$423
- Net cashflow
- $-52
Break-even live
Sensitivity live
| Price | -10% $61 | -5% $5 | +0% $-52 | +5% $-109 | +10% $-165 |
|---|---|---|---|---|---|
| Rent | -10% $-211 | -5% $-132 | +0% $-52 | +5% $28 | +10% $107 |
| Rate | -1.0pp $49 | -0.5pp $-1 | base $-52 | +0.5pp $-104 | +1.0pp $-157 |
UW: 25.0% down · 7.5% · 30yr · 1.5% tax · 5.0% vac · 8.0% maint · 8.0% mgmt
Financing live
Cash to close
- Down payment
- $49,975
- Closing costs
- $5,997
- Reserves months
- —
- Total cash needed
- —
Loan-product check · same deal, 3 products live
Conventional
25% down · 7.5% · 30yr
- Down + closing
- —
- Monthly P&I
- —
- Monthly cashflow
- —
- DSCR
- —
- Eligible?
- —
Personal DTI + credit; lowest rate.
DSCR
20% down · 8.5% · 30yr
- Down + closing
- —
- Monthly P&I
- —
- Monthly cashflow
- —
- DSCR
- —
- Eligible?
- —
No personal income docs; deal must DSCR.
Hard money
10% down · 12.0% · 12mo
- Down + closing
- —
- Monthly P&I
- —
- Monthly cashflow
- —
- DSCR
- —
- Eligible?
- —
Short-term bridge; refi at stabilization.
Rent comps 5 comps
| Address | Beds | Baths | Sqft | Rent | $/sqft | DOM | Units | Dist |
|---|---|---|---|---|---|---|---|---|
| 4046 Kirkway Ct Unit 1 Howell, MI | 2.0 | 1.0 | 1228 | $2,100 | $1.71 | 45d | 1 | 0.06mi |
| 3998 Audrey Rae Ln Howell, MI | 1.0–2.0 | 1.0–2.0 | 893 | $1,920 | $2.15 | 0d | 12 | 0.18mi |
| 979 Arundell Ave Howell, MI | 2.0–3.0 | 2.0 | 1317 | $2,125 | $1.61 | 0d | 7 | 0.55mi |
| 2812 Ontario Ct Howell, MI | 2.0 | 2.0 | 1093 | $1,438 | $1.32 | 0d | 13 | 1.28mi |
| 484 Waverly Cmns Howell, MI | 3.0 | 2.5 | 1200 | $2,000 | $1.67 | 19d | 1 | 1.35mi |
HOA detail condo
- Monthly dues
- $340 · $4,080/yr
- Likely covers
- exterior maint.pool
- Assessments
- None detected in remarks — confirm with the listing agent.
Listing history 29 events
-
2026-06-21days on market $199,900 Active 29 DOM
-
2026-06-18days on market $199,900 Active 26 DOM
-
2026-06-17days on market $199,900 Active 25 DOM
-
2026-06-16days on market $199,900 Active 24 DOM
-
2026-06-15days on market $199,900 Active 23 DOM
-
2026-06-13days on market $199,900 Active 21 DOM
-
2026-06-13days on market $199,900 Active 20 DOM
-
2026-06-09days on market $199,900 Active 17 DOM
-
2026-06-08days on market $199,900 Active 16 DOM
-
2026-06-07days on market $199,900 Active 15 DOM
-
2026-06-04days on market $199,900 Active 12 DOM
-
2026-06-03days on market $199,900 Active 11 DOM
-
2026-06-02days on market $199,900 Active 10 DOM
-
2026-06-01days on market $199,900 Active 9 DOM
-
2026-05-31days on market $199,900 Active 8 DOM
-
2026-05-18$199,900 Active
Show marketing remark (1008 chars)
Welcome home to this beautifully maintained second-story end-unit condo offering 1,228 square feet of comfortable and stylish living space. Featuring 2 spacious bedrooms and 1 full bath, this inviting home showcases a gorgeous kitchen with a bar, a beautifully tiled shower, and a large pantry perfect for extra storage and everyday convenience. The oversized primary bedroom offers abundant closet space, creating a true private retreat. Enjoy the added benefit of a 1-car attached garage, a private balcony ideal for relaxing mornings or evenings, and the privacy that comes with an end-unit location. The HOA covers exterior maintenance, allowing for low-maintenance living while you take advantage of the community’s fantastic amenities including a sparkling pool, clubhouse, and playground. Conveniently located close to shopping, dining, and everyday amenities, this condo offers the perfect blend of comfort, convenience, and lifestyle. All appliances stay. Subject to bankruptcy court approval.
-
2026-05-18$199,900 Active 1008-char remark
Show marketing remark (1008 chars)
Welcome home to this beautifully maintained second-story end-unit condo offering 1,228 square feet of comfortable and stylish living space. Featuring 2 spacious bedrooms and 1 full bath, this inviting home showcases a gorgeous kitchen with a bar, a beautifully tiled shower, and a large pantry perfect for extra storage and everyday convenience. The oversized primary bedroom offers abundant closet space, creating a true private retreat. Enjoy the added benefit of a 1-car attached garage, a private balcony ideal for relaxing mornings or evenings, and the privacy that comes with an end-unit location. The HOA covers exterior maintenance, allowing for low-maintenance living while you take advantage of the community’s fantastic amenities including a sparkling pool, clubhouse, and playground. Conveniently located close to shopping, dining, and everyday amenities, this condo offers the perfect blend of comfort, convenience, and lifestyle. All appliances stay. Subject to bankruptcy court approval.
-
2018-12-24historical
-
2017-08-09soldstatus $115,000
-
2017-08-07soldstatus $115,000 Sold
-
2017-08-07soldstatus $115,000 Closed
-
2017-06-14status Pending
-
2017-06-14status Pending
-
2017-05-31$114,900 Active
-
2017-05-31$114,900 Active
-
2010-12-06historical
-
2005-06-20$145,000
-
2005-06-20$145,000
-
2002-05-21soldstatus $139,000
ⓘ Source: listings_history table (triggers on properties + properties_extension) + one-shot
backfill from property_details.listing_events for pre-trigger history.
Tax reassessment forecast MI · Partial reset (capped growth)
- Current annual tax
- $2,070 · $172/mo
- Projected year-2 tax
- $2,574 · $215/mo
- Expected delta
- +$504/yr (+$42/mo · 24.4%)
ⓘ Screening estimate from a state-policy table — verify with the county assessor before closing.
Climate risk First Street
- Flood 1/10 Low FEMA zone X (unshaded) · 0% chance over 30 yrs
- Wildfire 1/10 Low
- Heat 3/10 Moderate 7 d/yr ≥96°F today · 15 d/yr by 30 yrs out
- Wind 2/10 Low
- Air quality 2/10 Low 1 unhealthy d/yr today · 2 by 30 yrs out
Nearby sold comps map
Loading sold comps map…
Walkable amenities ~0.75 mi
Loading nearby amenities…
Taxation est. · year 1
- Rental income
- $24,183
- − Mortgage interest
- −$11,198
- − Property taxes
- −$2,070
- − Insurance
- −$1,000
- − Repairs & maintenance
- −$1,935
- − Management
- −$1,935
- − HOA
- −$4,080
- − Depreciation
- −$5,815
- Taxable loss
- −$3,849
- Est. tax savings @ 24.0%
- +$924
- After-tax cash flow
- $299/yr
For passive investors: Depreciation is non-cash, so a rental often shows a tax loss while cash-flowing — sheltering income. Rental losses are passive: they offset passive income freely, and up to $25,000/yr can offset ordinary (W-2) income if you actively participate and your MAGI is under $100k (phasing out to $0 by $150k); unused losses carry forward. On sale, claimed depreciation is recaptured at up to 25%, and gains may owe capital-gains tax (a 1031 exchange can defer both). Figures are a year-1 estimate at your 24.0% rate — not tax advice; consult a CPA.
Schools (NCES district)
- District
- Howell Public Schools
- NCES district ID
- 2618720
- Math proficiency
- 41% ▼ -6.00%
- Reading proficiency
- 52% ▼ -4.00%
- Median HH income
- $66,453
- Composite
- 41.42/100
- National rank
- #3473
- State rank
- #116 of 540 in MI
Livability — Howell
- Score
- 78/100
- State rank
- #107
- US rank
- #2598
Category grades
Schools grade is shown separately in the Schools card above.
Census & demographics
- County
- Livingston County · 121,626 people
- City population
- 48,014
- Metro
- Detroit-Warren-Dearborn, MI
- Population (ZIP)
- 48,014
- Household income
- $94,577
- Rent vs Own
- Severe rent burden
- 644.0
Population outlook (Livingston County) Hauer SSP2
- Today (2025)
- 202,920 people
- By 2030
- 209,173 · +3.1%
- By 2040
- 216,878 · +6.9%
- By 2050
- 217,485 · +7.2%
- By 2075
- 217,590 · +7.2%
- By 2100
- 197,095 · -2.9%
Race, ethnicity, and origin ACS 2023
- Neighborhood character
- Predominantly White (92%)
- Race & ethnicity
- White 92% Hispanic / Latino 4% Two or more races 3%
- Common ancestry
- Romanian 12% Italian 5% Lithuanian 4%
- Foreign-born
- 3% · Canada
- Languages at home
- 96% English-only · Spanish 2% Arabic 1%
Political lean MEDSL · Livingston
- 2024 margin
- Strong R (+23.9) · D 37.4% · R 61.3% · Other 1.3%
- 2008→2024 swing
- -10.7pp toward R · 2008: -13.3pp · 2024: -23.9pp
- All cycles
- 2024: R+23.9 2020: R+22.6 2016: R+29.6 2012: R+23.3 2008: R+13.3
Not yet ingested
- Civics
- —
Market trends
- HPI YoY
- ▼ -326.17%
- Current HPI
- 180.5058
- Rent YoY
- —
- Metro
- Detroit-Warren-Dearborn, MI
- State GDP YoY
- ▲ 1.37%
- F500 in state
- 28
Industry mix (Fortune 500 HQ in MI)
| Industry | F500 HQs | Revenue |
|---|---|---|
| Automotive Parts | 3 | $48B |
|
||
| Automotive | 2 | $372B |
|
||
| Chemicals | 1 | $45B |
|
||
| Automotive Retail | 1 | $29B |
|
||
| Healthcare / Medical Devices | 1 | $23B |
|
||
| Automotive Technology | 1 | $20B |
|
||
Price history
+43.8% since first listed14 events — show timeline
- 2026-05-18 Listed $199,900 REALCOMP
- 2026-05-18 Listed $199,900 MiRealSource-MiMLS
- 2018-12-24 Listing Removed — MiRealSource-MiMLS
- 2017-08-09 Sold (Public Records) $115,000 Public Records
- 2017-08-07 Sold (MLS) $115,000 MiRealSource-MiMLS
- 2017-08-07 Sold (MLS) $115,000 REALCOMP
- 2017-06-14 Pending — MiRealSource-MiMLS
- 2017-06-14 Pending — REALCOMP
- 2017-05-31 Listed $114,900 MiRealSource-MiMLS
- 2017-05-31 Listed $114,900 REALCOMP
- 2010-12-06 Listing Removed — REALCOMP
- 2005-06-20 Listed $145,000 MiRealSource-MiMLS
- 2005-06-20 Listed $145,000 REALCOMP
- 2002-05-21 Sold (Public Records) $139,000 Public Records
Property tax history
+1.9%/yrLatest (2025): $2,070 · +3.4% YoY. Source: county tax records.
Cash-flow waterfall
monthlySold comps — $/sqft
last 12 mo · ≤1 miLoading sold comps…