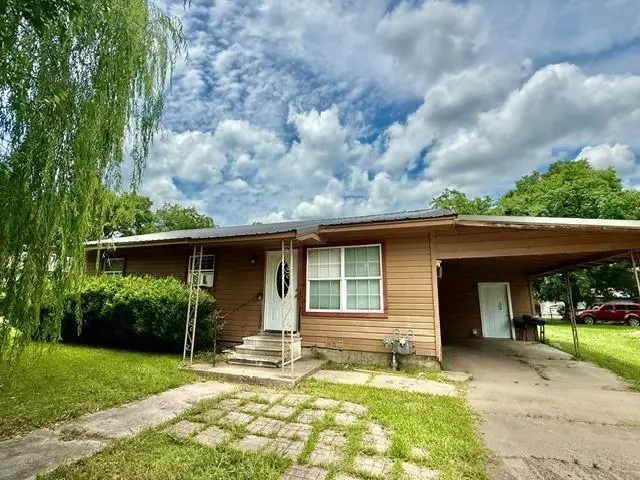
805 W 3rd St · Clarksville, TX
Flood risk 1/10 · Minimal
- FEMA flood zone
- X
- Chance of flooding over 30 yrs
- 0.0%
- Est. flood insurance / yr
- $507 – $1,088
Fire risk 6/10 · Moderate
- Est. fire insurance / yr
- $1,222 – $2,270
Heat risk 7/10 · Major
- Hot days now (above 110°F)
- 7 days/yr
- Hot days in 30 yrs
- 22 days/yr
Wind risk 4/10 · Minor
- Chance of severe wind over 30 yrs
- 18.0%
Air-quality risk 2/10 · Minimal
- Unhealthy air days now
- 0 days/yr
- Unhealthy air days in 30 yrs
- 1 days/yr
Risk factors via First Street. Map © Google.
Why this score? — see what drove the B+ grade
The composite is a weighted blend of 9 inputs, each scored 0–100. Each bar is that input's sub-score; the figure is the points it added to the 100-point composite (weight × sub-score).
- Cash flow +26.7/30.0
- ARV discount +15.0/15.0
- Appreciation +10.0/10.0
- DSCR +9.1/10.0
- 1% rule +7.1/10.0
- Livability +3.4/5.0
- Rent growth +2.5/5.0
- Condition / age +2.5/5.0
- Schools +1.9/10.0
$89,900
🖨 Deal sheet 📄 Offer letter ✓ Due diligence
Listing remarks
Looking for a 1st home or an investment property? Either way, you need to take a look at this spacious, 3 bedroom, 1 bath home on . 34acre lot. Open floor plan with living room into dining area-kitchen. New vinyl plank flooring throughout and new interior paint. Living room is open to accommodate larger pieced of furniture like a sectional. The breakfast-dining area is perfect for your table and chairs and perhaps a hutch. The U-shaped kitchen features electric cookstove and hook-up for the refrigerator, nice countertop workspace and storage. All of the bedrooms are approximately the same size, so choose your fav to make yours. The hall bath is sparkly clean with full tub-shower combinatio
Key facts
- Open floor plan
- U-shaped kitchen
- Outdoor deck
Tags
Property features AI
Finance
- Other: Property is attached (per listing data); Will not subdivide
- Financial info: Accepts cash and conventional financing; Treat as clear loan type; No second mortgage
- HOA & community: No association
Exterior
- Parking: Covered carport (1 covered space); Driveway
- Utilities: City water; City sewer; Co-op electric; Cable available
- Home design: Single family residence; Residential property; One level
- Construction: Built in 1961; Wood construction; Metal roof; Pillar/post/pier foundation
- Exterior features: Deck; Level lot with a large grassy backyard; All-weather road access
Interior
- Kitchen: Electric range
- Bedrooms: 3 bedrooms (all on the main level); Primary bedroom on the main level
- Flooring: Luxury vinyl plank
- Bathrooms: 1 full bathroom
- Heating & cooling: Wall/window cooling units
- Interior features: Eat-in kitchen; One living area; One dining area; Total of 4 rooms
- Laundry & utility: Full-size washer/dryer area; Electric dryer hookup
Neighborhood map
What this means for you Summary
Snapshot
- This is a 3-bed/1.0-bath single-family listed at $90k.
Deal economics
- At list price, monthly cash flow is $242 ($3k/yr) — positive.
- The deal already cash-flows at list — no discount required.
- Meets the 1% rule at list price ($1k rent vs $90k).
- Cap rate 9.5% vs local median 6.1% in Clarksville — top-decile yield for the area; either an underpriced asset or a hidden risk that comps aren't pricing in. Stress-test before assuming the spread holds.
Location & tenants
- Location reads 67/100 on livability (#523 in TX) — a middle-class / working-renter tenant base. Strengths: crime A+, cost of living A+; Watch: schools F, amenities F, commute F.
- Clarksville ISD (town): math 20% / reading 27% proficiency, ranked #752 of 826 in TX (top 91%) — low school quality limits family demand, transient renter base, plan for 1-2y turnover; 77% free/reduced lunch — lower-income household profile, screen leases tightly.
- Market conditions: 87 active listings in the ZIP; 14 units permitted in Red River County in 2024 (0 in 5+ unit buildings).
Forward outlook
- In year one you build about $10k of equity ($622 loan paydown + $9k appreciation (10.0% local appreciation)).
- Red River County population projected at -25% by 2050 — secular population decline; favor cash flow + early exit over multi-decade hold.
- At projected returns (10.0% appreciation + 3.0% rent growth), your $25k cash investment doubles in ~2 years — after that, you're playing with house money.
- By year 4, paydown + projected appreciation supports a ~$34k cash-out refi (75% LTV) — recoverable capital for the next deal without selling this one.
Negotiation context
- Only 9 days on market — expect competitive offers; lowballing is unlikely to land.
Risks & watch-outs
- Climate carrying-cost: major wildfire risk; extreme-heat days projected 7→22/yr by 2055 (HVAC capex compounding) — expect insurance premiums to compound above CPI over the hold.
Questions for the listing agent
- Built in 1961 — when were the roof, HVAC, electrical panel, plumbing, and water heater last replaced?
- Is there a deadline driving the sale (1031 exchange, divorce, estate, relocation)? That informs how much negotiation room exists.
- Schools are F-rated, which usually means shorter tenancies and higher turnover. Who's the typical renter profile here, and what's been the actual vacancy rate?
- What's the average days-on-market for RENTAL listings here right now (not sales)? A rising rental-DOM trend means longer vacancies and softer asking-rent achievability than the comps imply.
- What's the recent tenant-quality profile in this submarket — average credit score on applications, eviction rate, late-payment / NSF rate, and stable-employment percentage? A property-management company in the area should have these aggregated.
- How much new for-sale + rental construction is in the pipeline within 1–3 miles? Heavy new supply typically softens prices + rents 12–24 months out; constrained supply supports both.
Investment metrics
- 1% rule
- 1.21% ✓
- Cap rate
- 9.52%
- Cash-on-cash
- 11.54%
- DSCR
- 1.51
- GRM
- 6.9
CMA / ARV
- ARV (on-the-fly)
- $124,020
- Comps found
- 4
Show comp detail 4 sales within ~0.75 mi
| Address | Dist | Beds/Ba | Sqft | Sold | Price | $/sf | Match |
|---|---|---|---|---|---|---|---|
| 507 W 6th St | 0.24mi | 3/2.0 | 1,145 (-2%) | 13mo | $62,550 | $55 | 70 |
| 1106 W Jackson | 0.37mi | 3/1.0 | 1,116 (-5%) | 21mo | $150,000 | $134 | 58 |
| 1304 S Locust | 0.38mi | 3/2.0 | 1,278 (+9%) | 14mo | $136,000 | $106 | 51 |
| 504 W College | 0.19mi | 2/1.0 (-1) | 1,020 (-13%) | 20mo | $17,500 | $17 | 48 |
Match score weights: distance 35% · size 25% · config 20% · recency 20%. Top-matched comps best support the ARV.
Projected returns pro-forma
10.0% appreciation · 3.0% rent growth · sell at horizon
- IRR
- 32.8%
- Equity multiple
- 3.56×
- Total profit
- $64,396
- Equity at exit
- $80,989
- IRR
- 28.3%
- Equity multiple
- 8.05×
- Total profit
- $177,541
- Equity at exit
- $174,656
Cash invested: $25,172 (down + closing). Projections, not guarantees.
Landlord ↔ Tenant lean methodology
- Overall (STATE)
- 87 Strongly Landlord-Friendly
- State Texas
- 87 Strongly Landlord-Friendly · R+5
- County
- — inherits STATE
- City
- — inherits STATE
ZIP-level market 75426
- Home prices YoY
- 11.5%
- Active inventory
- 87
- Price-to-rent
- 6.9×
Monthly cashflow live
- Estimated rent
- $1,090 medium interval (Pro) →
- Mortgage (P&I)
- −$471
- Tax from tax record
- −$110 /mo · $1,321/yr
- Insurance
- −$37
- HOA
- −$0
- Vacancy / Maint / Mgmt
- −$229
- Net cashflow
- $242
Break-even live
UW: 25.0% down · 7.5% · 30yr · 1.5% tax · 5.0% vac · 8.0% maint · 8.0% mgmt
Financing live
Cash to close
- Down payment
- $22,475
- Closing costs
- $2,697
- Reserves months
- —
- Total cash needed
- —
Loan-product check · same deal, 3 products live
Conventional
25% down · 7.5% · 30yr
- Down + closing
- —
- Monthly P&I
- —
- Monthly cashflow
- —
- DSCR
- —
- Eligible?
- —
Personal DTI + credit; lowest rate.
DSCR
20% down · 8.5% · 30yr
- Down + closing
- —
- Monthly P&I
- —
- Monthly cashflow
- —
- DSCR
- —
- Eligible?
- —
No personal income docs; deal must DSCR.
Hard money
10% down · 12.0% · 12mo
- Down + closing
- —
- Monthly P&I
- —
- Monthly cashflow
- —
- DSCR
- —
- Eligible?
- —
Short-term bridge; refi at stabilization.
Listing history 8 events
-
2026-06-19days on market $89,900 Active 9 DOM
-
2026-06-18days on market $89,900 Active 8 DOM
-
2026-06-17days on market $89,900 Active 7 DOM
-
2026-06-16days on market $89,900 Active 6 DOM
-
2026-06-15days on market $89,900 Active 5 DOM
-
2026-06-14days on market $89,900 Active 3 DOM
-
2026-06-12remarks 699-char remark
-
2026-06-12$89,900 Active 2 DOM
ⓘ Source: listings_history table (triggers on properties + properties_extension) + one-shot
backfill from property_details.listing_events for pre-trigger history.
Tax reassessment forecast TX · Resets to sale price
- Current annual tax
- $1,321 · $110/mo
- Projected year-2 tax
- $1,645 · $137/mo
- Expected delta
- +$324/yr (+$27/mo · 24.5%)
ⓘ Screening estimate from a state-policy table — verify with the county assessor before closing.
Climate risk First Street
- Flood 1/10 Low FEMA zone X · 0% chance over 30 yrs
- Wildfire 6/10 Major
- Heat 7/10 Severe 7 d/yr ≥110°F today · 22 d/yr by 30 yrs out
- Wind 4/10 Moderate 18% chance of damaging wind over 30 yrs
- Air quality 2/10 Low 0 unhealthy d/yr today · 1 by 30 yrs out
Nearby sold comps map
Loading sold comps map…
Walkable amenities ~0.75 mi
Loading nearby amenities…
Taxation est. · year 1
- Rental income
- $13,080
- − Mortgage interest
- −$5,036
- − Property taxes
- −$1,321
- − Insurance
- −$450
- − Repairs & maintenance
- −$1,046
- − Management
- −$1,046
- − Depreciation
- −$2,615
- Taxable income
- $1,565
- Est. tax owed @ 24.0%
- −$376
- After-tax cash flow
- $2,529/yr
For passive investors: Depreciation is non-cash, so a rental often shows a tax loss while cash-flowing — sheltering income. Rental losses are passive: they offset passive income freely, and up to $25,000/yr can offset ordinary (W-2) income if you actively participate and your MAGI is under $100k (phasing out to $0 by $150k); unused losses carry forward. On sale, claimed depreciation is recaptured at up to 25%, and gains may owe capital-gains tax (a 1031 exchange can defer both). Figures are a year-1 estimate at your 24.0% rate — not tax advice; consult a CPA.
Schools (NCES district)
- District
- Clarksville ISD
- NCES district ID
- 4814190
- Math proficiency
- 20% ▼ -12.00%
- Reading proficiency
- 27% ▼ -2.00%
- Median HH income
- $31,795
- Composite
- 19.05/100
- National rank
- #8842
- State rank
- #752 of 826 in TX
Livability — Clarksville
- Score
- 67/100
- State rank
- #523
- US rank
- #10265
Category grades
Schools grade is shown separately in the Schools card above.
Census & demographics
- Census place
- Clarksville, TX
- Population (ZIP)
- 4,199
Population outlook (Red River County) Hauer SSP2
- Today (2025)
- 11,454 people
- By 2030
- 10,874 · -5.1%
- By 2040
- 9,715 · -15.2%
- By 2050
- 8,552 · -25.3%
- By 2075
- 6,042 · -47.2%
- By 2100
- 4,037 · -64.8%
Race, ethnicity, and origin ACS 2023
- Neighborhood character
- Diverse neighborhood (Simpson 0.56)
- Race & ethnicity
- White 52% Black 40% Hispanic / Latino 5% Two or more races 3%
- Hispanic origin (detail)
- Mexican 3%
- Common ancestry
- Slovak 1%
- Foreign-born
- 2% · Canada, China
- Languages at home
- 96% English-only · Spanish 3% Chinese 1%
Political lean MEDSL · Red River
- 2024 margin
- Solid R (+61.8) · D 19.0% · R 80.8%
- 2008→2024 swing
- -23.7pp toward R · 2008: -38.0pp · 2024: -61.8pp
- All cycles
- 2024: R+61.8 2020: R+56.3 2016: R+53.9 2012: R+40.7 2008: R+38.0
Not yet ingested
- Civics
- —
Market trends
- HPI YoY
- ▲ 17.13%
- Current HPI
- 166.5937
- Rent YoY
- —
- Metro
- —
- State GDP YoY
- ▲ 3.95%
- F500 in state
- 110
Industry mix (Fortune 500 HQ in TX)
| Industry | F500 HQs | Revenue |
|---|---|---|
| Energy | 16 | $1,198B |
|
||
| Technology | 5 | $198B |
|
||
| Engineering / Construction | 4 | $72B |
|
||
| Energy Services | 3 | $60B |
|
||
| Utilities | 3 | $41B |
|
||
| Healthcare | 2 | $330B |
|
||
Price history
5 events — show timeline
- 2026-06-10 Listed $89,900 NTREIS
- 2023-03-07 Sold (Public Records) — Public Records
- 2019-12-02 Sold (Public Records) — Public Records
- 2017-07-14 Sold (Public Records) — Public Records
- 1993-03-30 Sold (Public Records) — Public Records
Property tax history
+8.2%/yrLatest (2025): $1,321 · -26.4% YoY. Source: county tax records.
Cash-flow waterfall
monthlySold comps — $/sqft
last 12 mo · ≤1 miLoading sold comps…