11 Dequimpal St · Belgium, IL
Flood risk 1/10 · Minimal
- FEMA flood zone
- X (unshaded)
- Chance of flooding over 30 yrs
- 0.0%
- Est. flood insurance / yr
- $473 – $860
Fire risk 1/10 · Minimal
- Est. fire insurance / yr
- $804 – $1,492
Heat risk 3/10 · Minor
- Hot days now (above 104°F)
- 7 days/yr
- Hot days in 30 yrs
- 18 days/yr
Wind risk 2/10 · Minimal
- Chance of severe wind over 30 yrs
- 1.0%
Air-quality risk 2/10 · Minimal
- Unhealthy air days now
- 1 days/yr
- Unhealthy air days in 30 yrs
- 1 days/yr
Risk factors via First Street. Map © Google.
Why this score? — see what drove the B+ grade
The composite is a weighted blend of 9 inputs, each scored 0–100. Each bar is that input's sub-score; the figure is the points it added to the 100-point composite (weight × sub-score).
- Cash flow +30.0/30.0
- ARV discount +15.0/15.0
- 1% rule +10.0/10.0
- DSCR +10.0/10.0
- Appreciation +5.5/10.0
- Livability +2.9/5.0
- Rent growth +2.5/5.0
- Condition / age +2.5/5.0
- Schools +0.8/10.0
$45,900
🖨 Deal sheet (PDF) 📄 Offer letter ✓ Due diligence
Listing remarks MLS
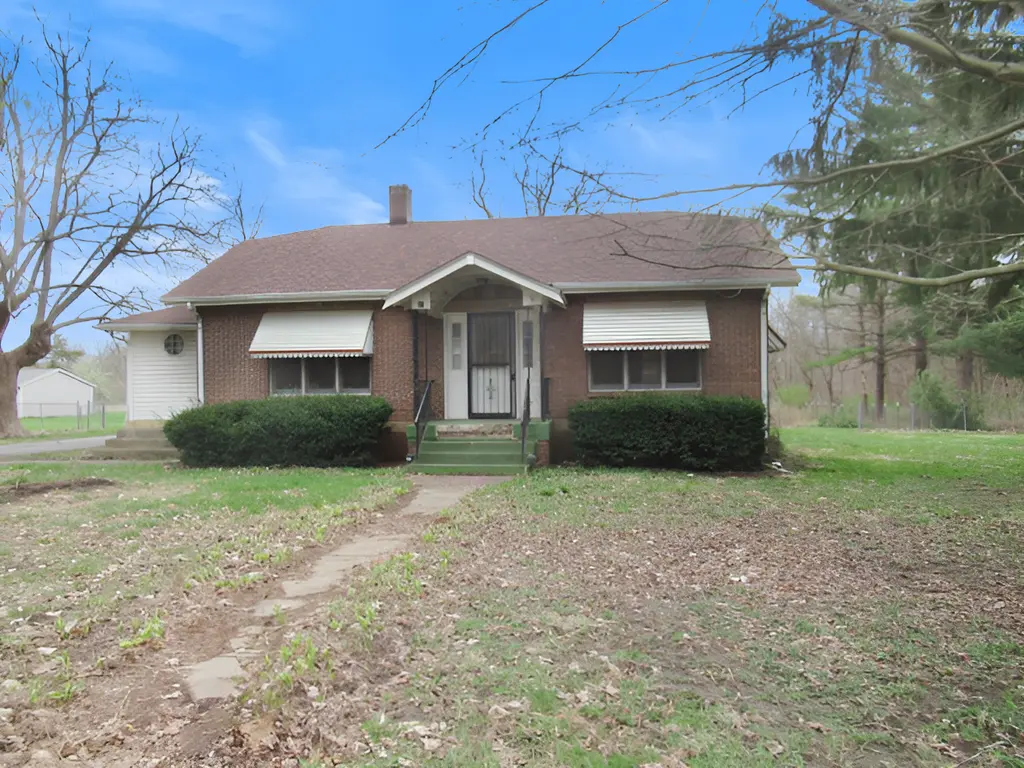
A unique property just minutes from downtown. Old-fashioned awnings shelter the front windows. This very livable house has a large living room and a separate dining room, plus an unfinished basement. Outside is a gardener's dream with sheds, a real burn pile and an oversized 2 car garage currently used as a man-cave. Act quickly!
Key facts
- Separate dining room
- 2 garage spots
- Listed 30 days
Tags
Neighborhood map
What this means for you Summary
Snapshot
- This is a 2-bed/1.0-bath single-family listed at $46k.
Deal economics
- At list price, monthly cash flow is $450 ($5k/yr) — positive.
- The deal already cash-flows at list — no discount required.
- Meets the 1% rule at list price ($931 rent vs $46k).
- Recommended offer: $45k (1.5% below list) — sets the bar for market timing.
Location & tenants
- Location reads 57/100 on livability (#1,162 in IL) — a working-class tenant base; expect higher turnover. Strengths: cost of living A+, housing A+; Watch: crime D-, amenities F, commute F.
- Westville CUSD 2 (suburban): math 8% / reading 9% proficiency, ranked #590 of 620 in IL (top 95%) — low school quality limits family demand, transient renter base, plan for 1-2y turnover.
- Zoned schools: Judith Giacoma Elem School (math 8% / reading 9%, grade F, #1,617 of 2,056 statewide, top 79%, 671 students, 0% FRL); Westville Jr High School (math 8% / reading 8%, grade F, #612 of 665 statewide, top 93%, 177 students, 0% FRL); Westville High School (math 8% / reading 8%, grade F, #589 of 693 statewide, top 86%, 350 students, 0% FRL) — zoned schools average 0% FRL vs 54% district-wide (54 pts lower); this property's tenant base skews higher-income than the district average.
- Market conditions: 15 active listings in the ZIP; 3 comparable units currently listed for rent nearby; rentals at typical pace (median 15d on market — plan ~3-4 weeks tenant-placement turnaround); 8 units permitted in Vermilion County in 2024 (0 in 5+ unit buildings).
Forward outlook
- In year one you build about $779 of equity ($317 loan paydown + $462 appreciation (1.0% local appreciation)).
- Vermilion County population projected at -24% by 2050 — secular population decline; favor cash flow + early exit over multi-decade hold.
- At projected returns (1.0% appreciation + 3.0% rent growth), your $13k cash investment doubles in ~3 years — after that, you're playing with house money.
Negotiation context
- It's been on market 30 days — a 2% lower offer ($45k) is reasonable based on typical stale-listing flexibility.
- 2 sale attempts since 12y ago with the ask held roughly flat each time — persistent listings suggest the price (not the market) is what's stuck; bring a comps-based counter.
Questions for the listing agent
- Is there a deadline driving the sale (1031 exchange, divorce, estate, relocation)? That informs how much negotiation room exists.
- Schools are F-rated, which usually means shorter tenancies and higher turnover. Who's the typical renter profile here, and what's been the actual vacancy rate?
- Crime grade is D in this area — have there been break-ins, vandalism, or insurance claims at this property in the last 3 years? What carrier currently insures it and at what premium?
- What's the average days-on-market for RENTAL listings here right now (not sales)? A rising rental-DOM trend means longer vacancies and softer asking-rent achievability than the comps imply.
- What's the recent tenant-quality profile in this submarket — average credit score on applications, eviction rate, late-payment / NSF rate, and stable-employment percentage? A property-management company in the area should have these aggregated.
- How much new for-sale + rental construction is in the pipeline within 1–3 miles? Heavy new supply typically softens prices + rents 12–24 months out; constrained supply supports both.
Investment metrics
- 1% rule
- 2.03% ✓
- Cap rate
- 18.06%
- Cash-on-cash
- 42.02%
- DSCR
- 2.87
- GRM
- 4.1
CMA / ARV
- ARV (median comp)
- $91,441
- List price
- $45,900
- Delta
- -49.80%
- Verdict
- UNDERPRICED
- Comps
- 20 within 1.0 mi
Show comp detail 5 sales within ~0.75 mi
| Address | Dist | Beds/Ba | Sqft | Sold | Price | $/sf | Match |
|---|---|---|---|---|---|---|---|
| 11 Dequimpal St | 0.00mi | 2/1.0 | 1,100 (0%) | 1mo | $45,000 | $41 | 99 |
| 2 Church St | 0.36mi | 3/1.0 (+1) | 1,200 (+9%) | 24mo | $40,000 | $33 | 43 |
| 109 Dolak St | 0.49mi | 2/1.0 | 1,251 (+14%) | 15mo | $42,000 | $34 | 42 |
| 1608 Danville St | 0.60mi | 2/1.0 | 1,250 (+14%) | 9mo | $90,000 | $72 | 42 |
| 217 Washington Ave | 0.61mi | 3/2.0 (+1) | 1,251 (+14%) | 11mo | $147,500 | $118 | 31 |
Match score weights: distance 35% · size 25% · config 20% · recency 20%. Top-matched comps best support the ARV.
Projected returns pro-forma
1.01% appreciation · 3.0% rent growth · sell at horizon
- IRR
- 44.6%
- Equity multiple
- 3.30×
- Total profit
- $29,534
- Equity at exit
- $15,687
- IRR
- 46.4%
- Equity multiple
- 6.54×
- Total profit
- $71,245
- Equity at exit
- $20,860
Cash invested: $12,852 (down + closing). Projections, not guarantees.
Landlord ↔ Tenant lean methodology
- Overall (STATE)
- 43 Moderately Tenant-Leaning
- State Illinois
- 43 Moderately Tenant-Leaning · D+7
- County
- — inherits STATE
- City
- — inherits STATE
ZIP-level market 61883
- Home prices YoY
- 0.4%
- Active inventory
- 15
- Price-to-rent
- 4.1×
Monthly cashflow live
- Estimated rent
- $931 medium interval (Pro) →
- Mortgage (P&I)
- −$241
- Tax from tax record
- −$26 /mo · $309/yr
- Insurance
- −$19
- HOA
- −$0
- Lot rent
- −$0
- Vacancy / Maint / Mgmt
- −$196
- Net cashflow
- $450
Break-even live
Sensitivity live
| Price | -10% $476 | -5% $463 | +0% $450 | +5% $437 | +10% $424 |
|---|---|---|---|---|---|
| Rent | -10% $376 | -5% $413 | +0% $450 | +5% $487 | +10% $524 |
| Rate | -1.0pp $473 | -0.5pp $462 | base $450 | +0.5pp $438 | +1.0pp $426 |
UW: 25.0% down · 7.5% · 30yr · 1.5% tax · 5.0% vac · 8.0% maint · 8.0% mgmt
Financing live
Cash to close
- Down payment
- $11,475
- Closing costs
- $1,377
- Reserves months
- —
- Total cash needed
- —
Loan-product check · same deal, 3 products live
Conventional
25% down · 7.5% · 30yr
- Down + closing
- —
- Monthly P&I
- —
- Monthly cashflow
- —
- DSCR
- —
- Eligible?
- —
Personal DTI + credit; lowest rate.
DSCR
20% down · 8.5% · 30yr
- Down + closing
- —
- Monthly P&I
- —
- Monthly cashflow
- —
- DSCR
- —
- Eligible?
- —
No personal income docs; deal must DSCR.
Hard money
10% down · 12.0% · 12mo
- Down + closing
- —
- Monthly P&I
- —
- Monthly cashflow
- —
- DSCR
- —
- Eligible?
- —
Short-term bridge; refi at stabilization.
Rent comps 3 comps
| Address | Beds | Baths | Sqft | Rent | $/sqft | DOM | Units | Dist |
|---|---|---|---|---|---|---|---|---|
| 3 Church St Westville, IL | 3.0 | 1.0 | 1100 | $995 | $0.90 | 15d | 1 | 0.51mi |
| 215 Cook St Westville, IL | 1.0 | 1.0 | 700 | $650 | $0.93 | 15d | 1 | 1.10mi |
| 59 Juliana Dr Danville, IL | 2.0 | 1.0 | 1000 | $995 | $0.99 | 7d | 1 | 1.49mi |
Listing history 7 events
-
2026-05-02status Pending 335-char remark
Show marketing remark (335 chars)
A unique property just minutes from downtown. Old-fashioned awnings shelter the front windows. This very livable house has a large living room and a separate dining room, plus an unfinished basement. Outside is a gardener's dream with sheds, a real burn pile and an oversized 2 car garage currently used as a man-cave. Act quickly!
-
2026-04-01$45,900 Active 335-char remark
Show marketing remark (335 chars)
A unique property just minutes from downtown. Old-fashioned awnings shelter the front windows. This very livable house has a large living room and a separate dining room, plus an unfinished basement. Outside is a gardener's dream with sheds, a real burn pile and an oversized 2 car garage currently used as a man-cave. Act quickly!
-
2014-06-26soldstatus $60,000 273-char remark
Show marketing remark (273 chars)
AMAZING PIECE OF PROPERTY-A 1 CAR, 2.5 CAR GARAGE AND A CARPORT, OUTBUILDINGS, PARTLY FENCED, LOTS OF PRIVACY. THIS 2 BDRM HOME WITH CENTRAL AIR COULD POSSIBLE BE A 3 BDRM HOME, HUGE FRONTROOM, NICE FULL BASEMENT. CALL JODI BARNEY FOR MORE INFORMATION OR TO VIEW THIS HOME.
-
2014-06-26soldstatus $60,000
Show marketing remark (273 chars)
AMAZING PIECE OF PROPERTY-A 1 CAR, 2.5 CAR GARAGE AND A CARPORT, OUTBUILDINGS, PARTLY FENCED, LOTS OF PRIVACY. THIS 2 BDRM HOME WITH CENTRAL AIR COULD POSSIBLE BE A 3 BDRM HOME, HUGE FRONTROOM, NICE FULL BASEMENT. CALL JODI BARNEY FOR MORE INFORMATION OR TO VIEW THIS HOME.
-
2014-05-08$65,000 273-char remark
Show marketing remark (273 chars)
AMAZING PIECE OF PROPERTY-A 1 CAR, 2.5 CAR GARAGE AND A CARPORT, OUTBUILDINGS, PARTLY FENCED, LOTS OF PRIVACY. THIS 2 BDRM HOME WITH CENTRAL AIR COULD POSSIBLE BE A 3 BDRM HOME, HUGE FRONTROOM, NICE FULL BASEMENT. CALL JODI BARNEY FOR MORE INFORMATION OR TO VIEW THIS HOME.
-
1978-09-29soldstatus $22,000
-
1971-08-02soldstatus $12,000
ⓘ Source: listings_history table (triggers on properties + properties_extension) + one-shot
backfill from property_details.listing_events for pre-trigger history.
Tax reassessment forecast IL · Partial reset (capped growth)
- Current annual tax
- $309 · $26/mo
- Projected year-2 tax
- $676 · $56/mo
- Expected delta
- +$366/yr (+$31/mo · 118.3%)
ⓘ Screening estimate from a state-policy table — verify with the county assessor before closing.
Climate risk First Street
- Flood 1/10 Low FEMA zone X (unshaded) · 0% chance over 30 yrs
- Wildfire 1/10 Low
- Heat 3/10 Moderate 7 d/yr ≥104°F today · 18 d/yr by 30 yrs out
- Wind 2/10 Low 100% chance of damaging wind over 30 yrs
- Air quality 2/10 Low 1 unhealthy d/yr today · 1 by 30 yrs out
Nearby sold comps map
Loading sold comps map…
Walkable amenities ~0.75 mi
Loading nearby amenities…
Taxation est. · year 1
- Rental income
- $11,175
- − Mortgage interest
- −$2,571
- − Property taxes
- −$309
- − Insurance
- −$230
- − Repairs & maintenance
- −$894
- − Management
- −$894
- − Depreciation
- −$1,335
- Taxable income
- $4,942
- Est. tax owed @ 24.0%
- −$1,186
- After-tax cash flow
- $4,215/yr
For passive investors: Depreciation is non-cash, so a rental often shows a tax loss while cash-flowing — sheltering income. Rental losses are passive: they offset passive income freely, and up to $25,000/yr can offset ordinary (W-2) income if you actively participate and your MAGI is under $100k (phasing out to $0 by $150k); unused losses carry forward. On sale, claimed depreciation is recaptured at up to 25%, and gains may owe capital-gains tax (a 1031 exchange can defer both). Figures are a year-1 estimate at your 24.0% rate — not tax advice; consult a CPA.
Schools (NCES district)
- District
- Westville CUSD 2
- NCES district ID
- 1710820
- Math proficiency
- 8% ▼ -4.00%
- Reading proficiency
- 9% ▼ -4.00%
- Median HH income
- $41,214
- Composite
- 7.54/100
- National rank
- #9949
- State rank
- #590 of 620 in IL
Livability — Belgium
- Score
- 57/100
- State rank
- #1162
- US rank
- #21964
Category grades
Schools grade is shown separately in the Schools card above.
Census & demographics
- Census place
- Belgium, IL
- Population (ZIP)
- 4,424
Population outlook (Vermilion County) Hauer SSP2
- Today (2025)
- 72,775 people
- By 2030
- 69,235 · -4.9%
- By 2040
- 62,360 · -14.3%
- By 2050
- 55,539 · -23.7%
- By 2075
- 40,606 · -44.2%
- By 2100
- 26,985 · -62.9%
Race, ethnicity, and origin ACS 2023
- Neighborhood character
- Predominantly White (95%)
- Race & ethnicity
- White 95% Two or more races 2% Hispanic / Latino 1%
- Common ancestry
- Romanian 4% Lithuanian 3% Slovak 2%
- Foreign-born
- 1%
- Languages at home
- 98% English-only · Spanish 2%
Political lean MEDSL · Vermilion
- 2024 margin
- Solid R (+35.7) · D 31.4% · R 67.0% · Other 1.6%
- 2008→2024 swing
- -36.2pp toward R · 2008: 0.6pp · 2024: -35.7pp
- All cycles
- 2024: R+35.7 2020: R+32.9 2016: R+29.2 2012: R+15.7 2008: D+0.6
Not yet ingested
- Civics
- —
Market trends
- HPI YoY
- ▲ 1.01%
- Current HPI
- 230.8944
- Rent YoY
- —
- Metro
- —
- State GDP YoY
- ▲ 1.59%
- F500 in state
- 60
Industry mix (Fortune 500 HQ in IL)
| Industry | F500 HQs | Revenue |
|---|---|---|
| Insurance | 4 | $201B |
|
||
| Consumer Goods | 4 | $87B |
|
||
| Industrial Machinery | 3 | $64B |
|
||
| Healthcare | 2 | $55B |
|
||
| Retail / Pharmacy | 1 | $148B |
|
||
| Agriculture / Food | 1 | $86B |
|
||
Price history
+282.5% since first listed7 events — show timeline
- 2026-05-02 Pending — MRED as Distributed by MLS Grid
- 2026-04-01 Listed $45,900 MRED as Distributed by MLS Grid
- 2014-06-26 Sold (Public Records) $60,000 Public Records
- 2014-06-26 Sold (MLS) $60,000 CIBR
- 2014-05-08 Listed $65,000 CIBR
- 1978-09-29 Sold (Public Records) $22,000 Public Records
- 1971-08-02 Sold (Public Records) $12,000 Public Records
Property tax history
-0.8%/yrLatest (2024): $309 · +0.2% YoY. Source: county tax records.
Cash-flow waterfall
monthlySold comps — $/sqft
last 12 mo · ≤1 miLoading sold comps…