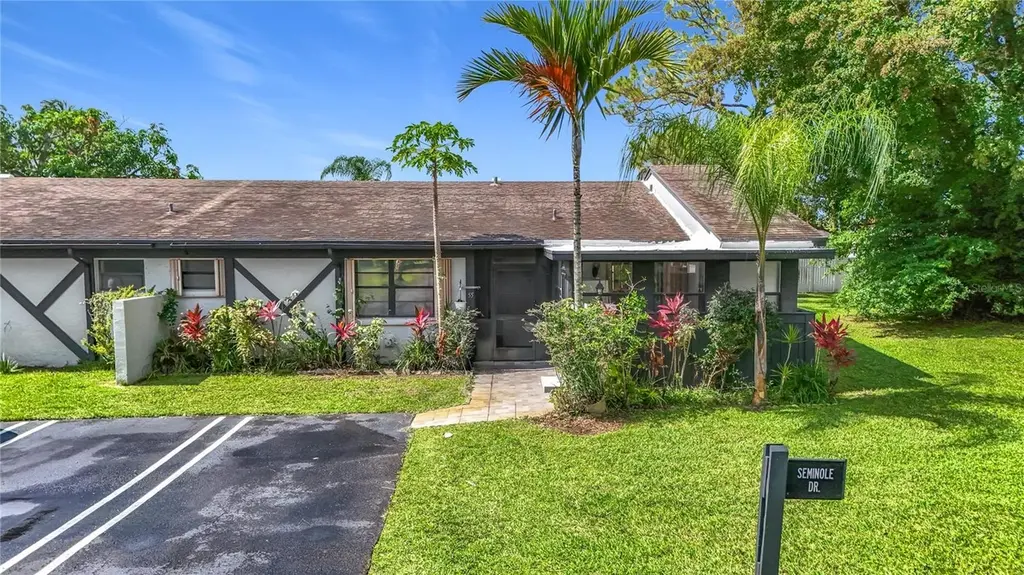
55 Seminole Dr · Royal Palm Beach, FL
Flood risk 3/10 · Minor
- FEMA flood zone
- X (unshaded)
- Chance of flooding over 30 yrs
- 0.2%
- Est. flood insurance / yr
- $507 – $1,088
Fire risk 4/10 · Minor
- Est. fire insurance / yr
- $947 – $1,759
Heat risk 10/10 · Severe
- Hot days now (above 107°F)
- 7 days/yr
- Hot days in 30 yrs
- 27 days/yr
Wind risk 10/10 · Severe
- Chance of severe wind over 30 yrs
- 99.0%
Air-quality risk 2/10 · Minimal
- Unhealthy air days now
- 0 days/yr
- Unhealthy air days in 30 yrs
- 1 days/yr
Risk factors via First Street. Map © Google.
Why this score? — see what drove the C- grade
The composite is a weighted blend of 9 inputs, each scored 0–100. Each bar is that input's sub-score; the figure is the points it added to the 100-point composite (weight × sub-score).
- Cash flow +12.7/30.0
- Appreciation +10.0/10.0
- ARV discount +7.5/15.0
- Schools +4.3/10.0
- Livability +4.0/5.0
- DSCR +3.8/10.0
- 1% rule +3.4/10.0
- Rent growth +2.7/5.0
- Condition / age +2.5/5.0
$325,000
🖨 Deal sheet 📄 Offer letter ✓ Due diligence
Listing remarks
55 Seminole Drive offers a 2-bedroom, 2-bath layout on a corner lot with a remodeled kitchen and remodeled primary bedroom and bathroom. The enclosed front porch creates a comfortable entry and sitting area, while the enclosed back patio adds flexible space for relaxing, hobbies, storage, or entertaining. Slide-and-lock hurricane shutters add practical storm-prep convenience. The location adds everyday value, with an elementary school nearby and two shopping plazas within a short distance. Community benefits include pool use, common area maintenance, lawn care, and exterior property insurance, subject to broker and HOA document verification.
Key facts
- Remodeled kitchen
- Hurricane shutters
- Enclosed front porch
Tags
Property features AI
Finance
- Other: Total annual fees reported as $3,400
- Financial info: No lease restrictions reported
- HOA & community: Indian Trail Homeowner Association; Quarterly HOA fee ($850 quarterly; $283.33 monthly equivalent); Association approval required; HOA includes pool and maintenance of structure and grounds; Community pool; Community mailbox; Pets allowed
Exterior
- Parking: Paved lot; Corner lot
- Utilities: Public water; Public sewer; Electricity connected; Cable connected; Underground utilities; Water connected; Sewer connected
- Home design: Residential villa; One-story; South-facing; Homestead exempt
- Construction: Block, concrete and stucco construction; Shingle roof; Slab foundation; Built on a 0.17-acre lot
- Exterior features: Covered, enclosed and screened porches; Front porch; Rear porch; Patio; Sliding doors; Rain gutters; Hurricane shutters
Interior
- Kitchen: Dishwasher; Range; Refrigerator; Electric water heater
- Bedrooms: 2 bedrooms
- Flooring: Tile; Vinyl
- Bathrooms: 2 full bathrooms
- Heating & cooling: Electric heating; Central air conditioning
- Interior features: Ceiling fans; Thermostat; Window treatments; Blinds; Shutters
- Laundry & utility: Inside laundry with washer and dryer
Neighborhood map
What this means for you Summary
Snapshot
- This is a 2-bed/2.0-bath single-family listed at $325k.
Deal economics
- At list price, monthly cash flow is $-36 ($-429/yr) — negative.
- To cash-flow at today's rent, offer at most $319k (1.9% below list).
- To meet the 1% rule (rent ≥ 1% of price), the offer needs to be $271k (16.5% below list).
- Recommended offer: $271k (16.5% below list) — sets the bar for 1% rule.
Location & tenants
- Location reads 79/100 on livability (#135 in FL, #2,039 nationally) — a middle-class / working-renter tenant base. Strengths: employment A+, housing A+, health & safety A+; Watch: cost of living C-, amenities F, commute F.
- Palm Beach (suburban): math 46% / reading 53% proficiency, ranked #34 of 73 in FL (top 47%) — families likely to look elsewhere, expect single-tenant / working-renter base with shorter leases.
- Market conditions: Rents flat; 574 active listings in the ZIP; 30 comparable units currently listed for rent nearby; rentals at typical pace (median 22d on market — plan ~3-4 weeks tenant-placement turnaround); solid renter incomes; 3,974 units permitted in Palm Beach County in 2024 (1,012 in 5+ unit buildings).
- This rent runs 35% of the median local income ($93k/yr) — at the standard rent-burdened threshold; future hikes will face affordability resistance.
Forward outlook
- In year one you build about $35k of equity ($2k loan paydown + $32k appreciation (10.0% local appreciation)).
- Palm Beach County population projected at +30% by 2050 — long-run rental-demand tailwind backs the buy-and-hold thesis.
- At projected returns (10.0% appreciation + 0.8% rent growth), your $91k cash investment doubles in ~3 years — after that, you're playing with house money.
- By year 2, paydown + projected appreciation supports a ~$56k cash-out refi (75% LTV) — recoverable capital for the next deal without selling this one.
Negotiation context
- Only 14 days on market — expect competitive offers; lowballing is unlikely to land.
- Current owner paid $62k; list at $325k implies a 428% gain — meaningful room to come down on a strong offer.
Risks & watch-outs
- Climate carrying-cost: severe wind risk, 99% chance of damaging wind over 30y; extreme-heat days projected 7→27/yr by 2055 (HVAC capex compounding) — expect insurance premiums to compound above CPI over the hold.
Questions for the listing agent
- What do current leases actually rent for vs. the listed asking? Can we see a recent rent roll and the last 12 months of T-12 income?
- What does the HOA fee cover, when was the last increase, and are there any pending special assessments or reserve-fund shortfalls?
- Is there a deadline driving the sale (1031 exchange, divorce, estate, relocation)? That informs how much negotiation room exists.
- Schools are B-rated — typically a magnet for longer-tenancy family renters. What's the average tenant stay here, and is there a school-zone premium baked into asking?
- What's the average days-on-market for RENTAL listings here right now (not sales)? A rising rental-DOM trend means longer vacancies and softer asking-rent achievability than the comps imply.
- What's the recent tenant-quality profile in this submarket — average credit score on applications, eviction rate, late-payment / NSF rate, and stable-employment percentage? A property-management company in the area should have these aggregated.
- How much new for-sale + rental construction is in the pipeline within 1–3 miles? Heavy new supply typically softens prices + rents 12–24 months out; constrained supply supports both.
Investment metrics
- 1% rule
- 0.84% ✗
- Cap rate
- 6.16%
- Cash-on-cash
- -0.47%
- DSCR
- 0.98
- GRM
- 10.0
CMA / ARV
No comps found within radius.
Projected returns pro-forma
10.0% appreciation · 0.85% rent growth · sell at horizon
- IRR
- 23.3%
- Equity multiple
- 2.86×
- Total profit
- $168,977
- Equity at exit
- $292,786
- IRR
- 20.3%
- Equity multiple
- 6.37×
- Total profit
- $488,729
- Equity at exit
- $631,404
Cash invested: $91,000 (down + closing). Projections, not guarantees.
Landlord ↔ Tenant lean methodology
- Overall (STATE)
- 87 Strongly Landlord-Friendly
- State Florida
- 87 Strongly Landlord-Friendly · R+3
- County
- — inherits STATE
- City
- — inherits STATE
ZIP-level market 33411
- Home prices YoY
- 1.9%
- Rents YoY
- 0.8%
- Active inventory
- 574
- Price-to-rent
- 10.0×
Monthly cashflow live
- Estimated rent
- $2,715 high interval (Pro) →
- Mortgage (P&I)
- −$1,704
- Tax from tax record
- −$58 /mo · $693/yr
- Insurance
- −$135
- HOA
- −$283
- Vacancy / Maint / Mgmt
- −$570
- Net cashflow
- $-36
Break-even live
UW: 25.0% down · 7.5% · 30yr · 1.5% tax · 5.0% vac · 8.0% maint · 8.0% mgmt
Financing live
Cash to close
- Down payment
- $81,250
- Closing costs
- $9,750
- Reserves months
- —
- Total cash needed
- —
Loan-product check · same deal, 3 products live
Conventional
25% down · 7.5% · 30yr
- Down + closing
- —
- Monthly P&I
- —
- Monthly cashflow
- —
- DSCR
- —
- Eligible?
- —
Personal DTI + credit; lowest rate.
DSCR
20% down · 8.5% · 30yr
- Down + closing
- —
- Monthly P&I
- —
- Monthly cashflow
- —
- DSCR
- —
- Eligible?
- —
No personal income docs; deal must DSCR.
Hard money
10% down · 12.0% · 12mo
- Down + closing
- —
- Monthly P&I
- —
- Monthly cashflow
- —
- DSCR
- —
- Eligible?
- —
Short-term bridge; refi at stabilization.
Rent comps 30 comps
| Address | Beds | Baths | Sqft | Rent | $/sqft | DOM | Units | Dist |
|---|---|---|---|---|---|---|---|---|
| 190 Parkwood Dr Royal Palm Beach, FL | 3.0 | 2.0 | 1644 | $3,200 | $1.95 | 24d | 1 | 0.06mi |
| 81 Westecunk Dr Royal Palm Beach, FL | 2.0 | 2.0 | 1347 | $2,550 | $1.89 | 17d | 1 | 0.15mi |
| 100 Miramar Ave Royal Palm Beach, FL | 3.0 | 2.0 | 1812 | $3,600 | $1.99 | 24d | 1 | 0.24mi |
| 212 Trace Ct Royal Palm Beach, FL | 3.0 | 2.0 | 1740 | $3,050 | $1.75 | 5d | 1 | 0.45mi |
| 36 Danbury Ct Unit B Royal Palm Beach, FL | 2.0 | 2.5 | 1398 | $2,300 | $1.65 | 11d | 1 | 0.49mi |
| 43 Essex Ct Unit A Royal Palm Beach, FL | 2.0 | 2.5 | 1398 | $2,500 | $1.79 | 24d | 1 | 0.52mi |
| 101 Fairway Ln Royal Palm Beach, FL | 3.0 | 2.5 | 1684 | $3,300 | $1.96 | 22d | 1 | 0.54mi |
| 113 Madrid St Royal Palm Beach, FL | 3.0 | 3.0 | 1720 | $4,500 | $2.62 | 10d | 1 | 0.63mi |
| 180 Heatherwood Dr Royal Palm Beach, FL | 3.0 | 2.0 | 1462 | $2,710 | $1.85 | 5d | 1 | 0.64mi |
| 905 Palm Beach Trace Dr Royal Palm Beach, FL | 1.0 | 2.0 | 1201 | $1,700 | $1.42 | 24d | 1 | 0.66mi |
| 145 Prestige Dr Royal Palm Beach, FL | 3.0 | 2.0 | 1464 | $2,900 | $1.98 | 17d | 1 | 0.69mi |
| 1605 Palm Beach Trace Dr Royal Palm Beach, FL | 2.0 | 2.0 | 1201 | $2,100 | $1.75 | 12d | 1 | 0.69mi |
| 1803 Palm Beach Trace Dr Royal Palm Beach, FL | 2.0 | 2.0 | 1201 | $2,000 | $1.67 | 18d | 1 | 0.72mi |
| 240 Bilbao St Royal Palm Beach, FL | 3.0 | 2.0 | 1440 | $3,400 | $2.36 | 24d | 1 | 0.86mi |
| 1407 Lakeview Dr E Royal Palm Beach, FL | 2.0 | 2.0 | 1165 | $2,300 | $1.97 | 7d | 1 | 0.90mi |
| 1601 Lakeview Dr W Unit 1601 Royal Palm Beach, FL | 3.0 | 2.5 | 1296 | $2,375 | $1.83 | 22d | 1 | 0.94mi |
| 216 Cordoba Cir Royal Palm Beach, FL | 3.0 | 2.0 | 1461 | $3,080 | $2.11 | 7d | 1 | 0.95mi |
| 151 Cordoba Cir Royal Palm Beach, FL | 3.0 | 2.0 | 1421 | $3,300 | $2.32 | 24d | 1 | 0.98mi |
| 202 Lakeside Landing Dr Royal Palm Beach, FL | 3.0 | 2.5 | 1532 | $3,200 | $2.09 | 4d | 1 | 1.00mi |
| 221 Bilbao St Royal Palm Beach, FL | 3.0 | 2.0 | 1657 | $3,700 | $2.23 | 24d | 1 | 1.01mi |
| 110 Weybridge Cir Unit A Royal Palm Beach, FL | 2.0 | 2.5 | 1470 | $2,350 | $1.60 | 22d | 1 | 1.19mi |
| 182 Sparrow Dr Unit A Royal Palm Beach, FL | 3.0 | 2.0 | 1485 | $3,000 | $2.02 | 24d | 1 | 1.24mi |
| 111 Weybridge Cir Royal Palm Beach, FL | 3.0 | 2.5 | 1710 | $3,100 | $1.81 | 5d | 1 | 1.25mi |
| 210 Sparrow Dr #4 Royal Palm Beach, FL | 2.0 | 2.0 | 930 | $1,900 | $2.04 | 20d | 1 | 1.25mi |
| 202 Sparrow Dr #1 Royal Palm Beach, FL | 3.0 | 2.0 | 1020 | $2,400 | $2.35 | 24d | 1 | 1.28mi |
| 132 Weybridge Cir Royal Palm Beach, FL | 2.0 | 2.5 | 1470 | $3,000 | $2.04 | 24d | 1 | 1.28mi |
| 139 Sparrow Dr Royal Palm Beach, FL | 2.0–3.0 | 1.5–2.5 | 1100 | $1,850 | $1.68 | 15d | 3 | 1.30mi |
| 263 Deerfield Ct Royal Palm Beach, FL | 2.0 | 2.0 | 1120 | $1,800 | $1.61 | 24d | 1 | 1.30mi |
| 296 Sandpiper Ave Royal Palm Beach, FL | 3.0 | 2.0 | 1569 | $3,100 | $1.98 | 24d | 1 | 1.34mi |
| 73 Macadamia Ct Royal Palm Beach, FL | 2.0 | 2.0 | 1112 | $2,000 | $1.80 | 11d | 1 | 1.48mi |
HOA detail
- Monthly dues
- $283 · $3,396/yr
- Likely covers
- landscapingpool
Listing history 9 events
-
2026-06-18days on market $325,000 Active 14 DOM
-
2026-06-17days on market $325,000 Active 13 DOM
-
2026-06-16days on market $325,000 Active 12 DOM
-
2026-06-15days on market $325,000 Active 11 DOM
-
2026-06-13days on market $325,000 Active 9 DOM
-
2026-06-09days on market $325,000 Active 5 DOM
-
2026-06-08days on market $325,000 Active 4 DOM
-
2026-06-07remarks 649-char remark
-
2026-06-07$325,000 Active 3 DOM
ⓘ Source: listings_history table (triggers on properties + properties_extension) + one-shot
backfill from property_details.listing_events for pre-trigger history.
Tax reassessment forecast FL · Resets to sale price
- Current annual tax
- $693 · $58/mo
- Projected year-2 tax
- $2,698 · $225/mo
- Expected delta
- +$2,004/yr (+$167/mo · 289.1%)
ⓘ Screening estimate from a state-policy table — verify with the county assessor before closing.
Climate risk First Street
- Flood 3/10 Moderate FEMA zone X (unshaded) · 20% chance over 30 yrs
- Wildfire 4/10 Moderate
- Heat 10/10 Extreme 7 d/yr ≥107°F today · 27 d/yr by 30 yrs out
- Wind 10/10 Extreme 99% chance of damaging wind over 30 yrs
- Air quality 2/10 Low 0 unhealthy d/yr today · 1 by 30 yrs out
Nearby sold comps map
Loading sold comps map…
Walkable amenities ~0.75 mi
Loading nearby amenities…
Taxation est. · year 1
- Rental income
- $32,579
- − Mortgage interest
- −$18,205
- − Property taxes
- −$693
- − Insurance
- −$1,625
- − Repairs & maintenance
- −$2,606
- − Management
- −$2,606
- − HOA
- −$3,396
- − Depreciation
- −$9,455
- Taxable loss
- −$6,008
- Est. tax savings @ 24.0%
- +$1,442
- After-tax cash flow
- $1,013/yr
For passive investors: Depreciation is non-cash, so a rental often shows a tax loss while cash-flowing — sheltering income. Rental losses are passive: they offset passive income freely, and up to $25,000/yr can offset ordinary (W-2) income if you actively participate and your MAGI is under $100k (phasing out to $0 by $150k); unused losses carry forward. On sale, claimed depreciation is recaptured at up to 25%, and gains may owe capital-gains tax (a 1031 exchange can defer both). Figures are a year-1 estimate at your 24.0% rate — not tax advice; consult a CPA.
Schools (NCES district)
- District
- Palm Beach
- NCES district ID
- 1201500
- Math proficiency
- 46% ▼ -16.00%
- Reading proficiency
- 53% ▼ -4.00%
- Median HH income
- $53,943
- Composite
- 42.72/100
- National rank
- #3160
- State rank
- #34 of 73 in FL
Livability — Royal Palm Beach
- Score
- 79/100
- State rank
- #135
- US rank
- #2039
Category grades
Schools grade is shown separately in the Schools card above.
Census & demographics
- Census place
- Royal Palm Beach, FL
- County
- Palm Beach County · 1,438,312 people
- City population
- 75,299
- Metro
- Miami-Fort Lauderdale-Pompano Beach, FL
- Population (ZIP)
- 76,863
- Household income
- $92,591
- Rent vs Own
- Severe rent burden
- 1870.0
Population outlook (Palm Beach County) Hauer SSP2
- Today (2025)
- 1,637,487 people
- By 2030
- 1,743,255 · +6.5%
- By 2040
- 1,948,712 · +19.0%
- By 2050
- 2,132,979 · +30.3%
- By 2075
- 2,530,027 · +54.5%
- By 2100
- 2,706,979 · +65.3%
Race, ethnicity, and origin ACS 2023
- Neighborhood character
- Diverse neighborhood (Simpson 0.70)
- Race & ethnicity
- White 44% Hispanic / Latino 24% Black 23% Two or more races 16% Asian 5%
- Hispanic origin (detail)
- Mexican 2% Puerto Rican 5% Cuban 4% Dominican 2%
- Common ancestry
- Hispanic 6% Romanian 2% Italian 1%
- Foreign-born
- 26% · Canada, Jamaica, China
- Languages at home
- 73% English-only · Spanish 17% French/Haitian/Cajun 4% Other Indo-European 2%
Political lean MEDSL · Palm Beach
- 2024 margin
- Toss-up / Even · D 50.0% · R 49.2%
- 2008→2024 swing
- -22.1pp toward R · 2008: 22.9pp · 2024: 0.8pp
- All cycles
- 2024: D+0.8 2020: D+12.8 2016: D+15.3 2012: D+17.0 2008: D+22.9
Not yet ingested
- Civics
- —
Market trends
- HPI YoY
- ▲ 17.04%
- Current HPI
- 903.78
- Rent YoY
- ▲ 0.85%
- Metro
- Miami-Fort Lauderdale-Pompano Beach, FL
- State GDP YoY
- ▲ 3.28%
- F500 in state
- 36
Industry mix (Fortune 500 HQ in FL)
| Industry | F500 HQs | Revenue |
|---|---|---|
| Industrial Technology | 2 | $29B |
|
||
| Insurance | 2 | $17B |
|
||
| Retail | 1 | $60B |
|
||
| Technology Distribution | 1 | $58B |
|
||
| Homebuilding | 1 | $35B |
|
||
| Technology Manufacturing | 1 | $35B |
|
||
Price history
+428.5% since first listed2 events — show timeline
- 2026-06-04 Listed $325,000 Stellar MLS as Distributed by MLS Grid
- 1996-03-13 Sold (Public Records) $61,500 Public Records
Property tax history
-0.6%/yrLatest (2025): $693 · +2.9% YoY. Source: county tax records.
Cash-flow waterfall
monthlySold comps — $/sqft
last 12 mo · ≤1 miLoading sold comps…