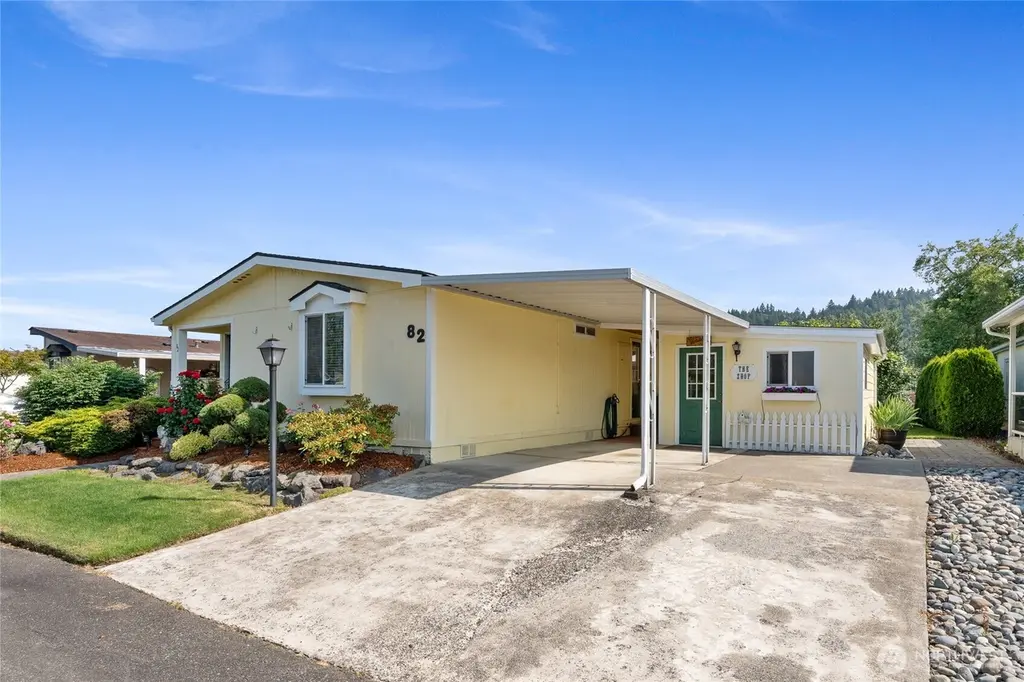
836 Harman Way S #82 · Orting, WA
Flood risk 5/10 · Moderate
- FEMA flood zone
- X (shaded)
- Chance of flooding over 30 yrs
- 0.24%
- Est. flood insurance / yr
- $507 – $1,088
Fire risk 3/10 · Minor
- Est. fire insurance / yr
- $604 – $1,122
Heat risk 3/10 · Minor
- Hot days now (above 87°F)
- 8 days/yr
- Hot days in 30 yrs
- 17 days/yr
Wind risk 1/10 · Minimal
- Chance of severe wind over 30 yrs
- —
Air-quality risk 7/10 · Major
- Unhealthy air days now
- 9 days/yr
- Unhealthy air days in 30 yrs
- 10 days/yr
Risk factors via First Street. Map © Google.
Why this score? — see what drove the C+ grade
The composite is a weighted blend of 9 inputs, each scored 0–100. Each bar is that input's sub-score; the figure is the points it added to the 100-point composite (weight × sub-score).
- Cash flow +27.5/30.0
- DSCR +9.6/10.0
- ARV discount +7.5/15.0
- 1% rule +6.6/10.0
- Schools +4.5/10.0
- Livability +3.7/5.0
- Rent growth +2.5/5.0
- Condition / age +2.5/5.0
- Appreciation +0.0/10.0
$229,995
🖨 Deal sheet (PDF) 📄 Offer letter ✓ Due diligence
Listing remarks
Beautifully maintained 3-bedroom, 1.75-bath home in Orting’s sought-after Mountain View Estates 55+ community! This move-in ready home offers 1,702 sq ft with an open-concept layout, split-bedroom floor plan, and spacious primary suite with private bath. Features include oak hardwood floors, updated kitchen with modern backsplash, and abundant natural light throughout. Enjoy indoor-outdoor living with a covered carport and private back deck—perfect for relaxing or entertaining. Ideal for buyers searching for affordable, low-maintenance living in Orting near parks, walking trails, and local amenities. Convenient access to downtown Orting, shopping, and scenic outdoor recreation.
Key facts
- Covered parking
- Quiet setting
- Huge back deck
Tags
Neighborhood map
What this means for you Summary
Snapshot
- This is a 3-bed/2.0-bath manufactured listed at $230k.
Deal economics
- At list price, monthly cash flow is $680 ($8k/yr) — positive.
- The deal already cash-flows at list — no discount required.
- Meets the 1% rule at list price ($3k rent vs $230k).
- Recommended offer: $209k (9.0% below list) — sets the bar for market timing.
- Cap rate 9.8% vs local median 2.8% in Orting — top-decile yield for the area; either an underpriced asset or a hidden risk that comps aren't pricing in. Stress-test before assuming the spread holds.
Location & tenants
- Location reads 74/100 on livability (#185 in WA, #4,905 nationally) — a middle-class / working-renter tenant base. Strengths: housing A+, health & safety A+, employment A; Watch: commute F, cost of living F.
- Orting School District (suburban): math 40% / reading 56% proficiency, ranked #142 of 291 in WA (top 49%) — families likely to look elsewhere, expect single-tenant / working-renter base with shorter leases.
- Market conditions: 136 active listings in the ZIP; 3,209 units permitted in Pierce County in 2024 (1,269 in 5+ unit buildings).
Forward outlook
- Local home prices are declining (-3.0%/yr); year-one equity from $2k of loan paydown is wiped out by about $7k of value loss. Plan a longer hold.
- Pierce County population projected at +26% by 2050 — long-run rental-demand tailwind backs the buy-and-hold thesis.
- At projected returns (-3.0% appreciation + 3.0% rent growth), your $64k cash investment doubles in ~9 years — after that, you're playing with house money.
Negotiation context
- It's been on market 104 days — a 9% lower offer ($209k) is reasonable based on typical stale-listing flexibility.
- 2 sale attempts since 19y ago with the ask held roughly flat each time — persistent listings suggest the price (not the market) is what's stuck; bring a comps-based counter.
- Current owner paid $62k; list at $230k implies a 268% gain — meaningful room to come down on a strong offer.
Risks & watch-outs
- Climate carrying-cost: moderate flood risk — expect insurance premiums to compound above CPI over the hold.
Questions for the listing agent
- It's been on market 104 days. Have you received any prior offers? Is the seller open to a 9% concession, seller financing, or rate buy-down credit?
- Why hasn't it sold? Are there any deal-killer items the seller is aware of (foundation, flood, title, zoning, code violations)?
- Is there a deadline driving the sale (1031 exchange, divorce, estate, relocation)? That informs how much negotiation room exists.
- What's the average days-on-market for RENTAL listings here right now (not sales)? A rising rental-DOM trend means longer vacancies and softer asking-rent achievability than the comps imply.
- What's the recent tenant-quality profile in this submarket — average credit score on applications, eviction rate, late-payment / NSF rate, and stable-employment percentage? A property-management company in the area should have these aggregated.
- How much new for-sale + rental construction is in the pipeline within 1–3 miles? Heavy new supply typically softens prices + rents 12–24 months out; constrained supply supports both.
Investment metrics
- 1% rule
- 1.16% ✓
- Cap rate
- 9.84%
- Cash-on-cash
- 12.67%
- DSCR
- 1.56
- GRM
- 7.2
CMA / ARV
- ARV (median comp)
- $139,000
- List price
- $229,995
- Delta
- 65.46%
- Verdict
- OVERPRICED
- Comps
- 3 within 1.0 mi
Show comp detail 12 sales within ~0.75 mi
| Address | Dist | Beds/Ba | Sqft | Sold | Price | $/sf | Match |
|---|---|---|---|---|---|---|---|
| 836 Harman Way S #45 | 0.00mi | 3/2.0 | 1,709 (+0%) | 20mo | $125,000 | $73 | 83 |
| 836 Harman Way S #26 | 0.00mi | 3/2.0 | 1,560 (-8%) | 7mo | $137,000 | $88 | 80 |
| 836 Harman Way S #94 | 0.00mi | 3/2.0 | 1,560 (-8%) | 14mo | $108,000 | $69 | 74 |
| 836 Harman Way S #28 | 0.00mi | 3/2.0 | 1,762 (+4%) | 24mo | $135,000 | $77 | 74 |
| 836 S Harman Way #4 | 0.00mi | 2/2.0 (-1) | 1,499 (-12%) | 4mo | $139,000 | $93 | 72 |
| 836 Harman Way S #6 | 0.00mi | 3/2.0 | 1,848 (+9%) | 17mo | $115,000 | $62 | 71 |
| 836 S Harman Way #93 | 0.00mi | 2/2.0 (-1) | 1,590 (-7%) | 16mo | $169,500 | $107 | 70 |
| 310 Oak St SW | 0.28mi | 3/2.0 | 1,737 (+2%) | 18mo | $484,950 | $279 | 68 |
| 836 Harman Way S #34 | 0.00mi | 2/2.0 (-1) | 1,507 (-12%) | 14mo | $128,900 | $86 | 64 |
| 314 Willow St SW | 0.30mi | 3/2.0 | 1,752 (+3%) | 21mo | $460,000 | $263 | 64 |
| 816 Maple Ln SW | 0.29mi | 2/2.0 (-1) | 1,668 (-2%) | 20mo | $439,950 | $264 | 62 |
| 836 Harman Way S #63 | 0.00mi | 2/2.0 (-1) | 1,507 (-12%) | 21mo | $137,500 | $91 | 59 |
Match score weights: distance 35% · size 25% · config 20% · recency 20%. Top-matched comps best support the ARV.
Projected returns pro-forma
-3.0% appreciation · 3.0% rent growth · sell at horizon
- IRR
- 2.4%
- Equity multiple
- 1.09×
- Total profit
- $5,989
- Equity at exit
- $34,293
- IRR
- 12.0%
- Equity multiple
- 1.94×
- Total profit
- $60,744
- Equity at exit
- $19,886
Cash invested: $64,399 (down + closing). Projections, not guarantees.
Landlord ↔ Tenant lean methodology
- Overall (STATE)
- 28 Tenant-Leaning
- State Washington
- 28 Tenant-Leaning · D+8
- County
- — inherits STATE
- City
- — inherits STATE
ZIP-level market 98360
- Home prices YoY
- -34.8%
- Active inventory
- 136
- Price-to-rent
- 7.2×
Monthly cashflow live
- Estimated rent
- $2,662 medium interval (Pro) →
- Mortgage (P&I)
- −$1,206
- Tax from tax record
- −$121 /mo · $1,447/yr
- Insurance
- −$96
- HOA
- −$0
- Vacancy / Maint / Mgmt
- −$559
- Net cashflow
- $680
Break-even live
Sensitivity live
| Price | -10% $810 | -5% $745 | +0% $680 | +5% $615 | +10% $550 |
|---|---|---|---|---|---|
| Rent | -10% $470 | -5% $575 | +0% $680 | +5% $785 | +10% $890 |
| Rate | -1.0pp $796 | -0.5pp $739 | base $680 | +0.5pp $621 | +1.0pp $560 |
UW: 25.0% down · 7.5% · 30yr · 1.5% tax · 5.0% vac · 8.0% maint · 8.0% mgmt
Financing live
Cash to close
- Down payment
- $57,499
- Closing costs
- $6,900
- Reserves months
- —
- Total cash needed
- —
Loan-product check · same deal, 3 products live
Conventional
25% down · 7.5% · 30yr
- Down + closing
- —
- Monthly P&I
- —
- Monthly cashflow
- —
- DSCR
- —
- Eligible?
- —
Personal DTI + credit; lowest rate.
DSCR
20% down · 8.5% · 30yr
- Down + closing
- —
- Monthly P&I
- —
- Monthly cashflow
- —
- DSCR
- —
- Eligible?
- —
No personal income docs; deal must DSCR.
Hard money
10% down · 12.0% · 12mo
- Down + closing
- —
- Monthly P&I
- —
- Monthly cashflow
- —
- DSCR
- —
- Eligible?
- —
Short-term bridge; refi at stabilization.
Listing history 17 events
-
2026-06-21days on market $229,995 Active 104 DOM
-
2026-06-18days on market $229,995 Active 101 DOM
-
2026-06-17days on market $229,995 Active 100 DOM
-
2026-06-16days on market $229,995 Active 99 DOM
-
2026-06-15days on market $229,995 Active 98 DOM
-
2026-06-13days on market $229,995 Active 96 DOM
-
2026-06-13days on market $229,995 Active 95 DOM
-
2026-06-10days on market $229,995 Active 92 DOM
-
2026-06-04days on market $229,995 Active 91 DOM
-
2026-06-03days on market $229,995 Active 90 DOM
-
2026-06-02days on market $229,995 Active 89 DOM
-
2026-06-01days on market $229,995 Active 88 DOM
-
2026-05-31days on market $229,995 Active 87 DOM
-
2026-03-05$229,995 Active
-
2008-07-23soldstatus $62,500
-
2008-07-01historical
-
2007-12-31$70,000
ⓘ Source: listings_history table (triggers on properties + properties_extension) + one-shot
backfill from property_details.listing_events for pre-trigger history.
Tax reassessment forecast WA · Resets to sale price
- Current annual tax
- $1,447 · $121/mo
- Projected year-2 tax
- $2,254 · $188/mo
- Expected delta
- +$807/yr (+$67/mo · 55.8%)
ⓘ Screening estimate from a state-policy table — verify with the county assessor before closing.
Climate risk First Street
- Flood 5/10 Major FEMA zone X (shaded) · 24% chance over 30 yrs
- Wildfire 3/10 Moderate
- Heat 3/10 Moderate 8 d/yr ≥87°F today · 17 d/yr by 30 yrs out
- Wind 1/10 Low
- Air quality 7/10 Severe 9 unhealthy d/yr today · 10 by 30 yrs out
Nearby sold comps map
Loading sold comps map…
Walkable amenities ~0.75 mi
Loading nearby amenities…
Taxation est. · year 1
- Rental income
- $31,940
- − Mortgage interest
- −$12,883
- − Property taxes
- −$1,447
- − Insurance
- −$1,150
- − Repairs & maintenance
- −$2,555
- − Management
- −$2,555
- − Depreciation
- −$6,691
- Taxable income
- $4,658
- Est. tax owed @ 24.0%
- −$1,118
- After-tax cash flow
- $7,044/yr
For passive investors: Depreciation is non-cash, so a rental often shows a tax loss while cash-flowing — sheltering income. Rental losses are passive: they offset passive income freely, and up to $25,000/yr can offset ordinary (W-2) income if you actively participate and your MAGI is under $100k (phasing out to $0 by $150k); unused losses carry forward. On sale, claimed depreciation is recaptured at up to 25%, and gains may owe capital-gains tax (a 1031 exchange can defer both). Figures are a year-1 estimate at your 24.0% rate — not tax advice; consult a CPA.
Schools (NCES district)
- District
- Orting School District
- NCES district ID
- 5306450
- Math proficiency
- 40% ▬ 0.00%
- Reading proficiency
- 56% ▬ 0.00%
- Median HH income
- $72,768
- Composite
- 45.37/100
- National rank
- #5719
- State rank
- #142 of 291 in WA
Livability — Orting
- Score
- 74/100
- State rank
- #185
- US rank
- #4905
Category grades
Schools grade is shown separately in the Schools card above.
Census & demographics
- Census place
- Orting, WA
- Population (ZIP)
- 14,986
Population outlook (Pierce County) Hauer SSP2
- Today (2025)
- 956,648 people
- By 2030
- 1,010,862 · +5.7%
- By 2040
- 1,113,170 · +16.4%
- By 2050
- 1,206,524 · +26.1%
- By 2075
- 1,436,425 · +50.2%
- By 2100
- 1,563,654 · +63.5%
Race, ethnicity, and origin ACS 2023
- Neighborhood character
- Predominantly White (81%)
- Race & ethnicity
- White 81% Hispanic / Latino 9% Two or more races 9% Asian 1% Native American 1%
- Hispanic origin (detail)
- Mexican 7%
- Common ancestry
- Portuguese 6% Italian 4% Slovak 3%
- Foreign-born
- 4% · Canada
- Languages at home
- 93% English-only · Spanish 5% German/W. Germanic 1%
Political lean MEDSL · Pierce
- 2024 margin
- D (+10.8) · D 53.9% · R 43.1% · Other 3.0%
- 2008→2024 swing
- -1.4pp toward R · 2008: 12.2pp · 2024: 10.8pp
- All cycles
- 2024: D+10.8 2020: D+11.2 2016: D+7.5 2012: D+11.0 2008: D+12.2
Not yet ingested
- Civics
- —
Market trends
- HPI YoY
- ▼ -155.26%
- Current HPI
- 290.3575
- Rent YoY
- —
- Metro
- —
- State GDP YoY
- ▲ 4.65%
- F500 in state
- 22
Industry mix (Fortune 500 HQ in WA)
| Industry | F500 HQs | Revenue |
|---|---|---|
| Retail | 2 | $269B |
|
||
| Technology / Retail | 1 | $638B |
|
||
| Technology | 1 | $245B |
|
||
| Telecommunications | 1 | $38B |
|
||
| Food / Beverage | 1 | $36B |
|
||
| Automotive / Trucks | 1 | $34B |
|
||
Price history
+228.6% since first listed4 events — show timeline
- 2026-03-05 Listed $229,995 NWMLS as Distributed by MLS Grid
- 2008-07-23 Sold (MLS) $62,500 NWMLS as Distributed by MLS Grid
- 2008-07-01 Delisted — NWMLS as Distributed by MLS Grid
- 2007-12-31 Listed $70,000 NWMLS as Distributed by MLS Grid
Property tax history
+3.9%/yrLatest (2026): $1,447 · +4.5% YoY. Source: county tax records.
Cash-flow waterfall
monthlySold comps — $/sqft
last 12 mo · ≤1 miLoading sold comps…