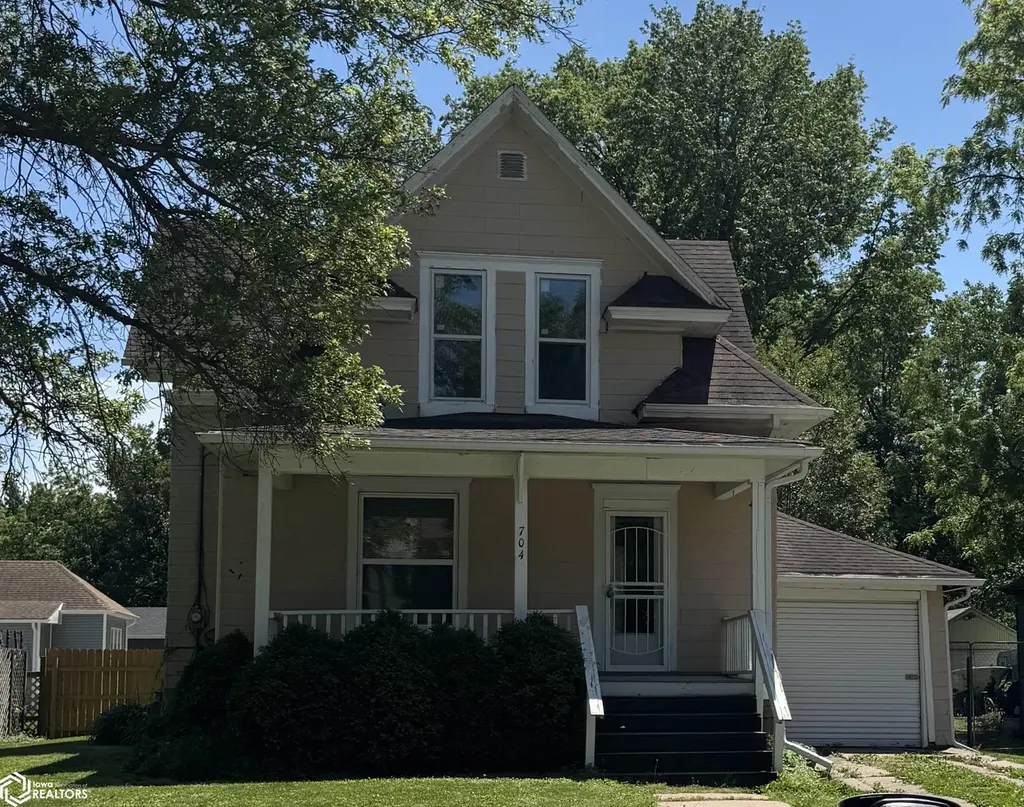
704 W Summit Ave. Ave · Shenandoah, IA
Flood risk 1/10 · Minimal
- FEMA flood zone
- X (unshaded)
- Chance of flooding over 30 yrs
- 0.0%
- Est. flood insurance / yr
- $473 – $860
Fire risk 1/10 · Minimal
- Est. fire insurance / yr
- $902 – $1,676
Heat risk 4/10 · Minor
- Hot days now (above 106°F)
- 7 days/yr
- Hot days in 30 yrs
- 15 days/yr
Wind risk 2/10 · Minimal
- Chance of severe wind over 30 yrs
- —
Air-quality risk 1/10 · Minimal
- Unhealthy air days now
- 0 days/yr
- Unhealthy air days in 30 yrs
- 0 days/yr
Risk factors via First Street. Map © Google.
Why this score? — see what drove the C+ grade
The composite is a weighted blend of 9 inputs, each scored 0–100. Each bar is that input's sub-score; the figure is the points it added to the 100-point composite (weight × sub-score).
- Cash flow +23.8/30.0
- ARV discount +11.3/15.0
- DSCR +7.7/10.0
- 1% rule +5.6/10.0
- Schools +5.6/10.0
- Livability +3.8/5.0
- Rent growth +2.5/5.0
- Condition / age +2.5/5.0
- Appreciation +0.0/10.0
$127,500
🖨 Deal sheet (PDF) 📄 Offer letter ✓ Due diligence
Listing remarks MLS
If you like hardwood floors and character in a home you need to see this one. Wood floors throughout home. Carpet in only 1 bedroom. Built ins in kitchen and dining room. Beautiful staircase leads to 2 large bedrooms upstairs with full bath. Brand new furnace and central air conditioning. Front porch has been redone with composite boards for no maintenance. Ready for you to pull up a chair and relax.
Key facts
- Wood flooring
- Remodeled bathroom
- Kitchen
Tags
Property features AI
Exterior
- Parking: Attached garage (1 space); Gravel parking
- Utilities: Public water; Public sewer
- Home design: Single-family residence; One and one-half stories
- Construction: Other construction materials
- Exterior features: Fenced yard
Interior
- Kitchen: Range; Refrigerator
- Flooring: Concrete; Hardwood; Laminate
- Bathrooms: One three-quarter bathroom
- Heating & cooling: Forced air heating; Central air conditioning
- Interior features: Range, Refrigerator, Electric Water Heater; Basement
- Laundry & utility: Washer, Dryer
Neighborhood map
What this means for you Summary
Snapshot
- This is a 2-bed/1.0-bath single-family listed at $128k.
Deal economics
- At list price, monthly cash flow is $246 ($3k/yr) — positive.
- The deal already cash-flows at list — no discount required.
- Meets the 1% rule at list price ($1k rent vs $128k).
- Recommended offer: $126k (1.5% below list) — sets the bar for market timing.
Location & tenants
- Location reads 76/100 on livability (#206 in IA, #3,757 nationally) — a middle-class / working-renter tenant base. Strengths: cost of living A+, housing A+, health & safety A+; Watch: crime D-, amenities F, commute F.
- Shenandoah Community School District (town): math 64% / reading 69% proficiency, ranked #190 of 289 in IA (top 66%) — acceptable for families but not a draw, mixed tenant base, ~2y average lease.
- Market conditions: 24 active listings in the ZIP; 25 units permitted in Page County in 2024 (0 in 5+ unit buildings).
Forward outlook
- Local home prices are declining (-3.0%/yr); year-one equity from $882 of loan paydown is wiped out by about $4k of value loss. Plan a longer hold.
- Page County population projected at -12% by 2050 — secular population decline; favor cash flow + early exit over multi-decade hold.
Negotiation context
- It's been on market 25 days — a 2% lower offer ($126k) is reasonable based on typical stale-listing flexibility.
- 2 sale attempts since 4y ago with the ask held roughly flat each time — persistent listings suggest the price (not the market) is what's stuck; bring a comps-based counter.
- Current owner paid $70k; list at $128k implies a 82% gain — meaningful room to come down on a strong offer.
Risks & watch-outs
- Watch-outs: built in 1900 — expect roof / HVAC / electrical / plumbing capex.
Questions for the listing agent
- Built in 1900 — when were the roof, HVAC, electrical panel, plumbing, and water heater last replaced?
- Is there a deadline driving the sale (1031 exchange, divorce, estate, relocation)? That informs how much negotiation room exists.
- Schools are B-rated — typically a magnet for longer-tenancy family renters. What's the average tenant stay here, and is there a school-zone premium baked into asking?
- Crime grade is D in this area — have there been break-ins, vandalism, or insurance claims at this property in the last 3 years? What carrier currently insures it and at what premium?
- What's the average days-on-market for RENTAL listings here right now (not sales)? A rising rental-DOM trend means longer vacancies and softer asking-rent achievability than the comps imply.
- What's the recent tenant-quality profile in this submarket — average credit score on applications, eviction rate, late-payment / NSF rate, and stable-employment percentage? A property-management company in the area should have these aggregated.
- How much new for-sale + rental construction is in the pipeline within 1–3 miles? Heavy new supply typically softens prices + rents 12–24 months out; constrained supply supports both.
Investment metrics
- 1% rule
- 1.06% ✓
- Cap rate
- 8.61%
- Cash-on-cash
- 8.26%
- DSCR
- 1.37
- GRM
- 7.8
CMA / ARV
- ARV (on-the-fly)
- $139,324
- Comps found
- 8
Show comp detail 8 sales within ~0.75 mi
| Address | Dist | Beds/Ba | Sqft | Sold | Price | $/sf | Match |
|---|---|---|---|---|---|---|---|
| 908 W Nishna Rd | 0.23mi | 3/2.0 (+1) | 1,112 (-3%) | 6mo | $145,000 | $130 | 70 |
| 806 5th Ave | 0.35mi | 2/2.0 | 1,290 (+13%) | 2mo | $95,000 | $74 | 56 |
| 204 W Nishna Rd | 0.37mi | 2/2.0 | 1,064 (-7%) | 15mo | $90,000 | $85 | 55 |
| 107 Swanson Dr | 0.52mi | 3/2.0 (+1) | 1,144 (+0%) | 18mo | $160,000 | $140 | 52 |
| 907 8th Ave | 0.26mi | 2/1.0 | 1,003 (-12%) | 20mo | $67,900 | $68 | 51 |
| 601 Matthews St | 0.71mi | 3/1.0 (+1) | 1,110 (-3%) | 8mo | $139,000 | $125 | 51 |
| 405 Park Ave | 0.34mi | 2/1.0 | 1,308 (+14%) | 21mo | $160,000 | $122 | 43 |
| 310 E Washington Ave | 0.65mi | 2/1.0 | 1,058 (-7%) | 19mo | $82,000 | $78 | 41 |
Match score weights: distance 35% · size 25% · config 20% · recency 20%. Top-matched comps best support the ARV.
Projected returns pro-forma
-3.0% appreciation · 3.0% rent growth · sell at horizon
- IRR
- -3.8%
- Equity multiple
- 0.86×
- Total profit
- $-5,019
- Equity at exit
- $19,011
- IRR
- 5.9%
- Equity multiple
- 1.44×
- Total profit
- $15,733
- Equity at exit
- $11,024
Cash invested: $35,700 (down + closing). Projections, not guarantees.
Landlord ↔ Tenant lean methodology
- Overall (STATE)
- 83 Strongly Landlord-Friendly
- State Iowa
- 83 Strongly Landlord-Friendly · R+6
- County
- — inherits STATE
- City
- — inherits STATE
ZIP-level market 51601
- Home prices YoY
- -14.9%
- Active inventory
- 24
- Price-to-rent
- 7.8×
Monthly cashflow live
- Estimated rent
- $1,357 medium interval (Pro) →
- Mortgage (P&I)
- −$669
- Tax from tax record
- −$104 /mo · $1,252/yr
- Insurance
- −$53
- HOA
- −$0
- Vacancy / Maint / Mgmt
- −$285
- Net cashflow
- $246
Break-even live
Sensitivity live
| Price | -10% $318 | -5% $282 | +0% $246 | +5% $210 | +10% $174 |
|---|---|---|---|---|---|
| Rent | -10% $139 | -5% $192 | +0% $246 | +5% $299 | +10% $353 |
| Rate | -1.0pp $310 | -0.5pp $278 | base $246 | +0.5pp $213 | +1.0pp $179 |
UW: 25.0% down · 7.5% · 30yr · 1.5% tax · 5.0% vac · 8.0% maint · 8.0% mgmt
Financing live
Cash to close
- Down payment
- $31,875
- Closing costs
- $3,825
- Reserves months
- —
- Total cash needed
- —
Loan-product check · same deal, 3 products live
Conventional
25% down · 7.5% · 30yr
- Down + closing
- —
- Monthly P&I
- —
- Monthly cashflow
- —
- DSCR
- —
- Eligible?
- —
Personal DTI + credit; lowest rate.
DSCR
20% down · 8.5% · 30yr
- Down + closing
- —
- Monthly P&I
- —
- Monthly cashflow
- —
- DSCR
- —
- Eligible?
- —
No personal income docs; deal must DSCR.
Hard money
10% down · 12.0% · 12mo
- Down + closing
- —
- Monthly P&I
- —
- Monthly cashflow
- —
- DSCR
- —
- Eligible?
- —
Short-term bridge; refi at stabilization.
Listing history 21 events
-
2026-06-21days on market $127,500 Active 25 DOM
-
2026-06-18days on market $127,500 Active 23 DOM
-
2026-06-17days on market $127,500 Active 22 DOM
-
2026-06-16days on market $127,500 Active 21 DOM
-
2026-06-15days on market $127,500 Active 20 DOM
-
2026-06-13days on market $127,500 Active 18 DOM
-
2026-06-12days on market $127,500 Active 17 DOM
-
2026-06-09days on market $127,500 Active 14 DOM
-
2026-06-08days on market $127,500 Active 13 DOM
-
2026-06-07days on market $127,500 Active 12 DOM
-
2026-06-07days on market $127,500 Active 11 DOM
-
2026-06-04days on market $127,500 Active 8 DOM
-
2026-06-02days on market $127,500 Active 7 DOM
-
2026-06-01days on market $127,500 Active 6 DOM
-
2026-05-31days on market $127,500 Active 5 DOM
-
2026-05-31days on market $127,500 Active 4 DOM
-
2026-05-26$127,500 Active
-
2022-11-14soldstatus $70,000
-
2022-11-08soldstatus $70,000 403-char remark
Show marketing remark (403 chars)
If you like hardwood floors and character in a home you need to see this one. Wood floors throughout home. Carpet in only 1 bedroom. Built ins in kitchen and dining room. Beautiful staircase leads to 2 large bedrooms upstairs with full bath. Brand new furnace and central air conditioning. Front porch has been redone with composite boards for no maintenance. Ready for you to pull up a chair and relax.
-
2022-08-30$75,000 403-char remark
Show marketing remark (403 chars)
If you like hardwood floors and character in a home you need to see this one. Wood floors throughout home. Carpet in only 1 bedroom. Built ins in kitchen and dining room. Beautiful staircase leads to 2 large bedrooms upstairs with full bath. Brand new furnace and central air conditioning. Front porch has been redone with composite boards for no maintenance. Ready for you to pull up a chair and relax.
-
2013-09-25soldstatus $10,500
ⓘ Source: listings_history table (triggers on properties + properties_extension) + one-shot
backfill from property_details.listing_events for pre-trigger history.
Tax reassessment forecast IA · Partial reset (capped growth)
- Current annual tax
- $1,252 · $104/mo
- Projected year-2 tax
- $1,627 · $136/mo
- Expected delta
- +$375/yr (+$31/mo · 29.9%)
ⓘ Screening estimate from a state-policy table — verify with the county assessor before closing.
Climate risk First Street
- Flood 1/10 Low FEMA zone X (unshaded) · 0% chance over 30 yrs
- Wildfire 1/10 Low
- Heat 4/10 Moderate 7 d/yr ≥106°F today · 15 d/yr by 30 yrs out
- Wind 2/10 Low
- Air quality 1/10 Low 0 unhealthy d/yr today · 0 by 30 yrs out
Nearby sold comps map
Loading sold comps map…
Walkable amenities ~0.75 mi
Loading nearby amenities…
Taxation est. · year 1
- Rental income
- $16,282
- − Mortgage interest
- −$7,142
- − Property taxes
- −$1,252
- − Insurance
- −$638
- − Repairs & maintenance
- −$1,303
- − Management
- −$1,303
- − Depreciation
- −$3,709
- Taxable income
- $936
- Est. tax owed @ 24.0%
- −$225
- After-tax cash flow
- $2,725/yr
For passive investors: Depreciation is non-cash, so a rental often shows a tax loss while cash-flowing — sheltering income. Rental losses are passive: they offset passive income freely, and up to $25,000/yr can offset ordinary (W-2) income if you actively participate and your MAGI is under $100k (phasing out to $0 by $150k); unused losses carry forward. On sale, claimed depreciation is recaptured at up to 25%, and gains may owe capital-gains tax (a 1031 exchange can defer both). Figures are a year-1 estimate at your 24.0% rate — not tax advice; consult a CPA.
Schools (NCES district)
- District
- Shenandoah Community School District
- NCES district ID
- 1926070
- Math proficiency
- 64% ▼ -10.00%
- Reading proficiency
- 69% ▼ -5.00%
- Median HH income
- $41,835
- Composite
- 55.67/100
- National rank
- #1225
- State rank
- #190 of 289 in IA
Livability — Shenandoah
- Score
- 76/100
- State rank
- #206
- US rank
- #3757
Category grades
Schools grade is shown separately in the Schools card above.
Census & demographics
- Census place
- Shenandoah, IA
- Population (ZIP)
- 5,562
Population outlook (Page County) Hauer SSP2
- Today (2025)
- 15,052 people
- By 2030
- 14,709 · -2.3%
- By 2040
- 13,981 · -7.1%
- By 2050
- 13,302 · -11.6%
- By 2075
- 11,678 · -22.4%
- By 2100
- 9,213 · -38.8%
Race, ethnicity, and origin ACS 2023
- Neighborhood character
- Predominantly White (94%)
- Race & ethnicity
- White 94% Hispanic / Latino 3% Two or more races 3%
- Common ancestry
- Greek 3% Lithuanian 2% Iranian 2%
- Foreign-born
- 1% · Canada
- Languages at home
- 97% English-only · Spanish 1%
Political lean MEDSL · Page
- 2024 margin
- Solid R (+42.4) · D 28.2% · R 70.6% · Other 1.1%
- 2008→2024 swing
- -22.7pp toward R · 2008: -19.7pp · 2024: -42.4pp
- All cycles
- 2024: R+42.4 2020: R+43.0 2016: R+44.1 2012: R+24.9 2008: R+19.7
Not yet ingested
- Civics
- —
Market trends
- HPI YoY
- ▼ -31.90%
- Current HPI
- 181.7259
- Rent YoY
- —
- Metro
- —
- State GDP YoY
- ▲ 2.48%
- F500 in state
- 4
Industry mix (Fortune 500 HQ in IA)
| Industry | F500 HQs | Revenue |
|---|---|---|
| Financial Services | 1 | $16B |
|
||
| Retail / Convenience | 1 | $15B |
|
||
Price history
+1114.3% since first listed5 events — show timeline
- 2026-05-26 Listed $127,500 IAR
- 2022-11-14 Sold (Public Records) $70,000 Public Records
- 2022-11-08 Sold (MLS) $70,000 IAR
- 2022-08-30 Listed $75,000 IAR
- 2013-09-25 Sold (Public Records) $10,500 Public Records
Property tax history
+13.5%/yrLatest (2025): $1,252 · -1.4% YoY. Source: county tax records.
Cash-flow waterfall
monthlySold comps — $/sqft
last 12 mo · ≤1 miLoading sold comps…