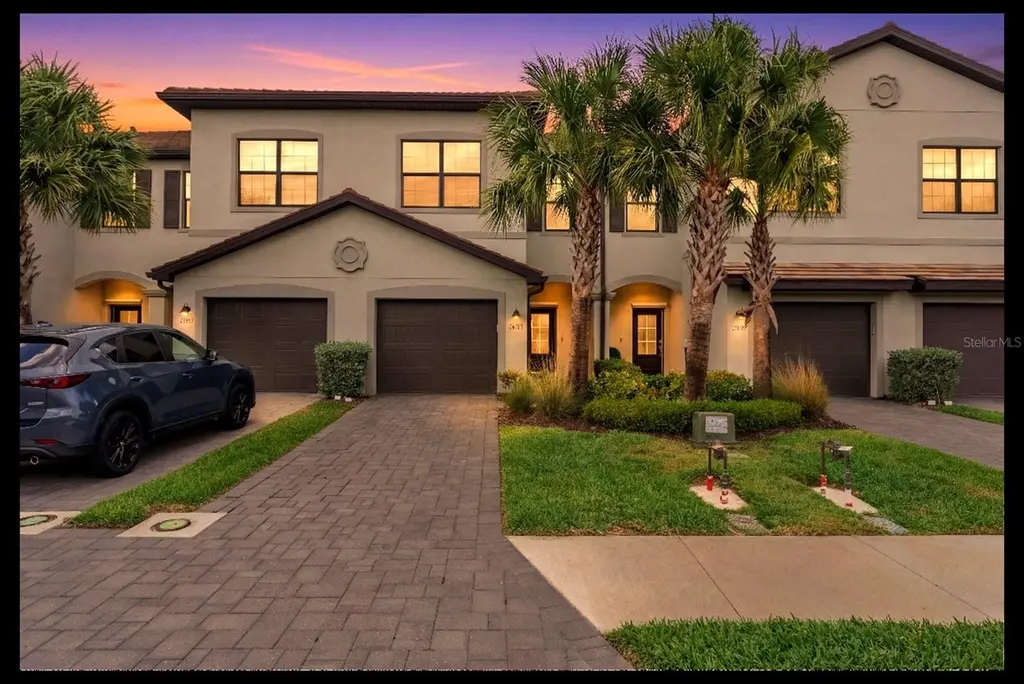
15171 Sunny Day Dr · Lakewood Ranch, FL
Flood risk 1/10 · Minimal
- FEMA flood zone
- X (unshaded)
- Chance of flooding over 30 yrs
- 0.0%
- Est. flood insurance / yr
- $507 – $1,088
Fire risk 4/10 · Minor
- Est. fire insurance / yr
- $947 – $1,759
Heat risk 10/10 · Severe
- Hot days now (above 109°F)
- 7 days/yr
- Hot days in 30 yrs
- 28 days/yr
Wind risk 10/10 · Severe
- Chance of severe wind over 30 yrs
- 99.0%
Air-quality risk 3/10 · Minor
- Unhealthy air days now
- 2 days/yr
- Unhealthy air days in 30 yrs
- 2 days/yr
Risk factors via First Street. Map © Google.
Why this score? — see what drove the D grade
The composite is a weighted blend of 9 inputs, each scored 0–100. Each bar is that input's sub-score; the figure is the points it added to the 100-point composite (weight × sub-score).
- Cash flow +12.6/30.0
- ARV discount +8.0/15.0
- 1% rule +5.5/10.0
- Schools +4.4/10.0
- Condition / age +4.0/5.0
- DSCR +3.7/10.0
- Livability +2.5/5.0
- Rent growth +1.2/5.0
- Appreciation +0.0/10.0
$329,000
🖨 Deal sheet (PDF) 📄 Offer letter ✓ Due diligence
Listing remarks
Under contract-accepting backup offers. One or more photo(s) has been virtually staged. Welcome to your dream lifestyle in the heart of Lakewood Ranch! This stunning two-story townhome perfectly captures the essence of Florida living with a serene water view that greets you the moment you step toward your screened lanai. The main floor features a seamless kitchen and living room combination, creating an inviting open-concept space perfect for hosting friends or enjoying quiet evenings at home. Upstairs, you will find a thoughtful layout where all three bedrooms reside, offering a private retreat from the main living areas. This home also includes a convenient one-car garage equipped with an
Key facts
- One-car garage
- Hot tub
- Open-concept space
Tags
Property features AI
Finance
- Other: Total annual fees listed as $4,672; total monthly fees listed as $389.33
- Financial info: CDD assessed on property; Lease restrictions apply
- HOA & community: Has HOA; association approval required; Monthly HOA approximately $237.67 (quarterly fee shown as $713); Association covers 24-hour guard, common area taxes, pool, escrow reserves; Community amenities: clubhouse, community mailbox, deed restrictions, dog park, fitness center, playground, pool, sidewalks, tennis courts; Pets allowed
Exterior
- Parking: Attached 1-car garage
- Security: 24-hour guard (community amenity)
- Utilities: Public water; Public sewer; Electricity connected; Irrigation with reclaimed water (community)
- Home design: Residential townhouse; Two stories; Faces south; Entry level: Two-level design
- Construction: Stucco construction; Tile roof; Other foundation
- Exterior features: Pond view; Paved road access
Interior
- Kitchen: Other appliances
- Bedrooms: 3 bedrooms
- Flooring: Carpet; Ceramic tile
- Bathrooms: 2 full baths, 1 half bath
- Heating & cooling: Central heating; Central air conditioning
- Interior features: Open floorplan; Sliding doors
- Laundry & utility: Laundry closet
Neighborhood map
What this means for you Summary
Snapshot
- This is a 3-bed/2.5-bath townhouse listed at $329k. Condition is rated good.
Deal economics
- At list price, monthly cash flow is $-43 ($-521/yr) — negative.
- To cash-flow at today's rent, offer at most $321k (2.3% below list).
- Meets the 1% rule at list price ($3k rent vs $329k).
- Recommended offer: $309k (6.0% below list) — sets the bar for market timing.
- Cap rate 6.1% vs local median 3.3% in Lakewood Ranch — top-decile yield for the area; either an underpriced asset or a hidden risk that comps aren't pricing in. Stress-test before assuming the spread holds.
Location & tenants
- Location reads: area grade D — affects rentability + tenant quality, not the cash-flow math above.
- Manatee (suburban): math 54% / reading 50% proficiency, ranked #26 of 73 in FL (top 36%) — acceptable for families but not a draw, mixed tenant base, ~2y average lease.
- Zoned schools: B.D. Gullett Elementary School (math 78% / reading 73%, grade A, #211 of 2,144 statewide, top 10%, 1,121 students, 20% FRL); R. Dan Nolan Middle School (math 79% / reading 72%, grade A, #38 of 571 statewide, top 7%, 760 students, 28% FRL); Lakewood Ranch High School (math 47% / reading 63%, grade C, #135 of 667 statewide, top 20%, 2,435 students, 22% FRL) — zoned schools average 23% FRL vs 51% district-wide (27 pts lower); this property's tenant base skews higher-income than the district average.
- Zoned-school proficiency averages 69% at this address vs 52% district-wide (+17 pts) — the actual schools serving this property are materially stronger than the Manatee average implies; a family-tenant draw the district grade alone would hide.
- Market conditions: Rents falling (-5.2%/yr); 1164 active listings in the ZIP; 40 comparable units currently listed for rent nearby; rentals at typical pace (median 26d on market — plan ~3-4 weeks tenant-placement turnaround); high-income renter base; 7,472 units permitted in Manatee County in 2024 (1,782 in 5+ unit buildings).
- This rent runs 34% of the median local income ($120k/yr) — at the standard rent-burdened threshold; future hikes will face affordability resistance.
Forward outlook
- Local home prices are declining (-3.0%/yr); year-one equity from $2k of loan paydown is wiped out by about $10k of value loss. Plan a longer hold.
- Manatee County population projected at +43% by 2050 — long-run rental-demand tailwind backs the buy-and-hold thesis.
Negotiation context
- It's been on market 65 days — a 6% lower offer ($309k) is reasonable based on typical stale-listing flexibility.
- 8 sale attempts since 2y ago with the ask held roughly flat each time — persistent listings suggest the price (not the market) is what's stuck; bring a comps-based counter.
Risks & watch-outs
- Climate carrying-cost: severe wind risk, 99% chance of damaging wind over 30y; extreme-heat days projected 7→28/yr by 2055 (HVAC capex compounding) — expect insurance premiums to compound above CPI over the hold.
Questions for the listing agent
- What do current leases actually rent for vs. the listed asking? Can we see a recent rent roll and the last 12 months of T-12 income?
- It's been on market 65 days. Have you received any prior offers? Is the seller open to a 6% concession, seller financing, or rate buy-down credit?
- What does the HOA fee cover, when was the last increase, and are there any pending special assessments or reserve-fund shortfalls?
- Why hasn't it sold? Are there any deal-killer items the seller is aware of (foundation, flood, title, zoning, code violations)?
- Is there a deadline driving the sale (1031 exchange, divorce, estate, relocation)? That informs how much negotiation room exists.
- The area grade is low — what's the realistic commute time and amenity access for the typical tenant pool here? Any planned neighborhood developments (good or bad) we should know about?
- What's the average days-on-market for RENTAL listings here right now (not sales)? A rising rental-DOM trend means longer vacancies and softer asking-rent achievability than the comps imply.
- What's the recent tenant-quality profile in this submarket — average credit score on applications, eviction rate, late-payment / NSF rate, and stable-employment percentage? A property-management company in the area should have these aggregated.
- How much new for-sale + rental construction is in the pipeline within 1–3 miles? Heavy new supply typically softens prices + rents 12–24 months out; constrained supply supports both.
Investment metrics
- 1% rule
- 1.05% ✓
- Cap rate
- 6.13%
- Cash-on-cash
- -0.57%
- DSCR
- 0.97
- GRM
- 8.0
CMA / ARV
- ARV (on-the-fly)
- $333,025
- Comps found
- 12
Show comp detail 12 sales within ~0.75 mi
| Address | Dist | Beds/Ba | Sqft | Sold | Price | $/sf | Match |
|---|---|---|---|---|---|---|---|
| 15183 Lyla Ter | 0.09mi | 3/2.5 | 1,925 (0%) | 4mo | $336,000 | $175 | 92 |
| 14717 Lyla Ter | 0.08mi | 3/2.5 | 1,925 (0%) | 6mo | $333,000 | $173 | 91 |
| 15247 Sunny Day Dr | 0.06mi | 3/2.5 | 1,887 (-2%) | 3mo | $325,000 | $172 | 91 |
| 15164 Sunny Day Dr | 0.03mi | 3/2.5 | 1,925 (0%) | 10mo | $320,000 | $166 | 91 |
| 15127 Lyla Ter | 0.09mi | 3/2.5 | 1,925 (0%) | 6mo | $297,500 | $155 | 90 |
| 15233 Lyla Ter | 0.10mi | 3/2.5 | 1,925 (0%) | 6mo | $300,000 | $156 | 90 |
| 14820 Lyla Ter | 0.13mi | 3/2.5 | 1,925 (0%) | 7mo | $305,000 | $158 | 88 |
| 15147 Sunny Day Dr | 0.02mi | 3/2.5 | 1,887 (-2%) | 9mo | $350,000 | $185 | 88 |
| 15147 Lyla Ter | 0.09mi | 3/2.5 | 1,887 (-2%) | 6mo | $330,000 | $175 | 87 |
| 15242 Sunny Day Dr | 0.07mi | 3/2.5 | 1,879 (-2%) | 7mo | $340,000 | $181 | 87 |
| 14756 Lyla Ter | 0.12mi | 3/2.5 | 1,879 (-2%) | 8mo | $310,000 | $165 | 84 |
| 5307 Calypso Ct | 0.21mi | 3/2.0 | 2,200 (+14%) | 2mo | $501,000 | $228 | 63 |
Match score weights: distance 35% · size 25% · config 20% · recency 20%. Top-matched comps best support the ARV.
Projected returns pro-forma
-3.0% appreciation · 0.0% rent growth · sell at horizon
- IRR
- -21.3%
- Equity multiple
- 0.29×
- Total profit
- $-65,805
- Equity at exit
- $49,055
- IRR
- -27.0%
- Equity multiple
- -0.07×
- Total profit
- $-98,381
- Equity at exit
- $28,446
Cash invested: $92,120 (down + closing). Projections, not guarantees.
Landlord ↔ Tenant lean methodology
- Overall (STATE)
- 87 Strongly Landlord-Friendly
- State Florida
- 87 Strongly Landlord-Friendly · R+3
- County
- — inherits STATE
- City
- — inherits STATE
ZIP-level market 34211
- Home prices YoY
- -27.5%
- Rents YoY
- -5.2%
- Active inventory
- 1164
- Price-to-rent
- 8.0×
Monthly cashflow live
- Estimated rent
- $3,438 high interval (Pro) →
- Mortgage (P&I)
- −$1,725
- Tax from tax record
- −$508 /mo · $6,099/yr
- Insurance
- −$137
- HOA
- −$389
- Vacancy / Maint / Mgmt
- −$722
- Net cashflow
- $-43
Break-even live
Sensitivity live
| Price | -10% $143 | -5% $50 | +0% $-43 | +5% $-137 | +10% $-230 |
|---|---|---|---|---|---|
| Rent | -10% $-315 | -5% $-179 | +0% $-43 | +5% $92 | +10% $228 |
| Rate | -1.0pp $122 | -0.5pp $40 | base $-43 | +0.5pp $-129 | +1.0pp $-215 |
UW: 25.0% down · 7.5% · 30yr · 1.5% tax · 5.0% vac · 8.0% maint · 8.0% mgmt
Financing live
Cash to close
- Down payment
- $82,250
- Closing costs
- $9,870
- Reserves months
- —
- Total cash needed
- —
Loan-product check · same deal, 3 products live
Conventional
25% down · 7.5% · 30yr
- Down + closing
- —
- Monthly P&I
- —
- Monthly cashflow
- —
- DSCR
- —
- Eligible?
- —
Personal DTI + credit; lowest rate.
DSCR
20% down · 8.5% · 30yr
- Down + closing
- —
- Monthly P&I
- —
- Monthly cashflow
- —
- DSCR
- —
- Eligible?
- —
No personal income docs; deal must DSCR.
Hard money
10% down · 12.0% · 12mo
- Down + closing
- —
- Monthly P&I
- —
- Monthly cashflow
- —
- DSCR
- —
- Eligible?
- —
Short-term bridge; refi at stabilization.
Rent comps 40 comps
| Address | Beds | Baths | Sqft | Rent | $/sqft | DOM | Units | Dist |
|---|---|---|---|---|---|---|---|---|
| 15035 Sunny Day Dr Bradenton, FL | 3.0 | 2.5 | 1880 | $2,950 | $1.57 | 25d | 1 | 0.04mi |
| 15126 Sunny Day Dr Bradenton, FL | 3.0 | 3.0 | 1879 | $2,700 | $1.44 | 25d | 1 | 0.04mi |
| 14753 Lyla Ter Bradenton, FL | 3.0 | 2.5 | 1879 | $2,600 | $1.38 | 12d | 1 | 0.07mi |
| 14775 Lyla Ter Bradenton, FL | 3.0 | 2.5 | 1879 | $2,600 | $1.38 | 21d | 1 | 0.07mi |
| 14736 Lyla Ter Bradenton, FL | 3.0 | 2.5 | 1700 | $3,000 | $1.76 | 17d | 1 | 0.09mi |
| 14776 Lyla Ter Bradenton, FL | 3.0 | 2.5 | 1879 | $4,500 | $2.39 | 25d | 1 | 0.10mi |
| 15228 Lyla Ter Bradenton, FL | 3.0 | 2.5 | 1925 | $3,000 | $1.56 | 25d | 1 | 0.15mi |
| 15161 Serene Shores Loop Bradenton, FL | 3.0 | 3.0 | 1840 | $3,800 | $2.07 | 25d | 1 | 0.20mi |
| 15018 Oxford Grey Dr Bradenton, FL | 4.0 | 3.0 | 2032 | $5,500 | $2.71 | 25d | 1 | 0.20mi |
| 5510 Tidal Breeze Cv Unit 5510 Bradenton, FL | 2.0 | 2.0 | 1414 | $3,495 | $2.47 | 25d | 1 | 0.23mi |
| 5537 Tidal Breeze Cv Bradenton, FL | 3.0 | 2.0 | 1564 | $2,700 | $1.73 | 25d | 1 | 0.30mi |
| 15721 Sunny Day Dr Bradenton, FL | 2.0 | 2.0 | 1580 | $6,500 | $4.11 | 25d | 1 | 0.39mi |
| 5210 Coral Reef Way Bradenton, FL | 3.0 | 3.0 | 2202 | $3,975 | $1.81 | 25d | 1 | 0.39mi |
| 5225 Blue Crush St Bradenton, FL | 3.0 | 3.0 | 1849 | $5,000 | $2.70 | 25d | 1 | 0.42mi |
| 5316 Crystal Harbor Cv Bradenton, FL | 3.0 | 2.0 | 1564 | $2,700 | $1.73 | 23d | 1 | 0.43mi |
| 5316 Crystal Harbor Cv Bradenton, FL | 2.0 | 2.0 | 1564 | $2,700 | $1.73 | 25d | 1 | 0.43mi |
| 5161 Coral Reef Way Bradenton, FL | 3.0 | 3.0 | 2202 | $4,000 | $1.82 | 25d | 1 | 0.44mi |
| 15716 Barefoot Beach Dr Bradenton, FL | 3.0 | 3.0 | 2027 | $7,500 | $3.70 | 25d | 1 | 0.45mi |
| 15021 Sea Salt Way Bradenton, FL | 3.0 | 3.0 | 2444 | $8,500 | $3.48 | 25d | 1 | 0.46mi |
| 5307 Crystal Harbor Cv Bradenton, FL | 2.0 | 2.0 | 1557 | $3,000 | $1.93 | 25d | 1 | 0.47mi |
| 5319 White Sand Cv Bradenton, FL | 3.0 | 2.0 | 1417 | $2,850 | $2.01 | 25d | 1 | 0.57mi |
| 16020 Sunny Day Dr Unit 1 Bradenton, FL | 3.0 | 2.0 | 1414 | $3,500 | $2.48 | 25d | 1 | 0.58mi |
| 15934 Clear Skies Pl Bradenton, FL | 3.0 | 2.0 | 1414 | $2,900 | $2.05 | 25d | 1 | 0.62mi |
| 15950 Clear Skies Pl Bradenton, FL | 3.0 | 2.0 | 1414 | $4,500 | $3.18 | 25d | 1 | 0.67mi |
| 15167 Sea Salt Way Bradenton, FL | 3.0 | 3.0 | 2444 | $5,500 | $2.25 | 25d | 1 | 0.68mi |
| 15957 Clear Skies Pl Bradenton, FL | 2.0 | 2.0 | 1557 | $2,750 | $1.77 | 25d | 1 | 0.69mi |
| 14484 59th Cir E Bradenton, FL | 4.0 | 3.0 | 2340 | $3,300 | $1.41 | 25d | 1 | 0.71mi |
| 5818 143rd Ct E Bradenton, FL | 4.0 | 2.0 | 2006 | $2,795 | $1.39 | 13d | 1 | 0.72mi |
| 15982 Clear Skies Pl Bradenton, FL | 2.0 | 2.0 | 1564 | $4,600 | $2.94 | 5d | 1 | 0.72mi |
| 13737 Messina Loop Bradenton, FL | 2.0 | 2.0 | 1528 | $4,750 | $3.11 | 25d | 2 | 0.76mi |
| 13732 Messina Loop #201 Bradenton, FL | 2.0 | 2.0 | 1528 | $2,775 | $1.82 | 17d | 1 | 0.79mi |
| 4755 Motta Ct Bradenton, FL | 2.0 | 2.0 | 1678 | $4,200 | $2.50 | 17d | 1 | 0.80mi |
| 5819 Oak Bridge Ct Bradenton, FL | 4.0 | 2.0 | 2034 | $2,850 | $1.40 | 16d | 1 | 0.80mi |
| 14339 59th Cir E Bradenton, FL | 4.0 | 3.0 | 2340 | $2,900 | $1.24 | 25d | 1 | 0.81mi |
| 13725 Messina Loop #201 Bradenton, FL | 2.0 | 2.0 | 1528 | $2,900 | $1.90 | 25d | 1 | 0.83mi |
| 15835 Tradewind Ter Bradenton, FL | 4.0 | 2.5 | 2356 | $9,850 | $4.18 | 25d | 1 | 0.85mi |
| 14367 59th Cir E Bradenton, FL | 4.0 | 2.0 | 2006 | $2,850 | $1.42 | 25d | 1 | 0.85mi |
| 13823 Messina Loop Bradenton, FL | 2.0 | 2.0 | 1528 | $2,950 | $1.93 | 25d | 2 | 0.85mi |
| 15019 Skip Jack Loop Lakewood Ranch, FL | 4.0 | 2.5 | 2012 | $2,600 | $1.29 | 25d | 1 | 0.86mi |
| 15019 Skip Jack Loop Lakewood Ranch, FL | 4.0 | 2.5 | 2012 | $2,600 | $1.29 | 23d | 1 | 0.86mi |
HOA detail
- Monthly dues
- $389 · $4,668/yr
- Likely covers
- water
Listing history 23 events
-
2026-06-08statusdays on market $329,000 Pending 65 DOM
-
2026-06-03days on market $329,000 Active 62 DOM
-
2026-06-02days on market $329,000 Active 61 DOM
-
2026-06-01days on market $329,000 Active 60 DOM
-
2026-05-31days on market $329,000 Active 59 DOM
-
2026-04-02$330,000 Active
-
2026-03-14historical $3,000
-
2026-02-13$3,000
-
2026-01-31historical $3,000
-
2025-12-30$3,000
-
2025-12-10historical $3,000
-
2025-11-09$3,000
-
2024-12-07historical $2,950
-
2024-11-07$2,950
-
2024-04-23historical $3,100
-
2024-04-11$3,100
-
2024-04-10historical $3,100
-
2024-03-13$3,100
-
2024-03-13historical $3,100
-
2024-03-02price $3,100
-
2024-02-18$3,250
-
2023-05-18historical
-
2021-11-23soldstatus $26,078,286
ⓘ Source: listings_history table (triggers on properties + properties_extension) + one-shot
backfill from property_details.listing_events for pre-trigger history.
Tax reassessment forecast FL · Resets to sale price
- Current annual tax
- $6,099 · $508/mo
- Projected year-2 tax
- $6,099 · $508/mo
- Expected delta
- $0/yr ($0/mo · 0.0%)
ⓘ Screening estimate from a state-policy table — verify with the county assessor before closing.
Climate risk First Street
- Flood 1/10 Low FEMA zone X (unshaded) · 0% chance over 30 yrs
- Wildfire 4/10 Moderate
- Heat 10/10 Extreme 7 d/yr ≥109°F today · 28 d/yr by 30 yrs out
- Wind 10/10 Extreme 99% chance of damaging wind over 30 yrs
- Air quality 3/10 Moderate 2 unhealthy d/yr today · 2 by 30 yrs out
Nearby sold comps map
Loading sold comps map…
Walkable amenities ~0.75 mi
Loading nearby amenities…
Taxation est. · year 1
- Rental income
- $41,258
- − Mortgage interest
- −$18,429
- − Property taxes
- −$6,099
- − Insurance
- −$1,645
- − Repairs & maintenance
- −$3,301
- − Management
- −$3,301
- − HOA
- −$4,668
- − Depreciation
- −$9,571
- Taxable loss
- −$5,755
- Est. tax savings @ 24.0%
- +$1,381
- After-tax cash flow
- $860/yr
For passive investors: Depreciation is non-cash, so a rental often shows a tax loss while cash-flowing — sheltering income. Rental losses are passive: they offset passive income freely, and up to $25,000/yr can offset ordinary (W-2) income if you actively participate and your MAGI is under $100k (phasing out to $0 by $150k); unused losses carry forward. On sale, claimed depreciation is recaptured at up to 25%, and gains may owe capital-gains tax (a 1031 exchange can defer both). Figures are a year-1 estimate at your 24.0% rate — not tax advice; consult a CPA.
Condition & rehab AI · 12 photos
This well-maintained townhouse in Lakewood Ranch offers a serene water view and a modern open-concept floor plan, making it an attractive option for both buyers and renters.
Value-add opportunities
- Both Painting the exterior and interior walls — Fresh paint can enhance curb appeal and interior aesthetics.
- Both Landscaping improvements — Enhanced landscaping can improve curb appeal and attract more potential buyers/tenants.
- Rental HVAC maintenance — A clean and efficient HVAC system is crucial for tenant satisfaction and energy efficiency.
- Resale Kitchen appliances maintenance — Modern appliances can attract more buyers and add value to the home.
Renovation cost estimate screening
Value-add ROI direction
- Both Painting the exterior and interior walls — Fresh paint can enhance curb appeal and interior aesthetics. ↑
- Both Landscaping improvements — Enhanced landscaping can improve curb appeal and attract more potential buyers/tenants. ↑
- Rental HVAC maintenance — A clean and efficient HVAC system is crucial for tenant satisfaction and energy efficiency. ↑
- Resale Kitchen appliances maintenance — Modern appliances can attract more buyers and add value to the home. ↑
ⓘ Cost ranges are severity-bucket heuristics (US national rule-of-thumb). Get contractor quotes + a written scope before underwriting a rehab budget.
Schools (NCES district)
- District
- Manatee
- NCES district ID
- 1201230
- Math proficiency
- 54% ▼ -6.00%
- Reading proficiency
- 50% ▼ -2.00%
- Median HH income
- $49,607
- Composite
- 44.43/100
- National rank
- #2806
- State rank
- #26 of 73 in FL
Livability — Lakewood Ranch
No livability data for this city. (Only ~50 U.S. cities are tracked.)
Census & demographics
- Census place
- Lakewood Ranch, FL
- County
- Manatee County · 416,364 people
- City population
- 52,177
- Metro
- North Port-Sarasota-Bradenton, FL
- Population (ZIP)
- 24,980
- Household income
- $119,911
- Rent vs Own
- Severe rent burden
- 815.0
Population outlook (Manatee County) Hauer SSP2
- Today (2025)
- 447,342 people
- By 2030
- 488,911 · +9.3%
- By 2040
- 567,934 · +27.0%
- By 2050
- 637,995 · +42.6%
- By 2075
- 781,970 · +74.8%
- By 2100
- 848,272 · +89.6%
Race, ethnicity, and origin ACS 2023
- Neighborhood character
- Predominantly White (81%)
- Race & ethnicity
- White 81% Hispanic / Latino 11% Two or more races 10% Asian 3% Black 2% Native American 2%
- Hispanic origin (detail)
- Mexican 2% Puerto Rican 3% Cuban 3%
- Common ancestry
- Lithuanian 5% Romanian 3% Scotch-Irish 2%
- Foreign-born
- 16% · Canada, Jamaica, China
- Languages at home
- 81% English-only · Spanish 10% Other Indo-European 3% Russian/Polish/Slavic 2%
Political lean MEDSL · Manatee
- 2024 margin
- Strong R (+23.5) · D 37.9% · R 61.4%
- 2008→2024 swing
- -16.5pp toward R · 2008: -7.0pp · 2024: -23.5pp
- All cycles
- 2024: R+23.5 2020: R+16.1 2016: R+17.1 2012: R+12.5 2008: R+7.0
Not yet ingested
- Civics
- —
Market trends
- HPI YoY
- ▼ -100.84%
- Current HPI
- 265.946
- Rent YoY
- ▼ -5.17%
- Metro
- North Port-Sarasota-Bradenton, FL
- State GDP YoY
- ▲ 3.28%
- F500 in state
- 36
Industry mix (Fortune 500 HQ in FL)
| Industry | F500 HQs | Revenue |
|---|---|---|
| Industrial Technology | 2 | $29B |
|
||
| Insurance | 2 | $17B |
|
||
| Retail | 1 | $60B |
|
||
| Technology Distribution | 1 | $58B |
|
||
| Homebuilding | 1 | $35B |
|
||
| Technology Manufacturing | 1 | $35B |
|
||
Price history
-98.7% since first listed18 events — show timeline
- 2026-04-02 Listed $330,000 Stellar MLS as Distributed by MLS Grid
- 2026-03-14 Rental Removed $3,000 TURBOTENANT
- 2026-02-13 Listed for Rent $3,000 TURBOTENANT
- 2026-01-31 Rental Removed $3,000 TURBOTENANT
- 2025-12-30 Listed for Rent $3,000 TURBOTENANT
- 2025-12-10 Rental Removed $3,000 TURBOTENANT
- 2025-11-09 Listed for Rent $3,000 TURBOTENANT
- 2024-12-07 Rental Removed $2,950 TURBOTENANT
- 2024-11-07 Listed for Rent $2,950 TURBOTENANT
- 2024-04-23 Rental Removed $3,100 TURBOTENANT
- 2024-04-11 Listed for Rent $3,100 TURBOTENANT
- 2024-04-10 Rental Removed $3,100 APPFOLIO
- 2024-03-13 Listed for Rent $3,100 APPFOLIO
- 2024-03-13 Rental Removed $3,100 TURBOTENANT
- 2024-03-02 Price Changed $3,100 TURBOTENANT
- 2024-02-18 Listed for Rent $3,250 TURBOTENANT
- 2023-05-18 Rental Removed — RENT.
- 2021-11-23 Sold (Public Records) $26,078,286 Public Records
Property tax history
+47.9%/yrLatest (2025): $6,099 · +4.1% YoY. Source: county tax records.
Cash-flow waterfall
monthlySold comps — $/sqft
last 12 mo · ≤1 miLoading sold comps…