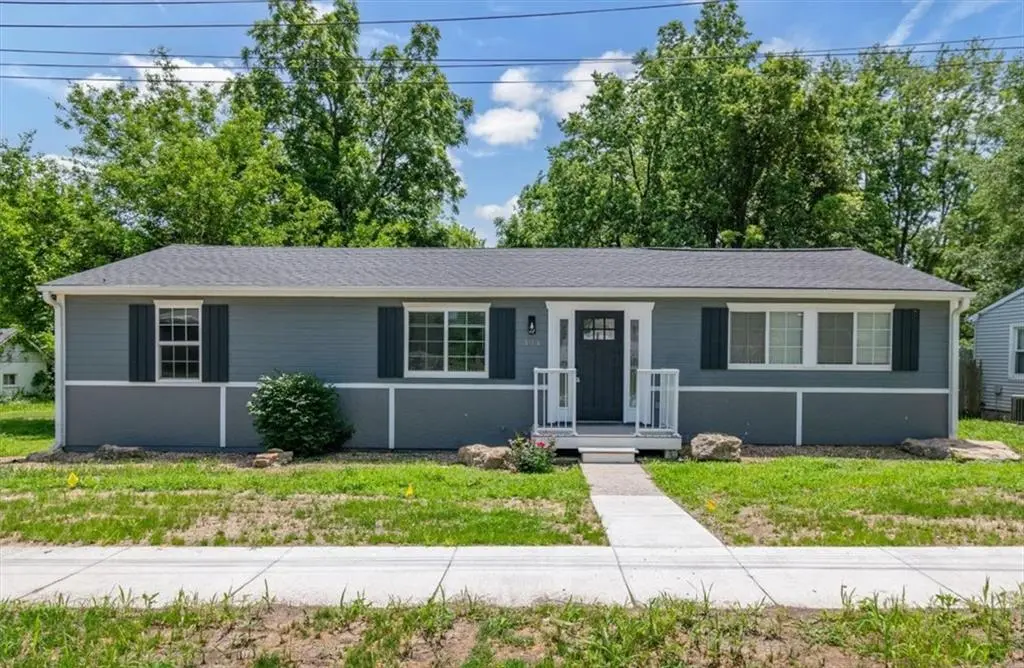
303 W Front St · Grain Valley, MO
Flood risk 1/10 · Minimal
- FEMA flood zone
- X (unshaded)
- Chance of flooding over 30 yrs
- 0.0%
- Est. flood insurance / yr
- $507 – $1,088
Fire risk 2/10 · Minimal
- Est. fire insurance / yr
- $1,054 – $1,958
Heat risk 4/10 · Minor
- Hot days now (above 107°F)
- 7 days/yr
- Hot days in 30 yrs
- 16 days/yr
Wind risk 2/10 · Minimal
- Chance of severe wind over 30 yrs
- —
Air-quality risk 3/10 · Minor
- Unhealthy air days now
- 3 days/yr
- Unhealthy air days in 30 yrs
- 4 days/yr
Risk factors via First Street. Map © Google.
Why this score? — see what drove the D+ grade
The composite is a weighted blend of 9 inputs, each scored 0–100. Each bar is that input's sub-score; the figure is the points it added to the 100-point composite (weight × sub-score).
- ARV discount +13.8/15.0
- Cash flow +12.9/30.0
- Schools +4.4/10.0
- Rent growth +4.3/5.0
- DSCR +3.9/10.0
- Livability +3.8/5.0
- 1% rule +3.1/10.0
- Condition / age +2.5/5.0
- Appreciation +0.0/10.0
$219,900
🖨 Deal sheet (PDF) 📄 Offer letter ✓ Due diligence
Listing remarks
* * Open house Saturday June 6th from 11am-1pm * * Welcome home to this beautifully updated property in the heart of Grain Valley! Featuring a fully renovated kitchen with granite countertops, a large center island, and NEW stainless steel appliances, this open concept home is move-in ready. The updated bathroom adds modern style and convenience. Situated on a huge lot that includes an additional half lot, you'll enjoy plenty of space for extra parking, entertaining, or future possibilities. Relax on the private deck overlooking the expansive backyard that backs to green space for added privacy. Located just steps from downtown Main Street, you'll love the charm, convenience, and small-
Key facts
- 9,583 sq ft lot
- Built 1950
- Listed 6 days
Property features AI
Finance
- Other: Above-grade finished area reported as 1,272 (source: public records); Lot size about 0.22 acres
Exterior
- Parking: Off-street parking; Other parking
- Utilities: Public water; Public sewer
- Home design: Single-family residence; Ranch floor plan; Inside city limits
- Construction: Concrete and vinyl siding exterior; Composition roof; Crawl space foundation; Built approximately 51–75 years ago
- Exterior features: Deck; Shed(s)
Interior
- Kitchen: Granite counters; Kitchen island; Built-in features; Dishwasher; Disposal; Microwave; Refrigerator; Electric range; Stainless steel appliances
- Bedrooms: 3 bedrooms — all on the main level; Walk-in closet in one bedroom
- Flooring: Luxury vinyl; Tile
- Bathrooms: 1 full bathroom with shower-over-tub
- Heating & cooling: Forced air heating; Electric cooling
- Interior features: Kitchen island; Painted cabinets; Eat-in kitchen
- Laundry & utility: Main-level laundry
Neighborhood map
What this means for you Summary
Snapshot
- This is a 3-bed/1.5-bath single-family listed at $220k.
Deal economics
- At list price, monthly cash flow is $-16 ($-189/yr) — negative.
- To cash-flow at today's rent, offer at most $217k (1.3% below list).
- To meet the 1% rule (rent ≥ 1% of price), the offer needs to be $178k (18.9% below list).
- Recommended offer: $178k (18.9% below list) — sets the bar for 1% rule.
- Cap rate 6.2% vs local median 3.6% in Grain Valley — top-decile yield for the area; either an underpriced asset or a hidden risk that comps aren't pricing in. Stress-test before assuming the spread holds.
Location & tenants
- Location reads 76/100 on livability (#41 in MO, #3,383 nationally) — a middle-class / working-renter tenant base. Strengths: employment A+, cost of living A+, housing A+; Watch: amenities F, commute F.
- Grain Valley R-V (suburban): math 45% / reading 54% proficiency, ranked #30 of 324 in MO (top 9%) — families likely to look elsewhere, expect single-tenant / working-renter base with shorter leases; only 17% free/reduced lunch — higher-income household profile.
- Zoned schools: Grain Valley Early Childhd Ctr (89 students, 3% FRL); Grain Valley South Middle Schl (math 47% / reading 45%, grade D+, #102 of 391 statewide, top 26%, 568 students, 31% FRL); Grain Valley High (math 25% / reading 68%, grade D-, #169 of 521 statewide, top 32%, 1,438 students, 22% FRL) — zoned schools at 19% FRL track the district average.
- Market conditions: Rents rising fast (+7.0%/yr); 111 active listings in the ZIP; 17 comparable units currently listed for rent nearby; rentals at typical pace (median 23d on market — plan ~3-4 weeks tenant-placement turnaround); solid renter incomes; 4,002 units permitted in Jackson County in 2024 (2,271 in 5+ unit buildings).
Forward outlook
- Local home prices are declining (-3.0%/yr); year-one equity from $2k of loan paydown is wiped out by about $7k of value loss. Plan a longer hold.
- Jackson County population projected at +4% by 2050 — modest demand growth; plan on rents tracking national, not racing it.
Negotiation context
- Only 6 days on market — expect competitive offers; lowballing is unlikely to land.
- 5 sale attempts since 11y ago; this cycle's ask is 16% above the opening price — seller raised mid-cycle; expect resistance to lowballs.
Risks & watch-outs
- Watch-outs: built in 1950 — expect roof / HVAC / electrical / plumbing capex.
Questions for the listing agent
- What do current leases actually rent for vs. the listed asking? Can we see a recent rent roll and the last 12 months of T-12 income?
- Built in 1950 — when were the roof, HVAC, electrical panel, plumbing, and water heater last replaced?
- Is there a deadline driving the sale (1031 exchange, divorce, estate, relocation)? That informs how much negotiation room exists.
- The area grade is low — what's the realistic commute time and amenity access for the typical tenant pool here? Any planned neighborhood developments (good or bad) we should know about?
- What's the average days-on-market for RENTAL listings here right now (not sales)? A rising rental-DOM trend means longer vacancies and softer asking-rent achievability than the comps imply.
- What's the recent tenant-quality profile in this submarket — average credit score on applications, eviction rate, late-payment / NSF rate, and stable-employment percentage? A property-management company in the area should have these aggregated.
- How much new for-sale + rental construction is in the pipeline within 1–3 miles? Heavy new supply typically softens prices + rents 12–24 months out; constrained supply supports both.
Investment metrics
- 1% rule
- 0.81% ✗
- Cap rate
- 6.21%
- Cash-on-cash
- -0.31%
- DSCR
- 0.99
- GRM
- 10.3
CMA / ARV
- ARV (on-the-fly)
- $255,672
- Comps found
- 12
Show comp detail 12 sales within ~0.75 mi
| Address | Dist | Beds/Ba | Sqft | Sold | Price | $/sf | Match |
|---|---|---|---|---|---|---|---|
| 202 E Kirby Rd | 0.44mi | 3/2.0 | 1,271 (-0%) | 1mo | $255,000 | $201 | 76 |
| 518 South St | 0.40mi | 3/2.0 | 1,283 (+1%) | 7mo | $270,000 | $210 | 72 |
| 204 Young St | 0.18mi | 3/2.0 | 1,414 (+11%) | 4mo | $255,000 | $180 | 68 |
| 616 NE Pearls Pl | 0.23mi | 3/2.0 | 1,456 (+14%) | 3mo | $250,000 | $172 | 61 |
| 206 E Kirby Rd | 0.43mi | 3/2.0 | 1,344 (+6%) | 10mo | $245,000 | $182 | 60 |
| 621 Charlotte St | 0.24mi | 2/1.0 (-1) | 1,152 (-9%) | 8mo | $199,900 | $174 | 60 |
| 503 Broadway St | 0.29mi | 3/2.5 | 1,448 (+14%) | 0mo | $275,000 | $190 | 59 |
| 516 South St | 0.38mi | 3/2.0 | 1,400 (+10%) | 10mo | $250,000 | $179 | 55 |
| 706 NW Green Dr | 0.71mi | 3/2.0 | 1,448 (+14%) | 4mo | $335,900 | $232 | 38 |
| 707 NW Green Dr | 0.69mi | 3/3.0 | 1,402 (+10%) | 10mo | $300,000 | $214 | 36 |
| 205 SW Cross Creek Dr | 0.74mi | 4/2.0 (+1) | 1,425 (+12%) | 9mo | $299,900 | $210 | 31 |
| 207 Pebblebrook St | 0.69mi | 4/2.0 (+1) | 1,461 (+15%) | 7mo | $296,900 | $203 | 30 |
Match score weights: distance 35% · size 25% · config 20% · recency 20%. Top-matched comps best support the ARV.
Projected returns pro-forma
-3.0% appreciation · 7.03% rent growth · sell at horizon
- IRR
- -12.7%
- Equity multiple
- 0.53×
- Total profit
- $-29,150
- Equity at exit
- $32,788
- IRR
- 1.3%
- Equity multiple
- 1.11×
- Total profit
- $6,729
- Equity at exit
- $19,013
Cash invested: $61,572 (down + closing). Projections, not guarantees.
Landlord ↔ Tenant lean methodology
- Overall (STATE)
- 81 Strongly Landlord-Friendly
- State Missouri
- 81 Strongly Landlord-Friendly · R+10
- County
- — inherits STATE
- City
- — inherits STATE
ZIP-level market 64029
- Home prices YoY
- -24.2%
- Rents YoY
- 7.0%
- Active inventory
- 111
- Price-to-rent
- 10.3×
Monthly cashflow live
- Estimated rent
- $1,782 high interval (Pro) →
- Mortgage (P&I)
- −$1,153
- Tax from tax record
- −$179 /mo · $2,150/yr
- Insurance
- −$92
- HOA
- −$0
- Vacancy / Maint / Mgmt
- −$374
- Net cashflow
- $-16
Break-even live
Sensitivity live
| Price | -10% $109 | -5% $46 | +0% $-16 | +5% $-78 | +10% $-140 |
|---|---|---|---|---|---|
| Rent | -10% $-157 | -5% $-86 | +0% $-16 | +5% $55 | +10% $125 |
| Rate | -1.0pp $95 | -0.5pp $40 | base $-16 | +0.5pp $-73 | +1.0pp $-131 |
UW: 25.0% down · 7.5% · 30yr · 1.5% tax · 5.0% vac · 8.0% maint · 8.0% mgmt
Financing live
Cash to close
- Down payment
- $54,975
- Closing costs
- $6,597
- Reserves months
- —
- Total cash needed
- —
Loan-product check · same deal, 3 products live
Conventional
25% down · 7.5% · 30yr
- Down + closing
- —
- Monthly P&I
- —
- Monthly cashflow
- —
- DSCR
- —
- Eligible?
- —
Personal DTI + credit; lowest rate.
DSCR
20% down · 8.5% · 30yr
- Down + closing
- —
- Monthly P&I
- —
- Monthly cashflow
- —
- DSCR
- —
- Eligible?
- —
No personal income docs; deal must DSCR.
Hard money
10% down · 12.0% · 12mo
- Down + closing
- —
- Monthly P&I
- —
- Monthly cashflow
- —
- DSCR
- —
- Eligible?
- —
Short-term bridge; refi at stabilization.
Rent comps 17 comps
| Address | Beds | Baths | Sqft | Rent | $/sqft | DOM | Units | Dist |
|---|---|---|---|---|---|---|---|---|
| 630 Yennie St Grain Valley, MO | 1.0–3.0 | 1.0–2.0 | 1050 | $1,819 | $1.73 | 3d | 15 | 0.34mi |
| 1282 NW Phelps Ct Unit 1282 Grain Valley, MO | 3.0 | 2.5 | 1288 | $1,550 | $1.20 | 14d | 1 | 0.69mi |
| 200 NW Parker Dr Grain Valley, MO | 2.0 | 1.0 | 960 | $1,205 | $1.26 | 45d | 1 | 0.70mi |
| 1015 NW Willow Dr Grain Valley, MO | 3.0 | 2.0 | 1590 | $1,395 | $0.88 | 45d | 1 | 0.74mi |
| 316 NE Coldwater Creek Dr Grain Valley, MO | 3.0 | 2.5 | 1352 | $1,516 | $1.12 | 45d | 1 | 0.74mi |
| 209 NW Woodbury Dr Grain Valley, MO | 2.0 | 1.5 | 1025 | $1,350 | $1.32 | 18d | 1 | 0.76mi |
| 930 NW Scenic Dr Grain Valley, MO | 3.0 | 2.0 | 1750 | $2,100 | $1.20 | 25d | 1 | 0.77mi |
| 1108 NW Golfview Dr Grain Valley, MO | 3.0 | 1.5 | 1364 | $1,890 | $1.39 | 9d | 1 | 0.81mi |
| 1120 NW Willow Dr Grain Valley, MO | 2.0 | 2.0 | 900 | $1,395 | $1.55 | 16d | 1 | 0.90mi |
| 1402 NE Mary Ct Grain Valley, MO | 3.0 | 2.5 | 1316 | $1,595 | $1.21 | 9d | 1 | 1.05mi |
| 1220 NW Sni-A-Bar Blvd Grain Valley, MO | 1.0–3.0 | 1.0–2.5 | 1170 | $1,900 | $1.62 | 3d | 1 | 1.09mi |
| 207 NW Sni a Bar Pkwy Grain Valley, MO | 3.0 | 2.0 | 930 | $1,450 | $1.56 | 25d | 1 | 1.11mi |
| 1500 NE Shale Ct Grain Valley, MO | 3.0 | 2.5 | 1427 | $1,845 | $1.29 | 19d | 1 | 1.14mi |
| 1312 Valley Woods Ct Unit D Grain Valley, MO | 2.0 | 1.0 | 1080 | $1,125 | $1.04 | 45d | 1 | 1.15mi |
| 1519 NE Erin Ct Grain Valley, MO | 3.0 | 2.5 | 1450 | $1,695 | $1.17 | 23d | 1 | 1.21mi |
| 317 SW Blue Branch Dr Unit 317 Grain Valley, MO | 2.0 | 1.0 | 1004 | $1,400 | $1.39 | 45d | 1 | 1.39mi |
| 902 SW Foxtail Dr Grain Valley, MO | 3.0 | 2.0 | 1570 | $2,450 | $1.56 | 45d | 1 | 1.43mi |
Listing history 6 events
-
2026-06-13statusdays on market $219,900 Pending 6 DOM
-
2026-06-09days on market $219,900 Active 5 DOM
-
2026-06-08days on market $219,900 Active 4 DOM
-
2026-06-07statusdays on market $219,900 Active 3 DOM
-
2026-06-05remarks 699-char remark
-
2026-06-05$219,900 Coming Soon 1 DOM
ⓘ Source: listings_history table (triggers on properties + properties_extension) + one-shot
backfill from property_details.listing_events for pre-trigger history.
Tax reassessment forecast MO · Resets to sale price
- Current annual tax
- $2,150 · $179/mo
- Projected year-2 tax
- $2,150 · $179/mo
- Expected delta
- $0/yr ($0/mo · 0.0%)
ⓘ Screening estimate from a state-policy table — verify with the county assessor before closing.
Climate risk First Street
- Flood 1/10 Low FEMA zone X (unshaded) · 0% chance over 30 yrs
- Wildfire 2/10 Low
- Heat 4/10 Moderate 7 d/yr ≥107°F today · 16 d/yr by 30 yrs out
- Wind 2/10 Low
- Air quality 3/10 Moderate 3 unhealthy d/yr today · 4 by 30 yrs out
Nearby sold comps map
Loading sold comps map…
Walkable amenities ~0.75 mi
Loading nearby amenities…
Taxation est. · year 1
- Rental income
- $21,390
- − Mortgage interest
- −$12,318
- − Property taxes
- −$2,150
- − Insurance
- −$1,100
- − Repairs & maintenance
- −$1,711
- − Management
- −$1,711
- − Depreciation
- −$6,397
- Taxable loss
- −$3,997
- Est. tax savings @ 24.0%
- +$959
- After-tax cash flow
- $770/yr
For passive investors: Depreciation is non-cash, so a rental often shows a tax loss while cash-flowing — sheltering income. Rental losses are passive: they offset passive income freely, and up to $25,000/yr can offset ordinary (W-2) income if you actively participate and your MAGI is under $100k (phasing out to $0 by $150k); unused losses carry forward. On sale, claimed depreciation is recaptured at up to 25%, and gains may owe capital-gains tax (a 1031 exchange can defer both). Figures are a year-1 estimate at your 24.0% rate — not tax advice; consult a CPA.
Schools (NCES district)
- District
- Grain Valley R-V
- NCES district ID
- 2913080
- Math proficiency
- 45% ▼ -4.00%
- Reading proficiency
- 54% ▼ -1.00%
- Median HH income
- $67,451
- Composite
- 44.01/100
- National rank
- #2888
- State rank
- #30 of 324 in MO
Livability — Grain Valley
- Score
- 76/100
- State rank
- #41
- US rank
- #3383
Category grades
Schools grade is shown separately in the Schools card above.
Census & demographics
- Census place
- Grain Valley, MO
- County
- Jackson County · 687,798 people
- City population
- 21,961
- Metro
- Kansas City, MO-KS
- Population (ZIP)
- 21,961
- Household income
- $91,704
- Rent vs Own
- Severe rent burden
- 218.0
Population outlook (Jackson County) Hauer SSP2
- Today (2025)
- 719,589 people
- By 2030
- 731,456 · +1.6%
- By 2040
- 746,689 · +3.8%
- By 2050
- 749,289 · +4.1%
- By 2075
- 736,227 · +2.3%
- By 2100
- 668,210 · -7.1%
Race, ethnicity, and origin ACS 2023
- Neighborhood character
- Predominantly White (86%)
- Race & ethnicity
- White 86% Two or more races 5% Hispanic / Latino 5% Black 5%
- Common ancestry
- Italian 17% Lithuanian 2% Slovak 2%
- Foreign-born
- 2% · Canada
- Languages at home
- 97% English-only · Spanish 2%
Political lean MEDSL · Jackson
- 2024 margin
- D (+19.3) · D 58.9% · R 39.5% · Other 1.6%
- 2008→2024 swing
- -6.1pp toward R · 2008: 25.4pp · 2024: 19.3pp
- All cycles
- 2024: D+19.3 2020: D+22.0 2016: D+16.6 2012: D+19.0 2008: D+25.4
Not yet ingested
- Civics
- —
Market trends
- HPI YoY
- ▼ -72.90%
- Current HPI
- 228.5568
- Rent YoY
- ▲ 7.03%
- Metro
- Kansas City, MO-KS
- State GDP YoY
- ▲ 1.84%
- F500 in state
- 20
Industry mix (Fortune 500 HQ in MO)
| Industry | F500 HQs | Revenue |
|---|---|---|
| Healthcare | 1 | $163B |
|
||
| Insurance | 1 | $21B |
|
||
| Industrial Technology | 1 | $17B |
|
||
| Retail | 1 | $16B |
|
||
| Industrial Distribution | 1 | $10B |
|
||
| Utilities | 1 | $9B |
|
||
Price history
+480.2% since first listed21 events — show timeline
- 2026-06-04 Coming Soon $219,900 Heartland MLS as Distributed by MLS Grid
- 2025-05-13 Listing Removed — Heartland MLS as Distributed by MLS Grid
- 2025-05-09 Price Changed $155,000 Heartland MLS as Distributed by MLS Grid
- 2025-05-04 Price Changed $172,000 Heartland MLS as Distributed by MLS Grid
- 2025-04-30 Price Changed $180,000 Heartland MLS as Distributed by MLS Grid
- 2025-04-23 Price Changed $182,000 Heartland MLS as Distributed by MLS Grid
- 2025-04-08 Listed $190,000 Heartland MLS as Distributed by MLS Grid
- 2024-08-08 Listing Removed — Heartland MLS as Distributed by MLS Grid
- 2024-06-30 Price Changed $220,000 Heartland MLS as Distributed by MLS Grid
- 2024-06-13 Price Changed $230,000 Heartland MLS as Distributed by MLS Grid
- 2024-04-12 Listed $250,000 Heartland MLS as Distributed by MLS Grid
- 2020-02-04 Sold (Public Records) — Public Records
- 2020-01-29 Sold (MLS) — Heartland MLS as Distributed by MLS Grid
- 2019-12-27 Pending — Heartland MLS as Distributed by MLS Grid
- 2019-12-24 Listed $128,900 Heartland MLS as Distributed by MLS Grid
- 2016-01-14 Sold (MLS) — Heartland MLS as Distributed by MLS Grid
- 2015-10-14 Listing Removed — Heartland MLS as Distributed by MLS Grid
- 2015-10-14 Listed $27,500 Heartland MLS as Distributed by MLS Grid
- 2015-08-19 Listed $37,900 Heartland MLS as Distributed by MLS Grid
- 1997-11-22 Sold (Public Records) — Public Records
- 1992-05-05 Sold (Public Records) — Public Records
Property tax history
+9.3%/yrLatest (2025): $2,150 · -8.1% YoY. Source: county tax records.
Cash-flow waterfall
monthlySold comps — $/sqft
last 12 mo · ≤1 miLoading sold comps…