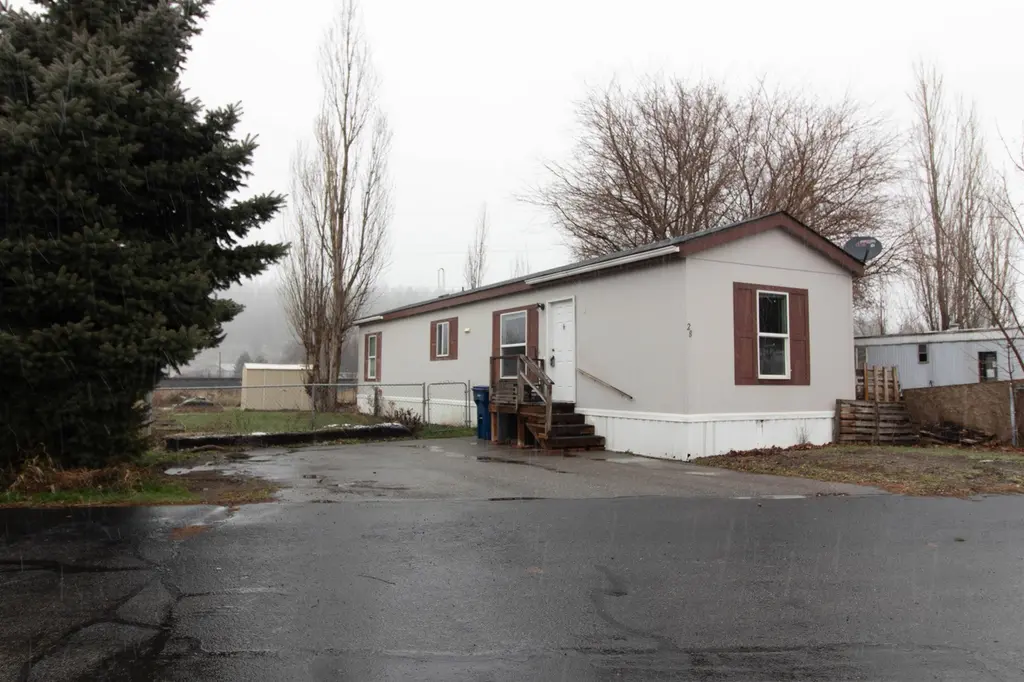
19625 E Wellesley #28 Ave #28 · Spokane Valley, WA
Flood risk 1/10 · Minimal
- FEMA flood zone
- X (unshaded)
- Chance of flooding over 30 yrs
- 0.0%
- Est. flood insurance / yr
- $507 – $1,088
Fire risk 7/10 · Major
- Est. fire insurance / yr
- $604 – $1,122
Heat risk 3/10 · Minor
- Hot days now (above 93°F)
- 7 days/yr
- Hot days in 30 yrs
- 15 days/yr
Wind risk 1/10 · Minimal
- Chance of severe wind over 30 yrs
- —
Air-quality risk 9/10 · Severe
- Unhealthy air days now
- 15 days/yr
- Unhealthy air days in 30 yrs
- 17 days/yr
Risk factors via First Street. Map © Google.
Why this score? — see what drove the B+ grade
The composite is a weighted blend of 9 inputs, each scored 0–100. Each bar is that input's sub-score; the figure is the points it added to the 100-point composite (weight × sub-score).
- Cash flow +30.0/30.0
- ARV discount +14.0/15.0
- 1% rule +10.0/10.0
- DSCR +10.0/10.0
- Schools +4.3/10.0
- Livability +4.2/5.0
- Rent growth +2.5/5.0
- Condition / age +2.5/5.0
- Appreciation +0.0/10.0
$65,000
🖨 Deal sheet 📄 Offer letter ✓ Due diligence
Listing remarks MLS
Don’t miss this beautifully updated 2015 mobile home located in the wonderful, well-desired Timberline community. This inviting 2-bedroom, 1-bath home features a large fenced yard—ideal for pets, entertaining, gardening, or enjoying your own private outdoor space. Inside, you’ll love the fresh updates, and modern kitchen that create a bright, functional feel. The brand new furnace adds peace of mind and energy efficiency. Move-in ready and thoughtfully improved, this home is a fantastic opportunity for comfortable, affordable living. Schedule your showing before it’s gone!
Key facts
- Updated mobile home
- Large fenced yard
- Modern kitchen
Tags
Neighborhood map
What this means for you Summary
Snapshot
- This is a 2-bed/1.0-bath manufactured listed at $65k.
Deal economics
- At list price, monthly cash flow is $939 ($11k/yr) — positive.
- The deal already cash-flows at list — no discount required.
- Meets the 1% rule at list price ($2k rent vs $65k).
- Recommended offer: $57k (12.0% below list) — sets the bar for market timing.
- Cap rate 23.6% vs local median 3.0% in Spokane Valley — top-decile yield for the area; either an underpriced asset or a hidden risk that comps aren't pricing in. Stress-test before assuming the spread holds.
Location & tenants
- Location reads 85/100 on livability (#31 in WA, #512 nationally) — a professional / high-income tenant draw. Strengths: amenities A+, commute A+, housing A+; Watch: crime D+.
- East Valley School District (Spokane) (urban): math 40% / reading 56% proficiency, ranked #160 of 291 in WA (top 55%) — families likely to look elsewhere, expect single-tenant / working-renter base with shorter leases.
- Market conditions: 57 active listings in the ZIP; 3,608 units permitted in Spokane County in 2024 (1,792 in 5+ unit buildings).
Forward outlook
- Local home prices are declining (-3.0%/yr); year-one equity from $449 of loan paydown is wiped out by about $2k of value loss. Plan a longer hold.
- Spokane County population projected at +13% by 2050 — modest demand growth; plan on rents tracking national, not racing it.
- At projected returns (-3.0% appreciation + 3.0% rent growth), your $18k cash investment doubles in ~2 years — after that, you're playing with house money.
Negotiation context
- It's been on market 157 days — a 12% lower offer ($57k) is reasonable based on typical stale-listing flexibility.
- 6 sale attempts since 21y ago; this cycle's ask has dropped $10k (13%) from the opening price — seller is motivated, your offer sets the floor, not the list.
Risks & watch-outs
- Climate carrying-cost: major wildfire risk — expect insurance premiums to compound above CPI over the hold.
Questions for the listing agent
- It's been on market 157 days. Have you received any prior offers? Is the seller open to a 12% concession, seller financing, or rate buy-down credit?
- Why hasn't it sold? Are there any deal-killer items the seller is aware of (foundation, flood, title, zoning, code violations)?
- Is there a deadline driving the sale (1031 exchange, divorce, estate, relocation)? That informs how much negotiation room exists.
- Schools are B-rated — typically a magnet for longer-tenancy family renters. What's the average tenant stay here, and is there a school-zone premium baked into asking?
- Crime grade is D in this area — have there been break-ins, vandalism, or insurance claims at this property in the last 3 years? What carrier currently insures it and at what premium?
- What's the average days-on-market for RENTAL listings here right now (not sales)? A rising rental-DOM trend means longer vacancies and softer asking-rent achievability than the comps imply.
- What's the recent tenant-quality profile in this submarket — average credit score on applications, eviction rate, late-payment / NSF rate, and stable-employment percentage? A property-management company in the area should have these aggregated.
- How much new for-sale + rental construction is in the pipeline within 1–3 miles? Heavy new supply typically softens prices + rents 12–24 months out; constrained supply supports both.
Investment metrics
- 1% rule
- 2.64% ✓
- Cap rate
- 23.63%
- Cash-on-cash
- 61.93%
- DSCR
- 3.76
- GRM
- 3.2
CMA / ARV
- ARV (median comp)
- $76,000
- List price
- $65,000
- Delta
- -14.47%
- Verdict
- UNDERPRICED
- Comps
- 7 within 1.0 mi
Show comp detail 1 sale within ~0.75 mi
| Address | Dist | Beds/Ba | Sqft | Sold | Price | $/sf | Match |
|---|---|---|---|---|---|---|---|
| 19625 E Wellesley Ave Spc 59 | 0.07mi | 2/1.0 | 756 (+4%) | 3mo | $76,000 | $101 | 88 |
Match score weights: distance 35% · size 25% · config 20% · recency 20%. Top-matched comps best support the ARV.
Projected returns pro-forma
-3.0% appreciation · 3.0% rent growth · sell at horizon
- IRR
- 60.8%
- Equity multiple
- 3.71×
- Total profit
- $49,300
- Equity at exit
- $9,692
- IRR
- 65.5%
- Equity multiple
- 7.59×
- Total profit
- $119,991
- Equity at exit
- $5,620
Cash invested: $18,200 (down + closing). Projections, not guarantees.
Landlord ↔ Tenant lean methodology
- Overall (STATE)
- 28 Tenant-Leaning
- State Washington
- 28 Tenant-Leaning · D+8
- County
- — inherits STATE
- City
- — inherits STATE
ZIP-level market 99027
- Home prices YoY
- -20.5%
- Active inventory
- 57
- Price-to-rent
- 3.2×
Monthly cashflow live
- Estimated rent
- $1,716 medium interval (Pro) →
- Mortgage (P&I)
- −$341
- Tax from tax record
- −$49 /mo · $582/yr
- Insurance
- −$27
- HOA
- −$0
- Vacancy / Maint / Mgmt
- −$360
- Net cashflow
- $939
Break-even live
UW: 25.0% down · 7.5% · 30yr · 1.5% tax · 5.0% vac · 8.0% maint · 8.0% mgmt
Financing live
Cash to close
- Down payment
- $16,250
- Closing costs
- $1,950
- Reserves months
- —
- Total cash needed
- —
Loan-product check · same deal, 3 products live
Conventional
25% down · 7.5% · 30yr
- Down + closing
- —
- Monthly P&I
- —
- Monthly cashflow
- —
- DSCR
- —
- Eligible?
- —
Personal DTI + credit; lowest rate.
DSCR
20% down · 8.5% · 30yr
- Down + closing
- —
- Monthly P&I
- —
- Monthly cashflow
- —
- DSCR
- —
- Eligible?
- —
No personal income docs; deal must DSCR.
Hard money
10% down · 12.0% · 12mo
- Down + closing
- —
- Monthly P&I
- —
- Monthly cashflow
- —
- DSCR
- —
- Eligible?
- —
Short-term bridge; refi at stabilization.
Listing history 32 events
-
2026-06-18days on market $65,000 Active 157 DOM
-
2026-06-17days on market $65,000 Active 156 DOM
-
2026-06-16days on market $65,000 Active 155 DOM
-
2026-06-15days on market $65,000 Active 154 DOM
-
2026-06-14days on market $65,000 Active 152 DOM
-
2026-06-10days on market $65,000 Active 149 DOM
-
2026-06-09days on market $65,000 Active 148 DOM
-
2026-06-08days on market $65,000 Active 147 DOM
-
2026-06-07days on market $65,000 Active 146 DOM
-
2026-06-05days on market $65,000 Active 143 DOM
-
2026-06-03days on market $65,000 Active 142 DOM
-
2026-06-02days on market $65,000 Active 141 DOM
-
2026-06-01days on market $65,000 Active 140 DOM
-
2026-05-31days on market $65,000 Active 139 DOM
-
2026-05-31days on market $65,000 Active 138 DOM
-
2026-04-06price $65,000 603-char remark
Show marketing remark (603 chars)
Don’t miss this beautifully updated 2015 mobile home located in the wonderful, well-desired Timberline community. This inviting 2-bedroom, 1-bath home features a large fenced yard—ideal for pets, entertaining, gardening, or enjoying your own private outdoor space. Inside, you’ll love the fresh updates, and modern kitchen that create a bright, functional feel. The brand new furnace adds peace of mind and energy efficiency. Move-in ready and thoughtfully improved, this home is a fantastic opportunity for comfortable, affordable living. Schedule your showing before it’s gone!
-
2026-02-03price $70,000 603-char remark
Show marketing remark (603 chars)
Don’t miss this beautifully updated 2015 mobile home located in the wonderful, well-desired Timberline community. This inviting 2-bedroom, 1-bath home features a large fenced yard—ideal for pets, entertaining, gardening, or enjoying your own private outdoor space. Inside, you’ll love the fresh updates, and modern kitchen that create a bright, functional feel. The brand new furnace adds peace of mind and energy efficiency. Move-in ready and thoughtfully improved, this home is a fantastic opportunity for comfortable, affordable living. Schedule your showing before it’s gone!
-
2026-01-12$75,000 Active 603-char remark
Show marketing remark (603 chars)
Don’t miss this beautifully updated 2015 mobile home located in the wonderful, well-desired Timberline community. This inviting 2-bedroom, 1-bath home features a large fenced yard—ideal for pets, entertaining, gardening, or enjoying your own private outdoor space. Inside, you’ll love the fresh updates, and modern kitchen that create a bright, functional feel. The brand new furnace adds peace of mind and energy efficiency. Move-in ready and thoughtfully improved, this home is a fantastic opportunity for comfortable, affordable living. Schedule your showing before it’s gone!
-
2024-12-31historical
-
2024-09-23price $85,000
-
2024-08-20price $92,000
-
2024-07-16price $95,000
-
2024-05-09price $98,500
-
2024-04-10$99,000 Active
-
2009-01-19historical
-
2008-11-21$18,500
-
2008-10-17historical
-
2008-07-16$21,500
-
2008-05-23historical
-
2008-04-23$21,500
-
2005-06-04historical
-
2005-05-02$23,000
ⓘ Source: listings_history table (triggers on properties + properties_extension) + one-shot
backfill from property_details.listing_events for pre-trigger history.
Tax reassessment forecast WA · Resets to sale price
- Current annual tax
- $582 · $49/mo
- Projected year-2 tax
- $637 · $53/mo
- Expected delta
- +$55/yr (+$5/mo · 9.4%)
ⓘ Screening estimate from a state-policy table — verify with the county assessor before closing.
Climate risk First Street
- Flood 1/10 Low FEMA zone X (unshaded) · 0% chance over 30 yrs
- Wildfire 7/10 Severe
- Heat 3/10 Moderate 7 d/yr ≥93°F today · 15 d/yr by 30 yrs out
- Wind 1/10 Low
- Air quality 9/10 Extreme 15 unhealthy d/yr today · 17 by 30 yrs out
Nearby sold comps map
Loading sold comps map…
Walkable amenities ~0.75 mi
Loading nearby amenities…
Taxation est. · year 1
- Rental income
- $20,595
- − Mortgage interest
- −$3,641
- − Property taxes
- −$582
- − Insurance
- −$325
- − Repairs & maintenance
- −$1,648
- − Management
- −$1,648
- − Depreciation
- −$1,891
- Taxable income
- $10,860
- Est. tax owed @ 24.0%
- −$2,606
- After-tax cash flow
- $8,666/yr
For passive investors: Depreciation is non-cash, so a rental often shows a tax loss while cash-flowing — sheltering income. Rental losses are passive: they offset passive income freely, and up to $25,000/yr can offset ordinary (W-2) income if you actively participate and your MAGI is under $100k (phasing out to $0 by $150k); unused losses carry forward. On sale, claimed depreciation is recaptured at up to 25%, and gains may owe capital-gains tax (a 1031 exchange can defer both). Figures are a year-1 estimate at your 24.0% rate — not tax advice; consult a CPA.
Schools (NCES district)
- District
- East Valley School District (Spokane)
- NCES district ID
- 5302280
- Math proficiency
- 40% ▼ -5.00%
- Reading proficiency
- 56% ▼ -4.00%
- Median HH income
- $49,557
- Composite
- 43.15/100
- National rank
- #6603
- State rank
- #160 of 291 in WA
Livability — Spokane Valley
- Score
- 85/100
- State rank
- #31
- US rank
- #512
Category grades
Schools grade is shown separately in the Schools card above.
Census & demographics
- City population
- 129,511
- Population (ZIP)
- 5,878
Population outlook (Spokane County) Hauer SSP2
- Today (2025)
- 531,314 people
- By 2030
- 549,278 · +3.4%
- By 2040
- 577,822 · +8.8%
- By 2050
- 598,188 · +12.6%
- By 2075
- 630,744 · +18.7%
- By 2100
- 622,360 · +17.1%
Race, ethnicity, and origin ACS 2023
- Neighborhood character
- Predominantly White (93%)
- Race & ethnicity
- White 93% Two or more races 3% Hispanic / Latino 3%
- Common ancestry
- Slovak 6% Portuguese 3% Lithuanian 2%
- Foreign-born
- 2%
Political lean MEDSL · Spokane
- 2024 margin
- Toss-up / Even · D 46.0% · R 51.0% · Other 3.0%
- 2008→2024 swing
- -3.8pp toward R · 2008: -1.1pp · 2024: -5.0pp
- All cycles
- 2024: R+5.0 2020: R+4.3 2016: R+8.3 2012: R+6.3 2008: R+1.1
Not yet ingested
- Civics
- —
Market trends
- HPI YoY
- ▼ -92.71%
- Current HPI
- 360.3438
- Rent YoY
- —
- Metro
- —
- State GDP YoY
- ▲ 4.65%
- F500 in state
- 22
Industry mix (Fortune 500 HQ in WA)
| Industry | F500 HQs | Revenue |
|---|---|---|
| Retail | 2 | $269B |
|
||
| Technology / Retail | 1 | $638B |
|
||
| Technology | 1 | $245B |
|
||
| Telecommunications | 1 | $38B |
|
||
| Food / Beverage | 1 | $36B |
|
||
| Automotive / Trucks | 1 | $34B |
|
||
Price history
+182.6% since first listed17 events — show timeline
- 2026-04-06 Price Changed $65,000 SPOKANEMLS as Distributed by MLS Grid
- 2026-02-03 Price Changed $70,000 SPOKANEMLS as Distributed by MLS Grid
- 2026-01-12 Listed $75,000 SPOKANEMLS as Distributed by MLS Grid
- 2024-12-31 Listing Removed — SPOKANEMLS as Distributed by MLS Grid
- 2024-09-23 Price Changed $85,000 SPOKANEMLS as Distributed by MLS Grid
- 2024-08-20 Price Changed $92,000 SPOKANEMLS as Distributed by MLS Grid
- 2024-07-16 Price Changed $95,000 SPOKANEMLS as Distributed by MLS Grid
- 2024-05-09 Price Changed $98,500 SPOKANEMLS as Distributed by MLS Grid
- 2024-04-10 Listed $99,000 SPOKANEMLS as Distributed by MLS Grid
- 2009-01-19 Listing Removed — SPOKANEMLS as Distributed by MLS Grid
- 2008-11-21 Listed $18,500 SPOKANEMLS as Distributed by MLS Grid
- 2008-10-17 Listing Removed — SPOKANEMLS as Distributed by MLS Grid
- 2008-07-16 Listed $21,500 SPOKANEMLS as Distributed by MLS Grid
- 2008-05-23 Listing Removed — SPOKANEMLS as Distributed by MLS Grid
- 2008-04-23 Listed $21,500 SPOKANEMLS as Distributed by MLS Grid
- 2005-06-04 Listing Removed — SPOKANEMLS as Distributed by MLS Grid
- 2005-05-02 Listed $23,000 SPOKANEMLS as Distributed by MLS Grid
Property tax history
+8.8%/yrLatest (2026): $582 · +28.9% YoY. Source: county tax records.
Cash-flow waterfall
monthlySold comps — $/sqft
last 12 mo · ≤1 miLoading sold comps…