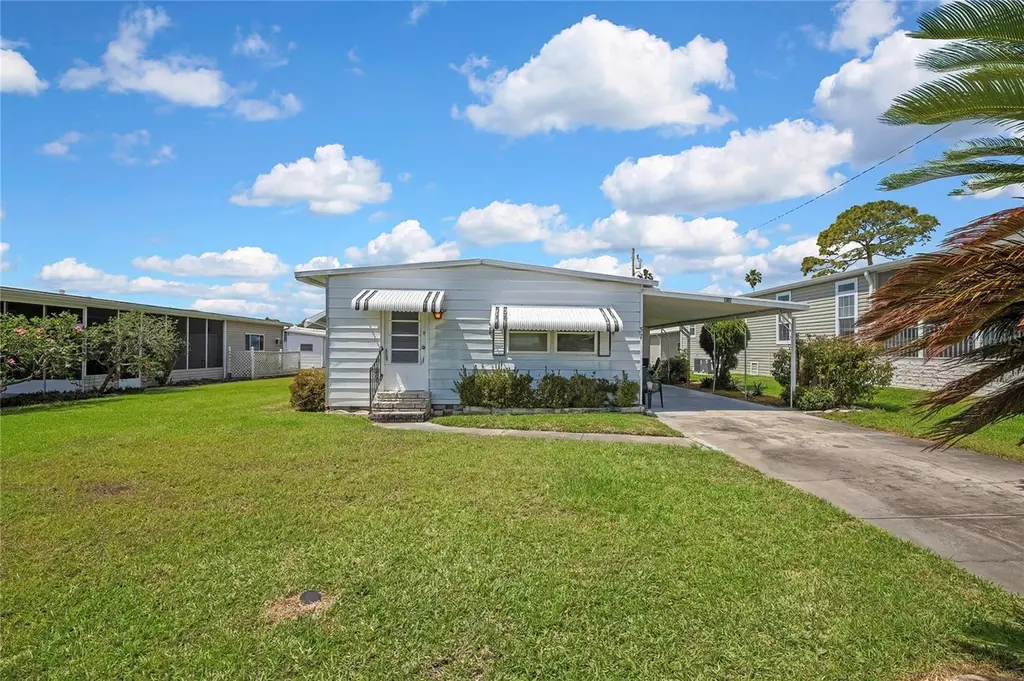
37 William Penn Way #13 · Palm Harbor, FL
Flood risk 4/10 · Minor
- FEMA flood zone
- X (unshaded)
- Chance of flooding over 30 yrs
- 0.21%
- Est. flood insurance / yr
- $507 – $1,088
Fire risk 1/10 · Minimal
- Est. fire insurance / yr
- $947 – $1,759
Heat risk 10/10 · Severe
- Hot days now (above 108°F)
- 7 days/yr
- Hot days in 30 yrs
- 27 days/yr
Wind risk 10/10 · Severe
- Chance of severe wind over 30 yrs
- 99.0%
Air-quality risk 3/10 · Minor
- Unhealthy air days now
- 2 days/yr
- Unhealthy air days in 30 yrs
- 2 days/yr
Risk factors via First Street. Map © Google.
Why this score? — see what drove the B+ grade
The composite is a weighted blend of 9 inputs, each scored 0–100. Each bar is that input's sub-score; the figure is the points it added to the 100-point composite (weight × sub-score).
- Cash flow +30.0/30.0
- ARV discount +15.0/15.0
- 1% rule +10.0/10.0
- DSCR +10.0/10.0
- Schools +4.3/10.0
- Livability +4.0/5.0
- Condition / age +2.5/5.0
- Rent growth +1.2/5.0
- Appreciation +0.0/10.0
$119,000
🖨 Deal sheet 📄 Offer letter ✓ Due diligence
Listing remarks
Under contract-accepting backup offers. Price Reduced !!! Located in a peaceful Lake Tarpon established 55+ community, this 1964 mobile home presents a fantastic opportunity for buyers looking to renovate and make a home their own. Full of potential, this property is ideal for those with a vision to update, restore, or customize a space to fit their lifestyle. The home offers a functional layout with a large living area, kitchen, and two bedrooms ready for transformation. Whether you're planning a light refresh or a full renovation, this property provides a solid starting point to create a comfortable and personalized retreat. Beyond the home, the community itself is a standout feature. Res
Key facts
- 6,081 sq ft lot
- Parking
- Community pool
Property features AI
Finance
- Financial info: Lease restrictions apply
- HOA & community: Has HOA (monthly fee required); Monthly association fee of $109.69; Association approval required; Association amenities include clubhouse, recreation facilities, shuffleboard court; Pool and recreational facilities included in association fee; Community features: buyer approval required, deed restrictions, golf carts allowed, pool, sidewalks; Senior community; Pets allowed (cats and dogs)
Exterior
- Parking: Carport (1 space)
- Security: Smoke detector(s)
- Utilities: Public water; Public sewer; Electricity available; Cable available; Broadband/high-speed internet available
- Home design: Residential mobile home (double wide); One story; Faces east; Lake Tarpon access with assigned boat slip
- Construction: Metal frame construction; Membrane and metal roof
- Exterior features: Covered patio/porch; Storage shed; Mature landscaping; Cleared lot; Asphalt road
Interior
- Kitchen: Dishwasher; Disposal; Range; Electric water heater
- Bedrooms: 2 bedrooms
- Flooring: Carpet; Linoleum
- Bathrooms: 1 full bath; 1 half bath
- Heating & cooling: Central heating; Central air conditioning
- Interior features: Ceiling fans; Kitchen open to family room; Open floorplan; Thermostat; Smoke detector(s)
- Laundry & utility: Washer hookup; Electric dryer hookup; Laundry located outside
Neighborhood map
What this means for you Summary
Snapshot
- This is a 2-bed/1.0-bath manufactured listed at $119k.
Deal economics
- At list price, monthly cash flow is $635 ($8k/yr) — positive.
- The deal already cash-flows at list — no discount required.
- Meets the 1% rule at list price ($2k rent vs $119k).
- Recommended offer: $112k (6.0% below list) — sets the bar for market timing.
- Cap rate 12.7% vs local median 3.1% in Palm Harbor — top-decile yield for the area; either an underpriced asset or a hidden risk that comps aren't pricing in. Stress-test before assuming the spread holds.
Location & tenants
- Location reads 81/100 on livability (#95 in FL, #1,470 nationally) — a professional / high-income tenant draw. Strengths: schools A+, housing A+, commute A; Watch: amenities F.
- Pinellas (suburban): math 51% / reading 51% proficiency, ranked #31 of 73 in FL (top 42%) — acceptable for families but not a draw, mixed tenant base, ~2y average lease.
- Market conditions: Rents falling (-5.2%/yr); 371 active listings in the ZIP; 40 comparable units currently listed for rent nearby; rentals at typical pace (median 18d on market — plan ~3-4 weeks tenant-placement turnaround); 2,676 units permitted in Pinellas County in 2024 (1,422 in 5+ unit buildings).
- This rent runs 33% of the median local income ($72k/yr) — at the standard rent-burdened threshold; future hikes will face affordability resistance.
Forward outlook
- Local home prices are declining (-3.0%/yr); year-one equity from $823 of loan paydown is wiped out by about $4k of value loss. Plan a longer hold.
- Pinellas County population projected at +14% by 2050 — modest demand growth; plan on rents tracking national, not racing it.
- At projected returns (-3.0% appreciation + 0.0% rent growth), your $33k cash investment doubles in ~7 years — after that, you're playing with house money.
Negotiation context
- It's been on market 61 days — a 6% lower offer ($112k) is reasonable based on typical stale-listing flexibility.
- Current owner paid $24k; list at $119k implies a 396% gain — meaningful room to come down on a strong offer.
Risks & watch-outs
- Climate carrying-cost: severe wind risk, 99% chance of damaging wind over 30y; extreme-heat days projected 7→27/yr by 2055 (HVAC capex compounding) — expect insurance premiums to compound above CPI over the hold.
Questions for the listing agent
- It's been on market 61 days. Have you received any prior offers? Is the seller open to a 6% concession, seller financing, or rate buy-down credit?
- Built in 1964 — when were the roof, HVAC, electrical panel, plumbing, and water heater last replaced?
- What does the HOA fee cover, when was the last increase, and are there any pending special assessments or reserve-fund shortfalls?
- Why hasn't it sold? Are there any deal-killer items the seller is aware of (foundation, flood, title, zoning, code violations)?
- Is there a deadline driving the sale (1031 exchange, divorce, estate, relocation)? That informs how much negotiation room exists.
- Schools are A-rated — typically a magnet for longer-tenancy family renters. What's the average tenant stay here, and is there a school-zone premium baked into asking?
- What's the average days-on-market for RENTAL listings here right now (not sales)? A rising rental-DOM trend means longer vacancies and softer asking-rent achievability than the comps imply.
- What's the recent tenant-quality profile in this submarket — average credit score on applications, eviction rate, late-payment / NSF rate, and stable-employment percentage? A property-management company in the area should have these aggregated.
- How much new for-sale + rental construction is in the pipeline within 1–3 miles? Heavy new supply typically softens prices + rents 12–24 months out; constrained supply supports both.
Investment metrics
- 1% rule
- 1.69% ✓
- Cap rate
- 12.70%
- Cash-on-cash
- 22.88%
- DSCR
- 2.02
- GRM
- 4.9
CMA / ARV
- ARV (on-the-fly)
- $218,736
- Comps found
- 1
Show comp detail 1 sale within ~0.75 mi
| Address | Dist | Beds/Ba | Sqft | Sold | Price | $/sf | Match |
|---|---|---|---|---|---|---|---|
| 251 Independence Ave #20 | 0.35mi | 3/2.0 (+1) | 1,084 (+8%) | 15mo | $235,000 | $217 | 50 |
Match score weights: distance 35% · size 25% · config 20% · recency 20%. Top-matched comps best support the ARV.
Projected returns pro-forma
-3.0% appreciation · 0.0% rent growth · sell at horizon
- IRR
- 12.1%
- Equity multiple
- 1.46×
- Total profit
- $15,395
- Equity at exit
- $17,743
- IRR
- 18.3%
- Equity multiple
- 2.30×
- Total profit
- $43,189
- Equity at exit
- $10,289
Cash invested: $33,320 (down + closing). Projections, not guarantees.
Landlord ↔ Tenant lean methodology
- Overall (STATE)
- 87 Strongly Landlord-Friendly
- State Florida
- 87 Strongly Landlord-Friendly · R+3
- County
- — inherits STATE
- City
- — inherits STATE
ZIP-level market 34684
- Rents YoY
- -5.2%
- Active inventory
- 371
- Price-to-rent
- 4.9×
Monthly cashflow live
- Estimated rent
- $2,010 high interval (Pro) →
- Mortgage (P&I)
- −$624
- Tax from tax record
- −$170 /mo · $2,036/yr
- Insurance
- −$50
- HOA
- −$109
- Vacancy / Maint / Mgmt
- −$422
- Net cashflow
- $635
Break-even live
UW: 25.0% down · 7.5% · 30yr · 1.5% tax · 5.0% vac · 8.0% maint · 8.0% mgmt
Financing live
Cash to close
- Down payment
- $29,750
- Closing costs
- $3,570
- Reserves months
- —
- Total cash needed
- —
Loan-product check · same deal, 3 products live
Conventional
25% down · 7.5% · 30yr
- Down + closing
- —
- Monthly P&I
- —
- Monthly cashflow
- —
- DSCR
- —
- Eligible?
- —
Personal DTI + credit; lowest rate.
DSCR
20% down · 8.5% · 30yr
- Down + closing
- —
- Monthly P&I
- —
- Monthly cashflow
- —
- DSCR
- —
- Eligible?
- —
No personal income docs; deal must DSCR.
Hard money
10% down · 12.0% · 12mo
- Down + closing
- —
- Monthly P&I
- —
- Monthly cashflow
- —
- DSCR
- —
- Eligible?
- —
Short-term bridge; refi at stabilization.
Rent comps 40 comps
| Address | Beds | Baths | Sqft | Rent | $/sqft | DOM | Units | Dist |
|---|---|---|---|---|---|---|---|---|
| 47 Delaware Ct #10 Palm Harbor, FL | 2.0 | 2.0 | 1008 | $1,800 | $1.79 | 20d | 1 | 0.18mi |
| 21 Lake Shore Dr Palm Harbor, FL | 3.0 | 2.0 | 1434 | $2,895 | $2.02 | 4d | 1 | 0.19mi |
| 65 Lake Shore Dr Palm Harbor, FL | 2.0 | 1.0 | 868 | $1,700 | $1.96 | 17d | 1 | 0.20mi |
| 36090 US Highway 19 N Palm Harbor, FL | 1.0–3.0 | 1.0–2.0 | 1046 | $2,557 | $2.44 | 3d | 66 | 0.24mi |
| 72 Lake Shore Dr Palm Harbor, FL | 3.0 | 2.0 | 1100 | $1,800 | $1.64 | 17d | 1 | 0.25mi |
| 245 Lake Tarpon Dr Palm Harbor, FL | 2.0 | 2.0 | 1000 | $1,995 | $2.00 | 2d | 1 | 0.31mi |
| 218 Maple Ave Palm Harbor, FL | 3.0 | 2.0 | 1374 | $2,600 | $1.89 | 17d | 1 | 0.35mi |
| 35820 U.S. 19 Unit A2 Palm Harbor, FL | 1.0 | 1.0 | 740 | $1,884 | $2.55 | 4d | 1 | 0.36mi |
| 35820 U.S. 19 Unit C1 Palm Harbor, FL | 3.0 | 2.0 | 1404 | $2,781 | $1.98 | 4d | 1 | 0.36mi |
| 35820 U.S. 19 Unit B1 Palm Harbor, FL | 2.0 | 2.0 | 1116 | $2,245 | $2.01 | 4d | 1 | 0.36mi |
| 3277 Fox Chase Cir N #211 Palm Harbor, FL | 2.0 | 2.0 | 825 | $1,495 | $1.81 | 24d | 1 | 0.40mi |
| 274 Beach Ct #42 Palm Harbor, FL | 2.0 | 2.0 | 1056 | $1,600 | $1.52 | 24d | 1 | 0.41mi |
| 2400 Clubside Ct Palm Harbor, FL | 1.0–3.0 | 1.0–2.0 | 1129 | $1,940 | $1.72 | 1d | 39 | 0.45mi |
| 36750 US Highway 19 N Unit 19-115 Palm Harbor, FL | 1.0 | 1.0 | 825 | $2,150 | $2.61 | 3d | 1 | 0.46mi |
| 3300 Fox Chase Cir N Palm Harbor, FL | 2.0 | 2.0 | 906 | $2,125 | $2.35 | 1d | 2 | 0.49mi |
| 3121 Beecher Dr E Unit A Palm Harbor, FL | 2.0 | 2.0 | 976 | $2,100 | $2.15 | 7d | 1 | 0.62mi |
| 2141 Portofino Pl Palm Harbor, FL | 1.0 | 1.0 | 700 | $1,510 | $2.16 | 24d | 2 | 0.64mi |
| 3023 Beecher Dr E Unit D Palm Harbor, FL | 3.0 | 2.5 | 1425 | $2,400 | $1.68 | 17d | 1 | 0.65mi |
| 2199 Chianti Pl Unit 9-0923 Palm Harbor, FL | 2.0 | 2.0 | 1030 | $2,300 | $2.23 | 24d | 1 | 0.66mi |
| 2200 Tuscany Trce #15 Palm Harbor, FL | 3.0 | 2.0 | 1300 | $2,300 | $1.77 | 24d | 1 | 0.67mi |
| 2139 Chianti Pl Unit 154 Palm Harbor, FL | 1.0 | 1.0 | 830 | $1,700 | $2.05 | 24d | 1 | 0.67mi |
| 2151 Chianti Pl Unit 127 Palm Harbor, FL | 2.0 | 2.0 | 1085 | $1,700 | $1.57 | 23d | 1 | 0.67mi |
| 2249 Portofino Pl #2221 Palm Harbor, FL | 2.0 | 2.0 | 1200 | $1,795 | $1.50 | 13d | 1 | 0.69mi |
| 2218 Portofino Pl #247 Palm Harbor, FL | 2.0 | 2.5 | 1050 | $1,895 | $1.80 | 17d | 1 | 0.71mi |
| 2139 Chianti Pl Unit 15-0153 Palm Harbor, FL | 2.0 | 2.0 | 1226 | $1,823 | $1.49 | 4d | 1 | 0.73mi |
| 2176 Portofino Pl Unit 26-026 Palm Harbor, FL | 1.0 | 1.0 | 830 | $1,600 | $1.93 | 24d | 1 | 0.74mi |
| 2171 Portofino Pl #2727 Palm Harbor, FL | 1.0 | 1.0 | 700 | $1,550 | $2.21 | 24d | 1 | 0.76mi |
| 2945 Grovewood Blvd Unit A Palm Harbor, FL | 2.0 | 2.0 | 1030 | $1,775 | $1.72 | 17d | 1 | 0.76mi |
| 2130 Bancroft Pl Unit E Palm Harbor, FL | 2.0 | 2.0 | 1030 | $1,850 | $1.80 | 3d | 1 | 0.80mi |
| 2130 Bancroft Pl Unit E Palm Harbor, FL | 2.0 | 2.0 | 1030 | $1,860 | $1.81 | 7d | 1 | 0.80mi |
| 2107 Portofino Pl Unit 30-3014 Palm Harbor, FL | 3.0 | 2.0 | 1350 | $2,150 | $1.59 | 3d | 1 | 0.82mi |
| 2107 Portofino Pl Unit 30-302 Palm Harbor, FL | 2.0 | 2.0 | 1034 | $2,500 | $2.42 | 7d | 1 | 0.82mi |
| 2107 Portofino Pl Palm Harbor, FL | 2.0 | 2.0 | 1055 | $2,250 | $2.13 | 4d | 2 | 0.82mi |
| 2571 Cyprus Dr Unit 1-101 Palm Harbor, FL | 1.0 | 1.0 | 755 | $1,900 | $2.52 | 21d | 1 | 0.82mi |
| 2587 Cyprus Dr Unit 3-214 Palm Harbor, FL | 2.0 | 2.0 | 825 | $2,000 | $2.42 | 24d | 1 | 0.82mi |
| 2571 Cyprus Dr Unit 1-202 Palm Harbor, FL | 2.0 | 2.0 | 975 | $2,800 | $2.87 | 24d | 1 | 0.82mi |
| 2481 Malcolm Dr Palm Harbor, FL | 2.0 | 2.0 | 1319 | $2,600 | $1.97 | 17d | 1 | 0.83mi |
| 36750 US Highway 19 N Unit 6109 Palm Harbor, FL | 1.0 | 1.0 | 825 | $1,975 | $2.39 | 24d | 1 | 0.91mi |
| 2350 Cypress Pond Rd Palm Harbor, FL | 1.0–2.0 | 1.0–2.0 | 790 | $1,670 | $2.11 | 1d | 54 | 0.93mi |
| 2334 Citrus Hill Rd Palm Harbor, FL | 2.0 | 2.0 | 1189 | $2,350 | $1.98 | 4d | 1 | 1.03mi |
HOA detail
- Monthly dues
- $109 · $1,308/yr
Listing history 11 events
-
2026-06-18status $119,000 Pending 61 DOM
-
2026-06-18days on market $119,000 Active 61 DOM
-
2026-06-17days on market $119,000 Active 60 DOM
-
2026-06-16days on market $119,000 Active 59 DOM
-
2026-06-15days on market $119,000 Active 58 DOM
-
2026-06-13pricedays on market $119,000 Active 56 DOM
-
2026-05-20price $135,000
-
2026-04-02$147,000 Active
-
1996-06-12soldstatus $24,000
-
1991-12-26soldstatus $36,500
-
1982-03-01soldstatus $33,000
ⓘ Source: listings_history table (triggers on properties + properties_extension) + one-shot
backfill from property_details.listing_events for pre-trigger history.
Tax reassessment forecast FL · Resets to sale price
- Current annual tax
- $2,036 · $170/mo
- Projected year-2 tax
- $2,036 · $170/mo
- Expected delta
- $0/yr ($0/mo · 0.0%)
ⓘ Screening estimate from a state-policy table — verify with the county assessor before closing.
Climate risk First Street
- Flood 4/10 Moderate FEMA zone X (unshaded) · 21% chance over 30 yrs
- Wildfire 1/10 Low
- Heat 10/10 Extreme 7 d/yr ≥108°F today · 27 d/yr by 30 yrs out
- Wind 10/10 Extreme 99% chance of damaging wind over 30 yrs
- Air quality 3/10 Moderate 2 unhealthy d/yr today · 2 by 30 yrs out
Nearby sold comps map
Loading sold comps map…
Walkable amenities ~0.75 mi
Loading nearby amenities…
Taxation est. · year 1
- Rental income
- $24,114
- − Mortgage interest
- −$6,666
- − Property taxes
- −$2,036
- − Insurance
- −$595
- − Repairs & maintenance
- −$1,929
- − Management
- −$1,929
- − HOA
- −$1,308
- − Depreciation
- −$3,462
- Taxable income
- $6,189
- Est. tax owed @ 24.0%
- −$1,485
- After-tax cash flow
- $6,137/yr
For passive investors: Depreciation is non-cash, so a rental often shows a tax loss while cash-flowing — sheltering income. Rental losses are passive: they offset passive income freely, and up to $25,000/yr can offset ordinary (W-2) income if you actively participate and your MAGI is under $100k (phasing out to $0 by $150k); unused losses carry forward. On sale, claimed depreciation is recaptured at up to 25%, and gains may owe capital-gains tax (a 1031 exchange can defer both). Figures are a year-1 estimate at your 24.0% rate — not tax advice; consult a CPA.
Schools (NCES district)
- District
- Pinellas
- NCES district ID
- 1201560
- Math proficiency
- 51% ▼ -5.00%
- Reading proficiency
- 51% ▼ -3.00%
- Median HH income
- $46,270
- Composite
- 43.27/100
- National rank
- #3046
- State rank
- #31 of 73 in FL
Livability — Palm Harbor
- Score
- 81/100
- State rank
- #95
- US rank
- #1470
Category grades
Schools grade is shown separately in the Schools card above.
Census & demographics
- Census place
- Palm Harbor, FL
- County
- Pinellas County · 939,478 people
- City population
- 79,072
- Metro
- Tampa-St. Petersburg-Clearwater, FL
- Population (ZIP)
- 27,029
- Household income
- $72,145
- Rent vs Own
- Severe rent burden
- 1495.0
Population outlook (Pinellas County) Hauer SSP2
- Today (2025)
- 1,027,532 people
- By 2030
- 1,063,586 · +3.5%
- By 2040
- 1,125,020 · +9.5%
- By 2050
- 1,168,637 · +13.7%
- By 2075
- 1,265,188 · +23.1%
- By 2100
- 1,260,357 · +22.7%
Race, ethnicity, and origin ACS 2023
- Neighborhood character
- Predominantly White (81%)
- Race & ethnicity
- White 81% Hispanic / Latino 10% Two or more races 8% Asian 4% Black 3%
- Hispanic origin (detail)
- Puerto Rican 2% Cuban 2%
- Common ancestry
- Lithuanian 5% Romanian 5% Scotch-Irish 3%
- Foreign-born
- 13% · Canada, Jamaica, China
- Languages at home
- 84% English-only · Spanish 6% Russian/Polish/Slavic 3% Other Indo-European 2%
Political lean MEDSL · Pinellas
- 2024 margin
- Lean R (+5.2) · D 46.9% · R 52.1%
- 2008→2024 swing
- -13.5pp toward R · 2008: 8.3pp · 2024: -5.2pp
- All cycles
- 2024: R+5.2 2020: D+0.2 2016: R+1.1 2012: D+5.6 2008: D+8.3
Not yet ingested
- Civics
- —
Market trends
- HPI YoY
- ▼ -296.23%
- Current HPI
- 301.651
- Rent YoY
- ▼ -5.17%
- Metro
- Tampa-St. Petersburg-Clearwater, FL
- State GDP YoY
- ▲ 3.28%
- F500 in state
- 36
Industry mix (Fortune 500 HQ in FL)
| Industry | F500 HQs | Revenue |
|---|---|---|
| Industrial Technology | 2 | $29B |
|
||
| Insurance | 2 | $17B |
|
||
| Retail | 1 | $60B |
|
||
| Technology Distribution | 1 | $58B |
|
||
| Homebuilding | 1 | $35B |
|
||
| Technology Manufacturing | 1 | $35B |
|
||
Price history
+309.1% since first listed5 events — show timeline
- 2026-05-20 Price Changed $135,000 Stellar MLS as Distributed by MLS Grid
- 2026-04-02 Listed $147,000 Stellar MLS as Distributed by MLS Grid
- 1996-06-12 Sold (Public Records) $24,000 Public Records
- 1991-12-26 Sold (Public Records) $36,500 Public Records
- 1982-03-01 Sold (Public Records) $33,000 Public Records
Property tax history
+7.6%/yrLatest (2025): $2,036 · +12.0% YoY. Source: county tax records.
Cash-flow waterfall
monthlySold comps — $/sqft
last 12 mo · ≤1 miLoading sold comps…