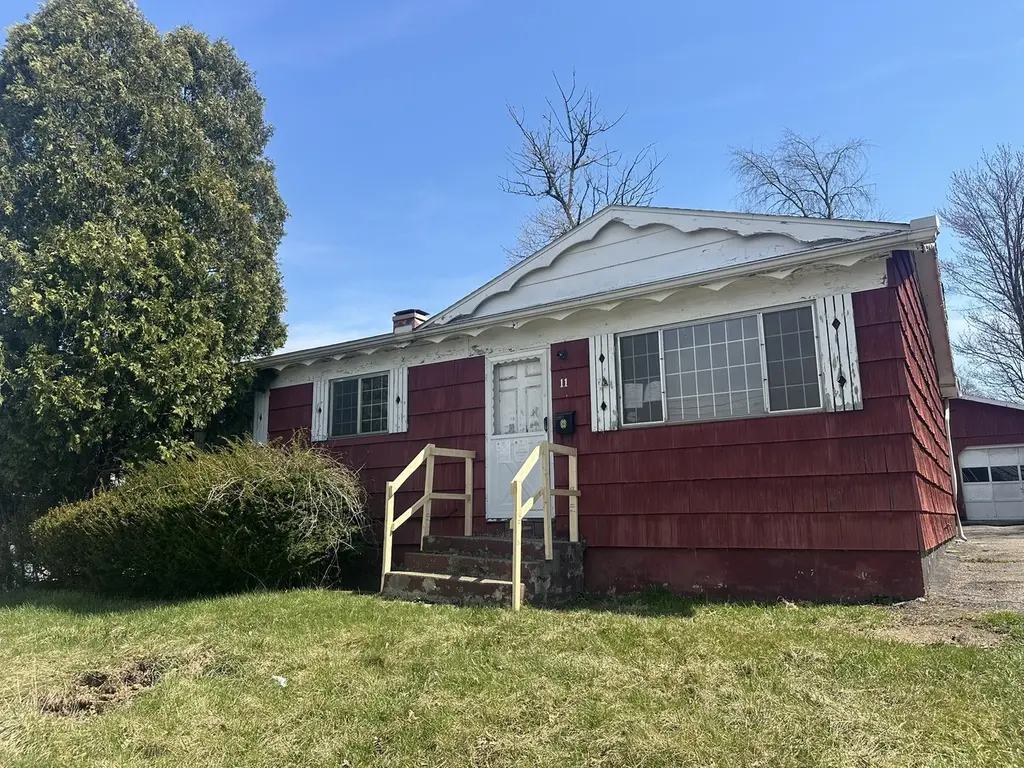
11 Woodlawn Ave · Owego, NY
Flood risk 1/10 · Minimal
- FEMA flood zone
- X (unshaded)
- Chance of flooding over 30 yrs
- 0.0%
- Est. flood insurance / yr
- $473 – $860
Fire risk 1/10 · Minimal
- Est. fire insurance / yr
- $691 – $1,283
Heat risk 3/10 · Minor
- Hot days now (above 94°F)
- 7 days/yr
- Hot days in 30 yrs
- 16 days/yr
Wind risk 2/10 · Minimal
- Chance of severe wind over 30 yrs
- 1.0%
Air-quality risk 2/10 · Minimal
- Unhealthy air days now
- 0 days/yr
- Unhealthy air days in 30 yrs
- 1 days/yr
Risk factors via First Street. Map © Google.
Why this score? — see what drove the A- grade
The composite is a weighted blend of 9 inputs, each scored 0–100. Each bar is that input's sub-score; the figure is the points it added to the 100-point composite (weight × sub-score).
- Cash flow +30.0/30.0
- 1% rule +10.0/10.0
- DSCR +10.0/10.0
- Appreciation +9.1/10.0
- ARV discount +7.5/15.0
- Schools +5.3/10.0
- Livability +3.8/5.0
- Rent growth +2.5/5.0
- Condition / age +2.5/5.0
$79,000
🖨 Deal sheet (PDF) 📄 Offer letter ✓ Due diligence
Listing remarks
Bring your vision and creativity to restore this home to its full potential! Located in the Village of Owego, this property offers convenient access to local shops, dining, and everyday amenities, along with easy highway access for commuting. Positioned just 20 minutes from Binghamton and 30 minutes from Elmira, it’s ideally situated for travel in either direction. A great opportunity for investors or buyers looking to add value—schedule your showing today and imagine the possibilities! Highest & Best Hold Period active - expires 04/14/2026 2:00pm.
Key facts
- Easy highway access
- 8,712 sq ft lot
- Built 1961
Tags
Property features AI
Exterior
- Parking: Driveway
- Utilities: Public water; Public sewer; Cable available
- Home design: Single-family residence; One story
- Construction: Cedar exterior
- Exterior features: Covered deck; Level lot
Interior
- Flooring: Hardwood; Tile; Vinyl
- Bathrooms: One full bathroom; One half bathroom
- Heating & cooling: Forced air heating
- Interior features: Gas water heater; Hardwood, tile and vinyl flooring; 8 total rooms
Neighborhood map
What this means for you Summary
Snapshot
- This is a 3-bed/1.5-bath single-family listed at $79k.
Deal economics
- At list price, monthly cash flow is $481 ($6k/yr) — positive.
- The deal already cash-flows at list — no discount required.
- Meets the 1% rule at list price ($1k rent vs $79k).
- Recommended offer: $78k (1.5% below list) — sets the bar for market timing.
- Cap rate 13.6% vs local median 5.3% in Owego — top-decile yield for the area; either an underpriced asset or a hidden risk that comps aren't pricing in. Stress-test before assuming the spread holds.
Location & tenants
- Location reads 76/100 on livability (#214 in NY, #3,289 nationally) — a middle-class / working-renter tenant base. Strengths: cost of living A+, housing A+, health & safety A+; Watch: employment D+, commute F.
- Owego-Apalachin Central School District (town): math 62% / reading 62% proficiency, ranked #204 of 590 in NY (top 35%) — acceptable for families but not a draw, mixed tenant base, ~2y average lease.
- Zoned schools: Owego Elementary School (math 72% / reading 67%, grade A-, #447 of 2,108 statewide, top 24%, 486 students, 53% FRL) — zoned schools average 53% FRL vs 35% district-wide (18 pts higher); higher-poverty schools than district average — tighter screening recommended.
- Market conditions: 65 active listings in the ZIP; 1 comparable units currently listed for rent nearby; 139 units permitted in Tioga County in 2024 (65 in 5+ unit buildings).
Forward outlook
- In year one you build about $7k of equity ($546 loan paydown + $6k appreciation (8.1% local appreciation)).
- Tioga County population projected at -27% by 2050 — secular population decline; favor cash flow + early exit over multi-decade hold.
- At projected returns (8.1% appreciation + 3.0% rent growth), your $22k cash investment doubles in ~2 years — after that, you're playing with house money.
- By year 5, paydown + projected appreciation supports a ~$31k cash-out refi (75% LTV) — recoverable capital for the next deal without selling this one.
Negotiation context
- It's been on market 17 days — a 2% lower offer ($78k) is reasonable based on typical stale-listing flexibility.
- 2 sale attempts with the ask held roughly flat each time — persistent listings suggest the price (not the market) is what's stuck; bring a comps-based counter.
- Current owner paid $55k; 44% above their basis — modest negotiation headroom, anchor on the comps not their cost.
Questions for the listing agent
- Built in 1961 — when were the roof, HVAC, electrical panel, plumbing, and water heater last replaced?
- Is there a deadline driving the sale (1031 exchange, divorce, estate, relocation)? That informs how much negotiation room exists.
- What's the average days-on-market for RENTAL listings here right now (not sales)? A rising rental-DOM trend means longer vacancies and softer asking-rent achievability than the comps imply.
- What's the recent tenant-quality profile in this submarket — average credit score on applications, eviction rate, late-payment / NSF rate, and stable-employment percentage? A property-management company in the area should have these aggregated.
- How much new for-sale + rental construction is in the pipeline within 1–3 miles? Heavy new supply typically softens prices + rents 12–24 months out; constrained supply supports both.
Investment metrics
- 1% rule
- 1.65% ✓
- Cap rate
- 13.60%
- Cash-on-cash
- 26.10%
- DSCR
- 2.16
- GRM
- 5.1
CMA / ARV
- ARV (on-the-fly)
- $79,040
- Comps found
- 3
Show comp detail 3 sales within ~0.75 mi
| Address | Dist | Beds/Ba | Sqft | Sold | Price | $/sf | Match |
|---|---|---|---|---|---|---|---|
| 11 Woodlawn Ave | 0.00mi | 3/1.5 | 988 (0%) | 1mo | $79,000 | $80 | 99 |
| 32 John Street St | 0.74mi | 2/1.0 (-1) | 952 (-4%) | 2mo | $52,500 | $55 | 51 |
| 108 Montrose Tpke | 0.33mi | 3/1.5 | 1,127 (+14%) | 12mo | $151,000 | $134 | 51 |
Match score weights: distance 35% · size 25% · config 20% · recency 20%. Top-matched comps best support the ARV.
Projected returns pro-forma
8.11% appreciation · 3.0% rent growth · sell at horizon
- IRR
- 40.9%
- Equity multiple
- 3.88×
- Total profit
- $63,747
- Equity at exit
- $60,599
- IRR
- 36.5%
- Equity multiple
- 8.34×
- Total profit
- $162,256
- Equity at exit
- $120,847
Cash invested: $22,120 (down + closing). Projections, not guarantees.
Landlord ↔ Tenant lean methodology
- Overall (STATE)
- 15 Strongly Tenant-Friendly
- State New York
- 15 Strongly Tenant-Friendly · D+10
- County
- — inherits STATE
- City
- — inherits STATE
ZIP-level market 13827
- Home prices YoY
- 3.2%
- Active inventory
- 65
- Price-to-rent
- 5.1×
Monthly cashflow live
- Estimated rent
- $1,300 medium interval (Pro) →
- Mortgage (P&I)
- −$414
- Tax est. 1.5%
- −$99 /mo · $1,185/yr
- Insurance
- −$33
- HOA
- −$0
- Vacancy / Maint / Mgmt
- −$273
- Net cashflow
- $481
Break-even live
Sensitivity live
| Price | -10% $536 | -5% $508 | +0% $481 | +5% $454 | +10% $426 |
|---|---|---|---|---|---|
| Rent | -10% $378 | -5% $430 | +0% $481 | +5% $532 | +10% $584 |
| Rate | -1.0pp $521 | -0.5pp $501 | base $481 | +0.5pp $461 | +1.0pp $440 |
UW: 25.0% down · 7.5% · 30yr · 1.5% tax · 5.0% vac · 8.0% maint · 8.0% mgmt
Financing live
Cash to close
- Down payment
- $19,750
- Closing costs
- $2,370
- Reserves months
- —
- Total cash needed
- —
Loan-product check · same deal, 3 products live
Conventional
25% down · 7.5% · 30yr
- Down + closing
- —
- Monthly P&I
- —
- Monthly cashflow
- —
- DSCR
- —
- Eligible?
- —
Personal DTI + credit; lowest rate.
DSCR
20% down · 8.5% · 30yr
- Down + closing
- —
- Monthly P&I
- —
- Monthly cashflow
- —
- DSCR
- —
- Eligible?
- —
No personal income docs; deal must DSCR.
Hard money
10% down · 12.0% · 12mo
- Down + closing
- —
- Monthly P&I
- —
- Monthly cashflow
- —
- DSCR
- —
- Eligible?
- —
Short-term bridge; refi at stabilization.
Rent comps 1 comps
| Address | Beds | Baths | Sqft | Rent | $/sqft | DOM | Units | Dist |
|---|---|---|---|---|---|---|---|---|
| 81 North Ave Unit 2 Owego, NY | 2.0 | 1.0 | 1000 | $1,300 | $1.30 | 44d | 1 | 0.56mi |
Listing history 5 events
-
2026-04-27status Pending
-
2026-04-10$79,000 Active
-
2025-03-16$80,000 Active
-
2002-04-05soldstatus $54,700
-
1999-11-12soldstatus $33,000
ⓘ Source: listings_history table (triggers on properties + properties_extension) + one-shot
backfill from property_details.listing_events for pre-trigger history.
Climate risk First Street
- Flood 1/10 Low FEMA zone X (unshaded) · 0% chance over 30 yrs
- Wildfire 1/10 Low
- Heat 3/10 Moderate 7 d/yr ≥94°F today · 16 d/yr by 30 yrs out
- Wind 2/10 Low 100% chance of damaging wind over 30 yrs
- Air quality 2/10 Low 0 unhealthy d/yr today · 1 by 30 yrs out
Nearby sold comps map
Loading sold comps map…
Walkable amenities ~0.75 mi
Loading nearby amenities…
Taxation est. · year 1
- Rental income
- $15,600
- − Mortgage interest
- −$4,425
- − Property taxes
- −$1,185
- − Insurance
- −$395
- − Repairs & maintenance
- −$1,248
- − Management
- −$1,248
- − Depreciation
- −$2,298
- Taxable income
- $4,801
- Est. tax owed @ 24.0%
- −$1,152
- After-tax cash flow
- $4,620/yr
For passive investors: Depreciation is non-cash, so a rental often shows a tax loss while cash-flowing — sheltering income. Rental losses are passive: they offset passive income freely, and up to $25,000/yr can offset ordinary (W-2) income if you actively participate and your MAGI is under $100k (phasing out to $0 by $150k); unused losses carry forward. On sale, claimed depreciation is recaptured at up to 25%, and gains may owe capital-gains tax (a 1031 exchange can defer both). Figures are a year-1 estimate at your 24.0% rate — not tax advice; consult a CPA.
Schools (NCES district)
- District
- Owego-Apalachin Central School District
- NCES district ID
- 3622170
- Math proficiency
- 62% ▼ -1.00%
- Reading proficiency
- 62% ▲ 6.00%
- Median HH income
- $57,425
- Composite
- 53.45/100
- National rank
- #1464
- State rank
- #204 of 590 in NY
Livability — Owego
- Score
- 76/100
- State rank
- #214
- US rank
- #3289
Category grades
Schools grade is shown separately in the Schools card above.
Census & demographics
- Census place
- Owego, NY
- Population (ZIP)
- 11,713
Population outlook (Tioga County) Hauer SSP2
- Today (2025)
- 45,155 people
- By 2030
- 42,801 · -5.2%
- By 2040
- 37,960 · -15.9%
- By 2050
- 33,071 · -26.8%
- By 2075
- 24,144 · -46.5%
- By 2100
- 16,545 · -63.4%
Race, ethnicity, and origin ACS 2023
- Neighborhood character
- Predominantly White (93%)
- Race & ethnicity
- White 93% Two or more races 3% Hispanic / Latino 2% Asian 1%
- Common ancestry
- Romanian 5% Lithuanian 3% Iranian 2%
- Foreign-born
- 2% · China
- Languages at home
- 97% English-only · Spanish 1% Chinese 1% German/W. Germanic 1%
Political lean MEDSL · Tioga
- 2024 margin
- Strong R (+22.9) · D 38.6% · R 61.4%
- 2008→2024 swing
- -12.7pp toward R · 2008: -10.2pp · 2024: -22.9pp
- All cycles
- 2024: R+22.9 2020: R+20.6 2016: R+27.6 2012: R+15.1 2008: R+10.2
Not yet ingested
- Civics
- —
Market trends
- HPI YoY
- ▲ 8.11%
- Current HPI
- 259.9605
- Rent YoY
- —
- Metro
- —
- State GDP YoY
- ▲ 2.60%
- F500 in state
- 92
Industry mix (Fortune 500 HQ in NY)
| Industry | F500 HQs | Revenue |
|---|---|---|
| Financial Services | 10 | $950B |
|
||
| Consumer Goods | 9 | $162B |
|
||
| Insurance | 4 | $225B |
|
||
| Telecommunications | 2 | $144B |
|
||
| Pharmaceuticals | 2 | $112B |
|
||
| Media / Entertainment | 2 | $69B |
|
||
Price history
+139.4% since first listed5 events — show timeline
- 2026-04-27 Pending — GBAOR
- 2026-04-10 Listed $79,000 GBAOR
- 2025-03-16 Listed $80,000 GBAOR
- 2002-04-05 Sold (Public Records) $54,700 Public Records
- 1999-11-12 Sold (Public Records) $33,000 Public Records
Property tax history
+9.6%/yrLatest (2025): $4,091 · +71.6% YoY. Source: county tax records.
Cash-flow waterfall
monthlySold comps — $/sqft
last 12 mo · ≤1 miLoading sold comps…